Silver Long-Term Outlook: Wyckoff, Fibonacci & Volunacci in PlayOn the monthly chart, Silver is showing a strong setup for long-term investors. We can clearly identify two adjacent Wyckoff accumulation patterns, signaling institutional accumulation phases.
Price action is following an ascending Fibonacci channel, reflecting a steady bullish structure. After breaking out of the second Wyckoff pattern, a Volunacci projection has formed—pointing toward a potential move to retest its historical high near $48.
This alignment of classic technical patterns with volume-based projection tools strengthens the long-term bullish case for Silver.
XAGUSDG trade ideas

Silver expectation. 1HSilver in a bullish trend, headed for next few levels. If continuous bullish confirmations are present, hold/open trades accordingly.

SilverXAGUSD
- Descending Triangle as an corrective pattern in Short Time Frame
- Break of Structure
- Impulse correction
- Fibonacci Level - 61.80%
- S / R Level

Silver Finds Its Footing—Are the Bulls Back? (Elliott Waves)Silver rebounded quite aggressively in April, following Trump’s decision to impose a 90-day tariff pause. At the time, there was still a lot of uncertainty, so many investors turned to metals as a safe haven—particularly during periods of trade tensions.
More importantly, we can see silver forming five waves up from the 28.34 low. In Elliott Wave terms, when we see a strong directional move that can be counted in five waves, it often represents the beginning of a new trend. That means the current pause is likely just a correction, and more upside should follow.
The 31.00–31.50 area is a very interesting support zone for silver—an area from which we could see a rebound, possibly after a completed A-B-C setback from the 33.70 region.

SILVER: Target Is Down! Short!
My dear friends,
Today we will analyse SILVER together☺️
The market is at an inflection zone and price has now reached an area around 32.131 where previous reversals or breakouts have occurred.And a price reaction that we are seeing on multiple timeframes here could signal the next move down so we can enter on confirmation, and target the next key level of 31.954.Stop-loss is recommended beyond the inflection zone.
❤️Sending you lots of Love and Hugs❤️

Silver as a Proportion of M2 ExcessWe see here a parallel log channel of silver / (USM2 / USGDP), which is silver's spread over the ratio of excess M2 to GDP.
So as M2 grows over GDP and there is excess liquidity, silver becomes cheaper. As M2 shrinks relative to GDP, silver is more expensive.
The cup and handle calculated non-LOG gives a $67 breakout target and target of $128.
Or we could follow the doldrums again and head back down to the bottom channel, yet these prices are the ratio of silver to excess m2, not nominal.
If we overlay the LOG of silver and line it up, we see a discrepancy as silver should be around $89 using the spread chart. Indicating it is significantly undervalued relative to its nominal price as a proportion of excess M2.

Silver Retreats on Semiconductor TensionsSilver pulled back to around $32.50 in Friday’s Asian session, giving up part of its recent gains following reports that the U.S. plans to blacklist several Chinese semiconductor firms. Given silver’s integral role in electronics and chip manufacturing, the news weighed on sentiment.
Demand for precious metals has also weakened with easing trade tensions, as the U.S. and China agreed to reduce tariffs, cutting U.S. duties from 145% to 30% and China’s from 125% to 10%. Despite this, silver found support from a weakening U.S. dollar, which followed soft economic data reinforcing expectations for Federal Reserve rate cuts. Powell, however, warned that persistent supply shocks could complicate inflation control moving forward.
Resistance begins at $32.50, with further levels at $33.80 and $34.20. Support is seen at $31.40, followed by $30.20 and $29.80.

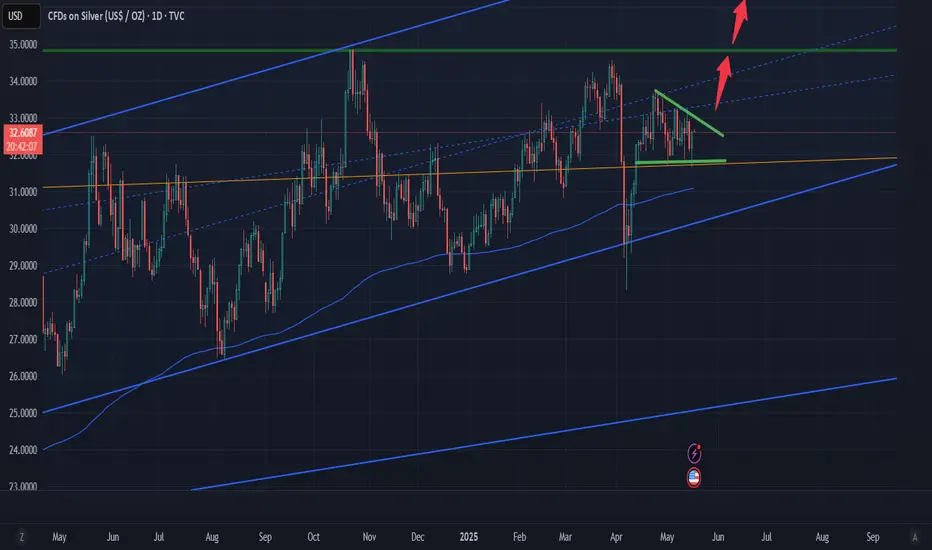
Silver mini bull flag to challenge stubborn $35Silver mini bull flag to challenge stubborn $35. I believe it will break past $35 by June to challenge $50. Anything above $50 is a blue sky.
Silver SurgeHello traders,
Hopefully everyone is doing and performing well.
My trade-idea finally shaped up after a few weeks on Silver. Patience pays:
Silver has formed a 4H corrective structure in the shape of a running channel / 3-touch flag with an accepted override. While the flag itself doesn't make the setup highly probable on its own, the higher time frame (HTF) still supports a bullish trend. Recent near-misses of previous highs suggest potential for downside liquidity grabs, but the correction may have built up enough volume to push price toward the third touch of the weekly running channel. Clockwork in the making.

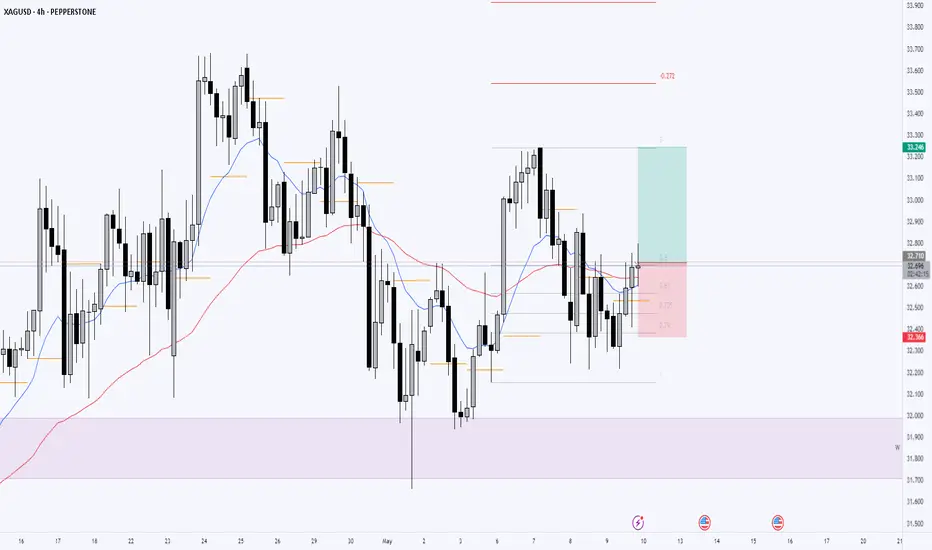
SILVER: Strong Growth Ahead! Long!
My dear friends,
Today we will analyse SILVER together☺️
The recent price action suggests a shift in mid-term momentum. A break above the current local range around 32.513 will confirm the new direction upwards with the target being the next key level of 32.783 and a reconvened placement of a stop-loss beyond the range.
❤️Sending you lots of Love and Hugs❤️

Silver Sell Setup- look for sell
- enter only when entry setup given, incase it might go higher a bit
- if lucky, this move might go all the way down to 28.00 level then 26.00 level
- Refine entry with smaller SL for better RR, if you have the strategy
"I Found the Code. I Trust the Algo. Believe Me, That’s It."

Silver Day Chart Level Wave Count: The Wave of the KingSilver daily chart level wave count: Currently, the fifth green wave is running, and today the blue second wave of the fifth green wave is corrected. The next step is the third blue wave to rise target of 44-47.

silver bulish runnow its currently around 32 atm but looking at the chart it might go for 32.3 to 35-36
some random stuff to look

SILVER / USD (XAG/USD) – Market OutlookMarket Condition: Sideways / Ranging
Bias: Bullish (Breakout Anticipation)
Strategy: Pending Buy Stop Order
Trade Plan:
I’m placing a Buy Stop above the consolidation zone to catch the breakout if price accelerates upward.
This strategy allows me to avoid false breakouts and only enter if momentum confirms direction.
Split Positioning ensures that I can lock in profits early with TP1 while letting the second trade run to TP2 if the trend strengthens.
Summary:
I’m patiently waiting for confirmation. If price breaks above the current sideways range, I’ll be in the trade with a defined risk/reward setup. Until then, I stay on the sidelines and let the market come to me — no chasing, just clean execution.
🛑 As always, manage your risk and monitor any major economic news that could trigger volatility.

Silver Shines Again! | XAGUSD Long Trade IdeaXAGUSD is showing bullish potential as price rebounded strongly from a key support zone, forming a higher low structure. On the 4H chart, price has broken above the descending trendline and is now trading above the 50 EMA – a classic bullish confirmation for trend continuation.
With bullish momentum building, a pullback to the breakout zone or the 50EMA could offer an attractive entry opportunity for long positions. Look for confirmation with bullish candlestick patterns or strong volume push.
🎯 Potential Target: Previous swing high / Pivot resistance
🛑 Stop Loss: Below recent higher low or 50EMA support zone
📚 Educational Note: In metals like silver, trendline breaks coupled with EMA alignment often provide high-probability setups. Always wait for confirmation to avoid fakeouts.
SILVER BEARS ARE STRONG HERE|SHORT
SILVER SIGNAL
Trade Direction: short
Entry Level: 3,303.1
Target Level: 3,253.1
Stop Loss: 3,336.4
RISK PROFILE
Risk level: medium
Suggested risk: 1%
Timeframe: 2h
Disclosure: I am part of Trade Nation's Influencer program and receive a monthly fee for using their TradingView charts in my analysis.
✅LIKE AND COMMENT MY IDEAS✅

Silver Eases Despite Weaker DollarSilver slipped below $31.90 on Thursday, pressured by easing safe-haven demand after the U.S. and China agreed in Switzerland to cut tariffs to 30% and 10% respectively for 90 days. While the deal briefly lifted sentiment, uncertainty looms over what comes next.
The drop in geopolitical tensions has also dampened expectations for aggressive Fed cuts. However, weak U.S. inflation data from earlier this week supported silver by softening the Dollar and improving its appeal to international buyers.
Silver faces resistance at $32.50, followed by $33.80 and $34.20. Support is found at $31.40, with lower levels at $30.20 and $29.80.

xagusdIf you look closely at the global silver analysis, you will see that a beautiful triangle has been formed, and with a break from the bottom, we will expect a drop in the price of silver.

Xagusd Sk system setupThis is a set up on silver 🥈 looking for shorts it has already triggered and now sl is at break even

XAGUSD H4 I Bullish Bounce Off Based on the H4 chart analysis, the price is falling toward our buy entry level at 31.26, a pullback support.
Our take profit is set at , a pullback resistance.
The stop loss is placed at 30.47, a pullback support.
High Risk Investment Warning
Trading Forex/CFDs on margin carries a high level of risk and may not be suitable for all investors. Leverage can work against you.
Stratos Markets Limited (tradu.com):
CFDs are complex instruments and come with a high risk of losing money rapidly due to leverage. 63% of retail investor accounts lose money when trading CFDs with this provider. You should consider whether you understand how CFDs work and whether you can afford to take the high risk of losing your money.
Stratos Europe Ltd (tradu.com):
CFDs are complex instruments and come with a high risk of losing money rapidly due to leverage. 63% of retail investor accounts lose money when trading CFDs with this provider. You should consider whether you understand how CFDs work and whether you can afford to take the high risk of losing your money.
Stratos Global LLC (tradu.com):
Losses can exceed deposits.
Please be advised that the information presented on TradingView is provided to Tradu (‘Company’, ‘we’) by a third-party provider (‘TFA Global Pte Ltd’). Please be reminded that you are solely responsible for the trading decisions on your account. There is a very high degree of risk involved in trading. Any information and/or content is intended entirely for research, educational and informational purposes only and does not constitute investment or consultation advice or investment strategy. The information is not tailored to the investment needs of any specific person and therefore does not involve a consideration of any of the investment objectives, financial situation or needs of any viewer that may receive it. Kindly also note that past performance is not a reliable indicator of future results. Actual results may differ materially from those anticipated in forward-looking or past performance statements. We assume no liability as to the accuracy or completeness of any of the information and/or content provided herein and the Company cannot be held responsible for any omission, mistake nor for any loss or damage including without limitation to any loss of profit which may arise from reliance on any information supplied by TFA Global Pte Ltd.
The speaker(s) is neither an employee, agent nor representative of Tradu and is therefore acting independently. The opinions given are their own, constitute general market commentary, and do not constitute the opinion or advice of Tradu or any form of personal or investment advice. Tradu neither endorses nor guarantees offerings of third-party speakers, nor is Tradu responsible for the content, veracity or opinions of third-party speakers, presenters or participants.

Trendline BreakThe price has shown signs of a bearish trend after making a false breakout and breaking the bullish trendline, now the price has closed with a strong bearish candle suggesting a bearish impulse is at hand
WE ONLY TRADE PULLBACKS

Silver (XAGUSD) Dip Anticipated to Spark Buyer ActivitySilver’s rally from its July 4, 2025, low has unfolded as an impulsive Elliott Wave structure, completing Wave (1) at $33.67. The metal is now in a corrective Wave (2) pullback. It is characterized by a double three Elliott Wave pattern, a common corrective formation in technical analysis. From the Wave (1) peak, Wave ((a)) declined to $32.63, followed by a recovery in Wave ((b)) to $33.53. The subsequent drop in Wave ((c)) reached $31.65, finalizing Wave W of the double three structure.
A corrective rally then formed Wave X, structured as a zigzag. Within Wave X, Wave ((a)) advanced to $32.70, Wave ((b)) pulled back to $31.91, and Wave ((c)) rose to $33.25, completing Wave X at a higher degree. Silver has since resumed its decline in Wave Y. From the Wave X high, Wave ((w)) fell to $32.20, and a minor recovery in Wave ((x)) hit $33.23. As long as Silver stays below the Wave (1) high of $33.67, further downside is expected, targeting $29.90–$31.18, based on the 100%–161.8% Fibonacci extension from the April 25, 2025, high. This range may attract buyers, potentially sparking a reversal. While the $33.67 pivot holds, rallies are likely to fail in 3, 7, or 11-swing patterns, leading to further declines. Traders should watch these levels for strategic entry points.

SILVER - ultimate area, short only below that..#SILVER.. market placed a very reasonable low in yesterday tha tis around 32.08 and bounced back.
Keep close that area because that is our ultimate area in today and if market break that level then we will go for short means ....!
That is our cut n reverse area if you are convinced in long.
Good luck
Trade wisely
