Silver 1H Trade Plan on the Basis of Support and Resistance
Silver Trade Plan Both Short and Long on the Basis of Support and Resistance
XAGUSDG trade ideas

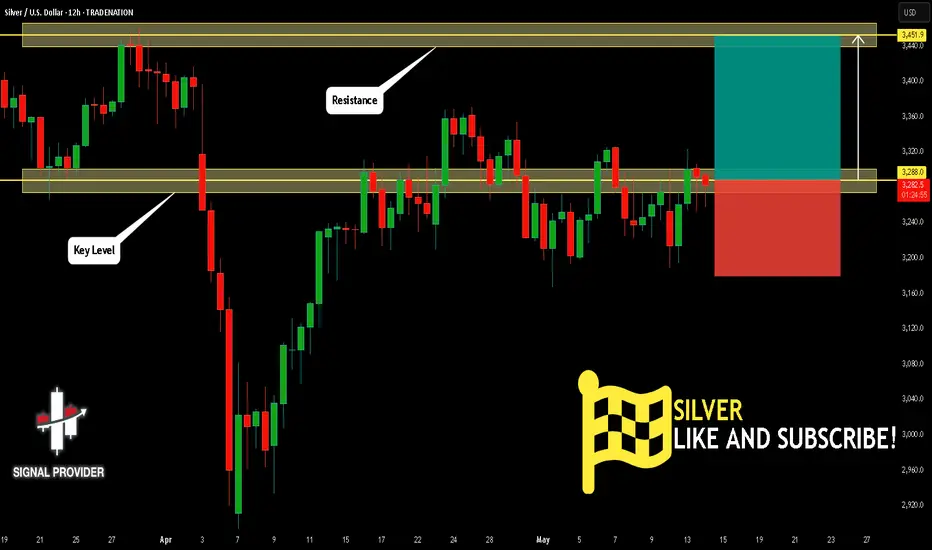
SILVER Is Going Up! Long!
Please, check our technical outlook for SILVER.
Time Frame: 12h
Current Trend: Bullish
Sentiment: Oversold (based on 7-period RSI)
Forecast: Bullish
The market is approaching a key horizontal level 3,288.0.
Considering the today's price action, probabilities will be high to see a movement to 3,451.9.
P.S
Please, note that an oversold/overbought condition can last for a long time, and therefore being oversold/overbought doesn't mean a price rally will come soon, or at all.
Disclosure: I am part of Trade Nation's Influencer program and receive a monthly fee for using their TradingView charts in my analysis.
Like and subscribe and comment my ideas if you enjoy them!
4 hour Triangle patternThe price has formed a triangle pattern followed by a false breakout and now if the price makes a higher high, we might get a bullish impulse
WE ONLY TRADE PULLBACKS

SILVER XAGUSD INTRADAY sideways consolidation breakoutKey Support and Resistance Levels
Resistance Level 1: 3332
Resistance Level 2: 3365
Resistance Level 3: 3409
Support Level 1: 3188
Support Level 2: 3138
Support Level 3: 3090
This communication is for informational purposes only and should not be viewed as any form of recommendation as to a particular course of action or as investment advice. It is not intended as an offer or solicitation for the purchase or sale of any financial instrument or as an official confirmation of any transaction. Opinions, estimates and assumptions expressed herein are made as of the date of this communication and are subject to change without notice. This communication has been prepared based upon information, including market prices, data and other information, believed to be reliable; however, Trade Nation does not warrant its completeness or accuracy. All market prices and market data contained in or attached to this communication are indicative and subject to change without notice.

SILVER: Move Up Expected! Long!
My dear friends,
Today we will analyse SILVER together☺️
The in-trend continuation seems likely as the current long-term trend appears to be strong, and price is holding above a key level of 32.838 So a bullish continuation seems plausible, targeting the next high. We should enter on confirmation, and place a stop-loss beyond the recent swing level.
❤️Sending you lots of Love and Hugs❤️

XAGUSD LongsLooking like there's direct correlation between goldie and silver, looking for longs to that 4H timeframe range high, let's see what unfolds.


SILVER Massive Short! SELL!
My dear friends,
My technical analysis for SILVER is below:
The market is trading on 32.746 pivot level.
Bias - Bearish
Technical Indicators: Both Super Trend & Pivot HL indicate a highly probable Bearish continuation.
Target -32.586
About Used Indicators:
A pivot point is a technical analysis indicator, or calculations, used to determine the overall trend of the market over different time frames.
Disclosure: I am part of Trade Nation's Influencer program and receive a monthly fee for using their TradingView charts in my analysis.
———————————
WISH YOU ALL LUCK

Short Idea on Silver (XAGUSD)Based On :
- 1h Supply covered by weekly
- POIV divergence
- IQMS Extremes about to flip

Trade idea: XAGUSD long (BUY LIMIT)1. Technical Analysis Summary:
Daily Chart (Long-Term Trend)
• Trend: Strong bullish structure, recent consolidation after breakout above $30.
• MACD: Histogram tapering but still positive — momentum cooling but bullish bias intact.
• RSI (48.70): Neutral zone, not overbought or oversold — room for upside continuation.
• Price Action: Holding near previous resistance-turned-support around $32.40.
15-Min Chart (Intraday Context)
• Trend: Pullback from recent highs, but signs of base forming near $32.40.
• MACD: Still bearish, but histogram is flattening — suggesting downside momentum weakening.
• RSI (42.98): Near oversold territory — early sign of bounce potential.
3-Min Chart (Entry Timing)
• MACD: Just flipped bullish (signal line crossover), bullish divergence spotted.
• RSI (61.34): Rebounding strongly — confirmation of short-term bullish momentum.
• Price Action: Higher lows forming; reclaiming the 20 EMA.
⸻
2. Fundamental Backdrop (as of May 2025):
• Dovish Fed stance and expectations of interest rate cuts continue to support metals.
• Global macro uncertainty (inflation, geopolitical tensions) keeps demand for silver intact.
• Industrial demand for silver remains strong due to green energy initiatives.
⸻
3. Trade Setup (Long Position):
Bias: LONG XAGUSD
• Entry: 32.43 (current price, confirming breakout on 3M chart)
• Stop Loss (SL): 31.90 (below recent intraday low and structure support)
• Take Profit (TP): 33.80 (previous swing high from April, daily resistance zone)
FUSIONMARKETS:XAGUSD

Silver Surfers & Profit Pirates!Dive into the XAG/USD Silver Market with our slick Coastal Trader Blueprint! We’re blending razor-sharp technicals with juicy fundamentals to surf both bullish and bearish waves. Ready to ride the silver tide and stack those pips? Let’s make waves! 🌊📈
🏄♂️ The Silver Surf Strategy
Entry Signals 🚦:
🐬 Bullish Ride: Catch a dip to the Coastal Support Zone at 34.200—your ticket to ride the bullish swell!
🦈 Bearish Drop: Spot a break below 31.300—dive in for the bearish plunge!
Pro Tip: Set price alerts to nab these levels! 🔔
Stop Loss (SL) 🛡️:
Bullish Trade: Anchor SL at 31.300 (4H swing low, Coastal Support Zone).
Bearish Trade: Fix SL at 33.700 (4H swing high).
Tweak SL based on risk, lot size, and order count. Stay safe—this is your lifeline! ⚓
Take Profit (TP) 🏝️:
Bullish Surfers: Aim for 36.500 or bail if the tide turns.
Bearish Surfers: Target 28.800 or slip out before the market flips.
Exit Trick: Watch RSI for overbought/oversold signals to dodge wipeouts! 🚨
🌍 Why XAG/USD?
Silver’s riding a bearish current 🐻 as of May 12, 2025, fueled by:
Fundamentals: USD strength from Fed hawkishness, US economic growth, and tariff talks.
Macroeconomics: US resilience outshines global slowdown.
COT Data (Latest Friday, May 9, 2025): Speculative net shorts on silver rise, favoring USD
Intermarket: Soaring US yields and equities lift USD, capping silver.
Quantitative: RSI (oversold hints) and Fibonacci (61.8% retracement) signal bearish bias.
📊 Sentiment Snapshot (May 12, 2025, UTC+1)
Retail Traders:
🟢 Bullish: 40% 😄 (Betting on silver’s safe-haven spark)
🔴 Bearish: 47% 😣 (USD rally and yield spikes dominate)
⚪ Neutral: 13% 🤷♂️
Institutional Traders:
🟢 Bullish: 28% 💼 (Geopolitical hedges fuel demand)
🔴 Bearish: 62% ⚠️ (USD strength and high yields crush silver)
⚪ Neutral: 10% 🧐
⚡ Market Movers: News & Risk Control 📰
Volatility’s our wave, but surf smart:
Avoid new trades during high-impact news (FOMC, NFP).
Use trailing stops to lock profits and cap losses.
Stay alert—ride the news, don’t wipe out! 🌪️
💸 Real-Time Market Data (May 12, 2025, UTC+1)
Forex (USD Pairs): USD Index (DXY) at 102.50, up 0.3% (source: Financial Juice).
Commodities CFD: Silver (XAG/USD) at 31.850, down 1.2% daily.
Metals: Gold (XAU/USD) at 2,650, down 0.8%; Copper at 4.20, flat.
Energies: WTI Crude Oil at 78.30, up 0.5%.
Crypto: BTC/USD at 62,400, down 0.4%.
Indices: S&P 500 at 5,820, up 0.2%; Nasdaq 100 at 20,100, flat.
🚀 Join the Coastal Trader Crew!
Smash the Boost Button to supercharge our Coastal Trader Blueprint and make this silver surf legendary! 🌟 Every boost powers our squad to conquer the markets. Let’s dominate XAG/USD together! 🤙
Stay locked on your charts, keep alerts active, and vibe high. See you in the profits, surfers! 🤑🎈
#CoastalTrader #XAGUSD #SilverSurf #TradingView #RideTheTide

XAGUSD SILVER BUYBy utilizing Fibonacci retracement levels, historical patterns, , we can formulate a hypothesis that the market might follow a similar trajectory if bullish sentiment prevails.

SILVER: Strong Bearish Sentiment! Short!
My dear friends,
Today we will analyse SILVER together☺️
The market is at an inflection zone and price has now reached an area around 32.455 where previous reversals or breakouts have occurred.And a price reaction that we are seeing on multiple timeframes here could signal the next move down so we can enter on confirmation, and target the next key level of 32.035.Stop-loss is recommended beyond the inflection zone.
❤️Sending you lots of Love and Hugs❤️

Silver is entered into Bearish ZoneSilver is going below to its reversal (Bearish zone) at 32.3014 level.
Stop loss is 32.6

Silver Sell Setup- Go for sell only when entry setup given
- will not enter without confirmation
- Refine entry with smaller SL for better RR, if you know how
- keep looking for sell even if price goes one more up
_______________________________________________________________________
"I Found the Code. I Trust the Algo. Believe Me, That’s Everything."

XAGUSD 11/05/2025Weekly:
-Liqudity sweep.
-Bullish Weekly candle.
Daily:
-Inverse H&S pattern.
4H:
-Bullish M pattern.
-Inverse H&S pattern.

SILVER: Bearish Forecast & Outlook
Remember that we can not, and should not impose our will on the market but rather listen to its whims and make profit by following it. And thus shall be done today on the SILVER pair which is likely to be pushed down by the bears so we will sell!
Disclosure: I am part of Trade Nation's Influencer program and receive a monthly fee for using their TradingView charts in my analysis.
❤️ Please, support our work with like & comment! ❤️

Silver USM2 Projections: 2032As we see USM2 Expand along this exponential line we can project around $33 trillion USDM2 around 2032. Silver, which is currently undervalued relative to many assets may fall again against M2, or rise. It seems to have hit resistance currently. Here I have outlined three scenarios:
Red: Silver falls against M2, but is nominally higher by 2032 at $43 an ounce.
Orange: Silver meets resistance again along this line at $72 an ounce.
Green: Silver reaches 2011 resistance at $294 an ounce.
Projecting the 1980 peak onto 2032 M2 supply gives $1746.
Of course we may see any range in between here, but buying at $33 and it being worth $43 in 2032 still outperforms 4% compounding on cash by about 10%.

SILVER INTRADAY important support at 3200Key Support and Resistance Levels
Resistance Level 1: 3300
Resistance Level 2: 3364
Resistance Level 3: 3405
Support Level 1: 3200
Support Level 2: 3136
Support Level 3: 3095
This communication is for informational purposes only and should not be viewed as any form of recommendation as to a particular course of action or as investment advice. It is not intended as an offer or solicitation for the purchase or sale of any financial instrument or as an official confirmation of any transaction. Opinions, estimates and assumptions expressed herein are made as of the date of this communication and are subject to change without notice. This communication has been prepared based upon information, including market prices, data and other information, believed to be reliable; however, Trade Nation does not warrant its completeness or accuracy. All market prices and market data contained in or attached to this communication are indicative and subject to change without notice.

SilverXAGUSD
- Break of Structure
- Completed " 12345 " Impulsive Waves and " ABC " Corrective Waves
- RSI - Divergence
- Consolidation Phase as an corrective pattern in Short Time Frame
- Order Block

Silver Softens Near $32.50 as Risk Appetite ImprovesSilver hovered around $32.50 Friday, easing from earlier highs as optimism around U.S.-UK trade progress and upcoming talks with China reduced precious metals demand. The Fed’s hold on interest rates and cautious tone also weighed on precious metals. Still, silver remains on track for a weekly gain.
Technically, resistance is seen at $33.80, followed by $34.20 and $34.85, while support levels are noted at $32.00, $31.40, and $30.20.

Silver Market Steady — Eyes on the UpsideSilver is consolidating, holding above the 32 level. Dips are being bought actively, though there's no breakout higher yet — likely just a matter of time.
There were hopes for a deeper pullback to buy around 30.8–31, but the market didn’t offer the opportunity.
I'm holding a long position with a stop just below the 32.15 support level. I believe there's a solid chance for an upside acceleration and a breakout higher.

Don't FREAK out...ZOOM out!Inverse Head and Shoulder on
the daily time frame. Don't freak
out on all the doom and gloom
predictions for silver. People are
buying this baby up. Don't doubt
me. We look super bullish to test
38 dollars towards the end of May
or around middle of JUNE.
Good luck and...
********* HAPPY SILVER HUNTING ***********
