XAGUSD Technical Outlook – July 27, 2025
Silver appears to be losing momentum at the top, and for the first time in a while, we’ve seen a strong bearish daily candle, suggesting that sellers may be stepping in more seriously.
🌀 Previous pullbacks mostly looked like profit-taking, but this drop seems to be accompanied by actual selling pressure.
Despite breaking the previous high over the past two weeks, silver has failed to extend gains meaningfully — a potential sign of exhaustion.
🎯 A low-risk short opportunity may be forming around the $38–$39 range.
⚠️ For more patient and risk-tolerant traders, a daily close below $37 could open the door for a broader correction toward the $33–$35 zone — levels that have remained untested.
Stay sharp — momentum shifts often start quietly.
XAGUSDG trade ideas
XAGUSD--SHORT--strong rejection from upper side of green channel
--for second wave of downward movement, expecting first pullback upward to 38.42 level
--entry point is cross-section of,orange channel, black channel!s upper side.
--movement will be down to lower side of green channel.

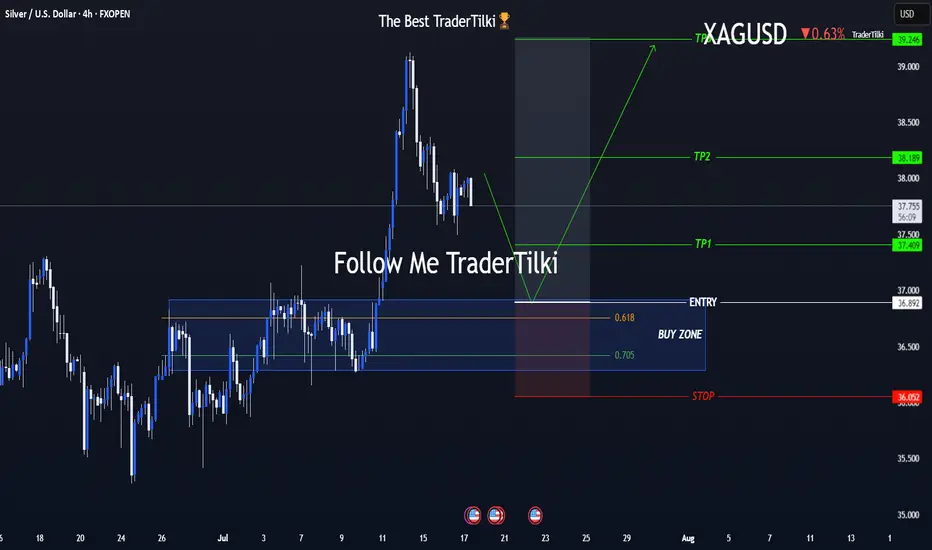
One Shot, Clear Strategy – Silver Buy Zone in SightHey everyone 👋
📌 BUY LIMIT ORDER / XAGUSD-SILVER Key Levels
🟢 Entry: 36,892
🎯 Target 1: 37,409
🎯 Target 2: 38,189
🎯 Target 3: 39,246
🔴 Stop: 36,052
📈 Risk/Reward Ratio: 2,79
I double-checked the levels and put together a clean, focused analysis just for you. Every single like seriously boosts my motivation to keep sharing 📈 Your support means the world to me! Huge thanks to everyone who likes and backs this work 💙 Our goals are crystal clear, our strategy is solid. Let’s keep moving forward with confidence and smart execution!
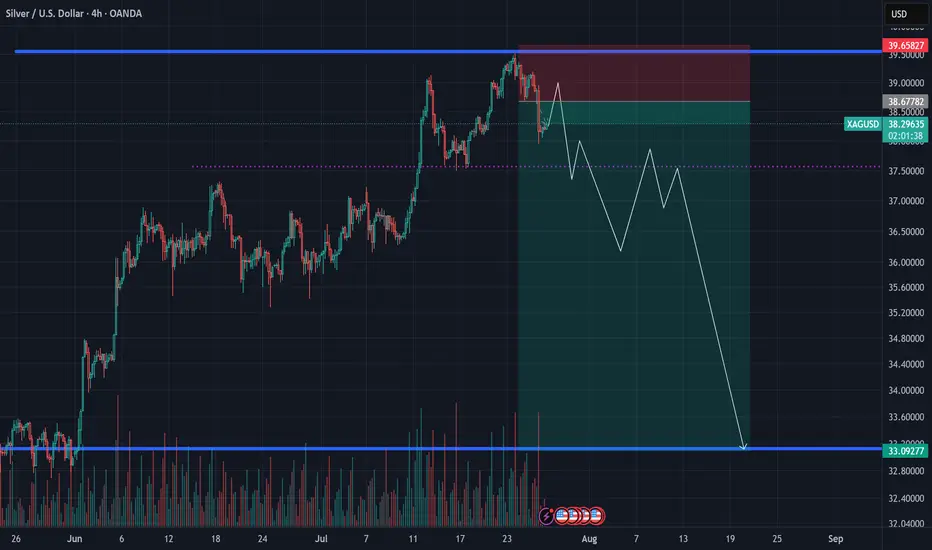
XAGUSD | Silver Rebounds from 37.50 After 39.50 RejectionSilver pulled back sharply after failing at the 39.50 resistance zone. Price is currently consolidating just above the 37.50 support area, which has held firm on the initial retest.
Support at: 37.50 / 37.00 🔽
Resistance at: 39.50 🔼
🔎 Bias:
🔼 Bullish: A clean breakout above 39.50 could resume the uptrend.
🔽 Bearish: A break below 37.50 opens room toward 37.00 and 36.00.
📛 Disclaimer: This is not financial advice. Trade at your own risk.

Do you agree with me for XAGUSD?
Hi my friends
Do you think silver is still bullish?
I think it is bullish for now. Shall we go buy together?

XAGUSD LONG SETUP Silver price is still in a falling wedge pattern after creating the minor Ascending wedge and couldn't breakout further, so still consolidating in the wedge, so will see to which side proce decides to break.

XAG USD LONG RESULT Silver price broke down the Ascending Channel it was trading in and gormed a weak falling wedge pattern with low selling pressure, so I expected buyers to change the momentum and go for the upside, which did just not reaching to the oder block I set.
But a good trade overall, still closed at BE.
Better Setups Ahead 💪
_THE_KLASSIC_TRADER_.

Silver is in the Bearish trend after testing ResistanceHello Traders
In This Chart XAGUSD HOURLY Forex Forecast By FOREX PLANET
today XAGUSD analysis 👆
🟢This Chart includes_ (XAGUSD market update)
🟢What is The Next Opportunity on XAGUSD Market
🟢how to Enter to the Valid Entry With Assurance Profit
This CHART is For Trader's that Want to Improve Their Technical Analysis Skills and Their Trading By Understanding How To Analyze The Market Using Multiple Timeframes and Understanding The Bigger Picture on the Charts

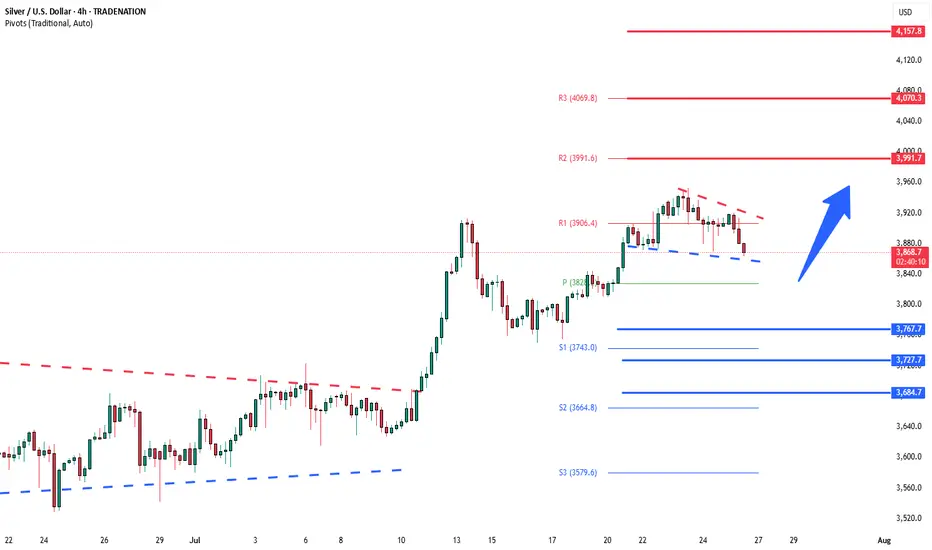
SILVER Trading Opportunity! BUY!
My dear friends,
Please, find my technical outlook for SILVER below:
The price is coiling around a solid key level - 38.174
Bias - Bearish
Technical Indicators: Pivot Points High anticipates a potential price reversal.
Super trend shows a clear sell, giving a perfect indicators' convergence.
Goal - 38.708
About Used Indicators:
The pivot point itself is simply the average of the high, low and closing prices from the previous trading day.
Disclosure: I am part of Trade Nation's Influencer program and receive a monthly fee for using their TradingView charts in my analysis.
———————————
WISH YOU ALL LUCK
Silver lets buy the dipB:$37.862
Set up: Buy on the pullback at 0.50 or 0.618 Fib level.
SL:$37.310
TP:$40

"XAG/USD: Pirate’s Treasure Trade! Bullish & Loaded"🚨 SILVER HEIST ALERT! 🚨 XAG/USD Bullish Raid Plan (Thief Trading Style) 💰🎯
🌟 Attention Market Pirates & Profit Raiders! 🌟
🔥 Thief Trading Strategy Activated! 🔥
📌 Mission Brief:
Based on our elite Thief Trading analysis (technical + fundamental heist intel), we’re plotting a bullish robbery on XAG/USD ("The Silver Market"). Our goal? Loot profits near the high-risk resistance zone before the "Police Barricade" (bear traps & reversals) kicks in!
🚨 Trade Setup (Day/Swing Heist Plan):
Entry (📈): "The vault is open! Swipe bullish loot at any price!"
Pro Tip: Use buy limits near 15M/30M swing lows for safer pullback entries.
Advanced Thief Move: Layer multiple DCA limit orders for maximum stealth.
Stop Loss (🛑): 36.900 (Nearest 1H candle body swing low). Adjust based on your risk tolerance & lot size!
Target (🎯): 39.500 (or escape early if the market turns risky!).
⚡ Scalper’s Quick Loot Guide:
Only scalp LONG!
Rich thieves? Go all-in! Broke thieves? Join swing traders & execute the plan slowly.
Use trailing SL to lock profits & escape safely!
💎 Why Silver? (Fundamental Heist Intel)
✅ Bullish momentum in play!
✅ Macro trends, COT data, & intermarket signals favor upside!
✅ News-driven volatility? Expect big moves!
⚠️ WARNING: Market Cops (News Events) Ahead!
Avoid new trades during high-impact news!
Trailing stops = Your best escape tool!
💥 BOOST THIS HEIST!
👉 Hit LIKE & FOLLOW to strengthen our robbery squad! More lucrative heists coming soon! 🚀💰
🎯 Final Note: This is NOT financial advice—just a thief’s masterplan! Adjust based on your risk & strategy!
🔥 Ready to Raid? Let’s STEAL Some Profits! 🏴☠️💸
👇 Drop a comment & boost the plan! 👇
#XAGUSD #SilverHeist #ThiefTrading #ProfitPirates #TradingViewAlerts
(🔔 Stay tuned for the next heist!) 🚀🤫

XAG longXAG prices may rise from $37.9, located at the FVG Zone and Leg of BAT Pattern , towards the targets .

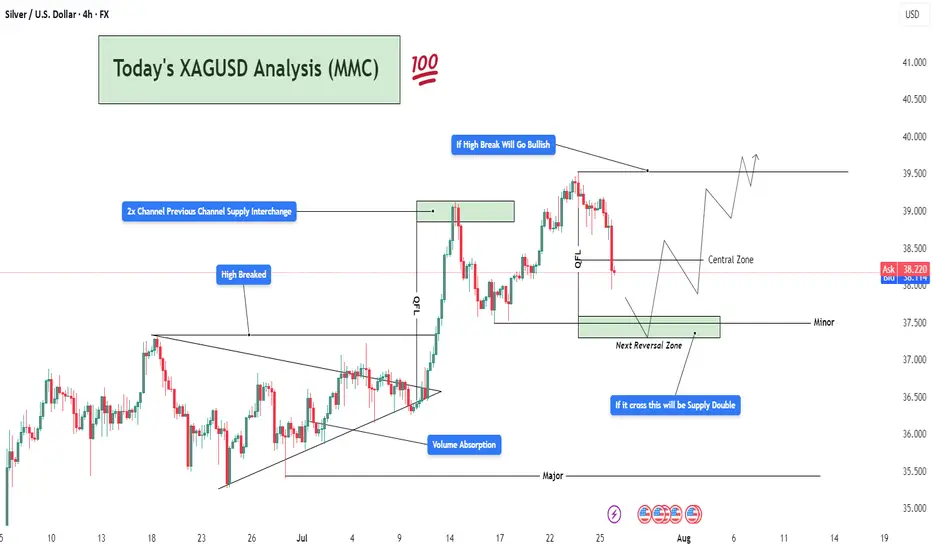
(XAGUSD) Volume Absorption to Bullish Continuation To Target🧱 1. Market Structure Breakdown:
The 4H chart of Silver (XAGUSD) reveals a well-structured price action sequence, beginning with a compression breakout, a strong bullish impulse, and a current retracement phase into a key reversal zone.
🔺 Symmetrical Triangle & Volume Absorption (Early July):
The market was forming higher lows and lower highs, indicative of consolidation inside a symmetrical triangle.
During this phase, a volume absorption event occurred—indicating smart money was accumulating before a breakout.
This was followed by a strong bullish breakout, confirming upside strength and clearing previous highs.
📈 2x Channel Supply Zone — Now Demand:
After breaking above the triangle, the price surged into a key supply zone, created from a prior channel top.
This zone was tested, absorbed, and flipped into a new demand zone, as buyers overwhelmed sellers.
This supply-demand interchange confirmed a structural change in market sentiment.
🚀 2. Momentum Confirmation — High Breakout:
The "High Breaked" level, marked clearly on the chart, acted as a bullish breakout trigger.
This breakout not only breached the prior resistance but established a new bullish leg—providing strong confirmation of trend continuation.
🔁 3. QFL Zone & Controlled Pullback:
After the surge, the price began to correct from the QFL (Quick Flip Level).
This level usually represents an area where short-term distribution or profit-taking occurs.
The pullback from this zone was controlled but sharp, which is natural after such a strong move up.
🟩 4. Next Reversal Zone — The Critical Demand Block:
Price is now entering a high-probability reversal zone, marked around $37.5–$36.8.
This area is critical due to:
Confluence with previous structure and minor support.
Potential bullish absorption area.
Last base before the impulse up.
If bullish price action (like bullish engulfing, pin bar, or volume spike) is seen here, it could signal the start of the next leg up.
🧨 5. Key Warning: "If it crosses, this will be Supply Double"
If this zone fails to hold, the demand will flip into double supply, likely accelerating bearish momentum.
In such case, Silver may revisit Major Support near the $36.0–$35.5 zone.
🧭 Potential Trading Scenarios:
✅ Bullish Path (Primary Expectation):
Price reacts from the reversal zone with bullish momentum.
Breaks back into the Central Zone (~$38.5).
Forms a higher low → continuation toward $39.5–$41.0.
Breakout above the recent swing high confirms the continuation pattern.
Trade Idea:
Long entries near $37.2–$37.5 with SL below $36.8.
Target zones: $38.8 (short-term), $39.8–$41.0 (swing).
❌ Bearish Continuation (Alternative Plan):
Reversal zone fails to hold.
Price breaks and closes below $36.8.
Previous support becomes resistance — bearish retest.
Continuation toward $36.0–$35.5 zone.
Trade Idea:
Short on break and retest of $36.8.
SL above the reversal zone.
TP near $35.5 or based on volume exhaustion.
🧠 Market Psychology Insight:
This setup shows a clear institutional playbook:
Accumulation → Breakout → Profit-taking → Retest → Continuation.
If smart money is active, expect defense of the reversal zone followed by a strong bounce.
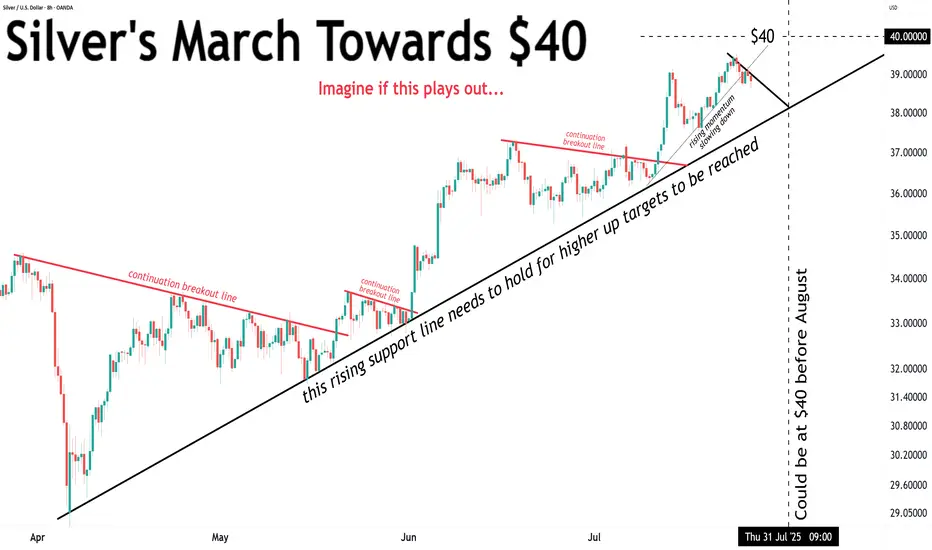
Silver’s short-term momentum is slowing down...Silver’s short-term momentum is slowing down...
Will it have enough juice to crack $40 before August?
🍿🍿🍿
XAGUSD - Silver - Important levels for the next few years!!These are important levels for the next few years.
I expect a new ATH for Silver. Better know where you buy and where you should sell.
Several CUP & Handle show how much silver is bullish.
After Gold, it's Silver's turn..

The biggest cup&handle of all times: silver targets $50The data suggests a cup&handle:
Cup was between 1980-2011
Handle is still in progress and probably may finish by 2025 or earlier.
For the short run: a re-test of low re-accumulation range of $23 can be seen.
The next mid-term target will be $25.
Final target will be $50.

XAGUSD SILVER ON 3OTH we are expecting a strong fundamental data .
ADP Non-Farm Employment Change forecast 82K previous -33K
Advance GDP q/q forecast 2.4% previous -0.5% Advance GDP Price Index q/q forecast 2.3% previous 3.8%
Pending Home Sales m/m0.3% 1.8%
7:00pm
USD
Federal Funds Rate
4.50% 4.50%
USD
FOMC Statement
7:30pm
USD
FOMC Press Conference.
we will be watching the data outlook for clear directional bias.

SILVER XAGUSD ON 3OTH we are expecting a strong fundamental data .
ADP Non-Farm Employment Change forecast 82K previous -33K
Advance GDP q/q forecast 2.4% previous -0.5% Advance GDP Price Index q/q forecast 2.3% previous 3.8%
Pending Home Sales m/m0.3% 1.8%
7:00pm
USD
Federal Funds Rate
4.50% 4.50%
USD
FOMC Statement
7:30pm
USD
FOMC Press Conference.
we will be watching the data outlook for clear directional bias.

XAGUSD--SHORT--rejecting from upper side of channel
--potential downward movement towards horiantal line labeled as TP on the chart

LONG SILVERDirection: Bullish
Moving Average: Red above Blue
Pattern Impulse: Impulse correction
Fib Retracement: 38.2
MACD > 0
1st Target = 39.11
2nd Target = 39.87
RISK: Silver already making new highs

Head & Shoulders Pattern Confirmed bearish sign A clear Head and Shoulders pattern has formed on the 4H timeframe, and confirmation is in place after a decisive break below the neckline around $39.00.
🔍 Technical Breakdown:
Left Shoulder: Formed around July 11–15
Head: July 19–23 peak
Right Shoulder: Developing through July 24–25
Neckline: ~$39.00 zone (now broken)
Current Price: ~$38.30
Target: ~$38.00 – $37.80 (based on pattern projection)
The break below the 50 EMA adds bearish confirmation. Caution is advised unless price reclaims the neckline level.

Chart Analysis on the SilverYou can follow us for more Analysis(Images and Videos) with Precise definition of the Financial Market.ENJOY!!!

Silver bullish sideways consolidation The Silver remains in a bullish trend, with recent price action showing signs of a continuation breakout within the broader uptrend.
Support Zone: 3686 – a key level from previous consolidation. Price is currently testing or approaching this level.
A bullish rebound from 3686 would confirm ongoing upside momentum, with potential targets at:
3814 – initial resistance
3865 – psychological and structural level
3920 – extended resistance on the longer-term chart
Bearish Scenario:
A confirmed break and daily close below 3686 would weaken the bullish outlook and suggest deeper downside risk toward:
3645 – minor support
3590 – stronger support and potential demand zone
Outlook:
Bullish bias remains intact while the Silver holds above 3686. A sustained break below this level could shift momentum to the downside in the short term.
This communication is for informational purposes only and should not be viewed as any form of recommendation as to a particular course of action or as investment advice. It is not intended as an offer or solicitation for the purchase or sale of any financial instrument or as an official confirmation of any transaction. Opinions, estimates and assumptions expressed herein are made as of the date of this communication and are subject to change without notice. This communication has been prepared based upon information, including market prices, data and other information, believed to be reliable; however, Trade Nation does not warrant its completeness or accuracy. All market prices and market data contained in or attached to this communication are indicative and subject to change without notice.