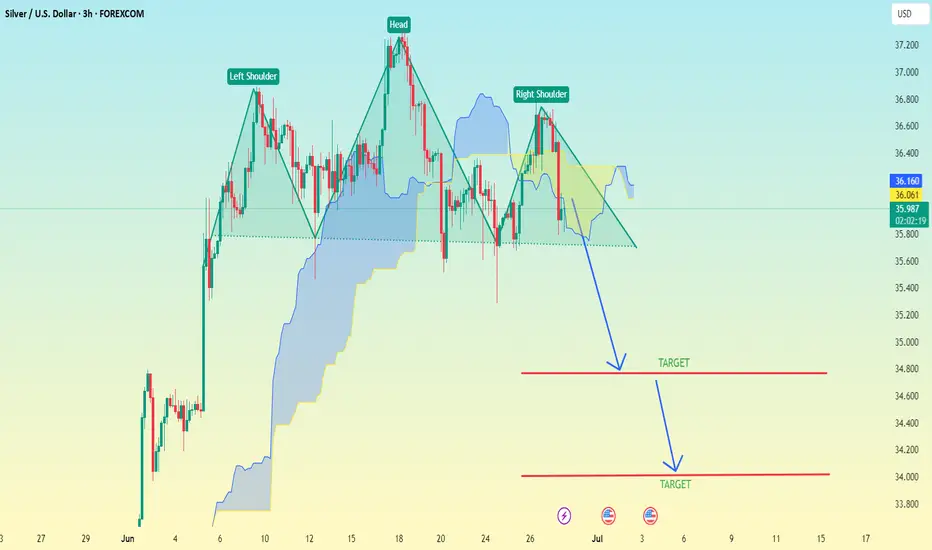
(XAG/USD – Silver vs USD–3h timeframe) Head and Shoulder Pattern(XAG/USD – Silver vs USD – 3h timeframe), a Head and Shoulders pattern is clearly marked, which is a bearish reversal signal.
Key Details:
Pattern: Head and Shoulders
Neckline: Approximately at the 35.90–36.00 level
Breakout Direction: Down
Measured Move Target Method: To estimate the target, subtract the height from the head to the neckline from the neckline level.
---
Target Estimation:
Head High: ~36.95
Neckline Level: ~35.90
→ Difference: 36.95 - 35.90 = 1.05
Target 1 (conservative): 35.90 - 1.05 = 34.85
Target 2 (aggressive): Based on the secondary arrow and extended support, it's pointing toward ~34.00–34.20
---
📉 Final Targets:
✅ First Target: 34.85
✅ Second Target: 34.00–34.20 (if bearish momentum continues)
Let me know if you want stop-loss or risk management levels included.
XAGUSDK trade ideas
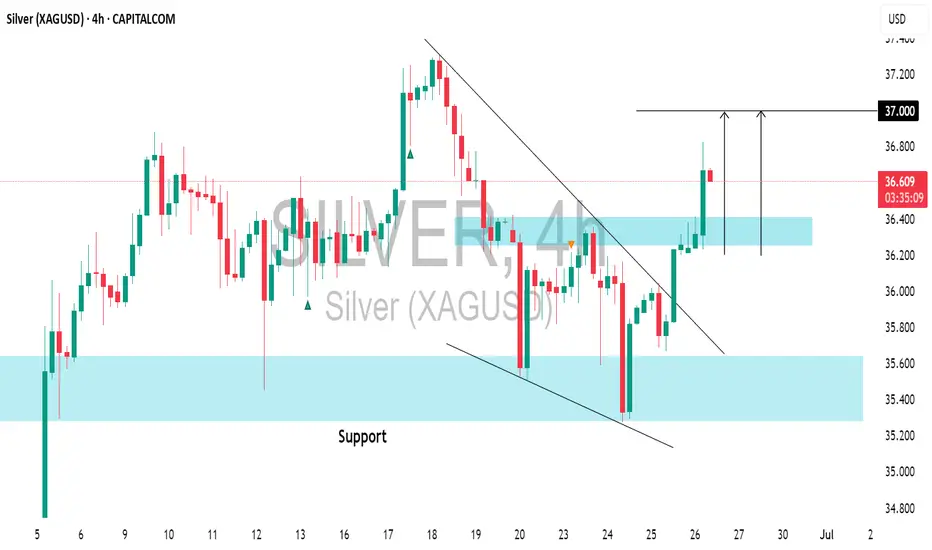
SILVER (XAGUSD): Intraday Bullish Confirmation?!📈SILVER appears to be on a bullish trend following a bounce off crucial daily/intraday horizontal support.
The price broke through a resistance line of a descending channel and created a local Change of Character (CHoCH).
There is a strong likelihood that the price will keep rising, with a target of 37.00.
XAGUSD – Bullish Setup for a Move Toward 40 1. What happened recently
After the massive selloff in early April, Silver (XAGUSD) reversed aggressively — gaining nearly 10,000 pips and breaking into multi-decade highs near 38. That kind of move is not noise. It’s power.
The month of June brought consolidation, with price slowly correcting and stabilizing. But this doesn’t look like distribution — it looks like new accumulation.
2. The key question
Is Silver building a base for the next breakout, or has the rally run out of steam?
3. Why I expect another leg up
- 35.00 is now acting as a solid support — tested, respected
- The correction has been shallow, typical for a bull rectangle structure
- Momentum remains on the buyers’ side — no major breakdown signs
- If buyers step in strongly, the next target is clearly the 40.00 psychological level
- This is a textbook bullish continuation setup.
4. Trading plan
Swing traders should watch the 35.00–35.20 zone for buying opportunities.
The risk/reward is attractive — with a potential for +5000 pips on a move toward 40, while keeping stops under the base.
Buy the dips — not the breakouts.
5. Final thoughts 🚀
Silver is shining again. The trend is up, the structure supports further gains, and the chart is offering a clean setup. Until 35 fails, the bias remains bullish.
Disclosure: I am part of TradeNation's Influencer program and receive a monthly fee for using their TradingView charts in my analyses and educational articles.

Silver bearish IdeaHi all! This is my first post and I'm pretty new to this. But I think the best way to learn is to just go for it. So this idea might be super stupid, but at least I'm trying :)
Happy trades!

SILVER (XAGUSD): Pullback From SupportIt seems that the time has come for 📈SILVER to experience a pullback.
This morning, I've observed a solid intraday bullish signal with the emergence of a head and shoulders pattern on the 4-hour chart.
I anticipate a pullback to at least 36.61, followed by a move to 36.95.

SILVER (XAGUSD): Waiting For BreakoutIt appears that ⚠️SILVER is gearing up for a bullish trend.
Analyzing the 4H time frame, I spotted a falling wedge pattern and a confirmed breakout above its upper boundary.
The final hurdle for buyers is the 36.11 - 36.17 neckline of a cup and handle pattern.
If the bulls manage to break and close above this level, it will serve as a significant bullish signal, likely leading to a continuation towards at least 37.00.

"SILVER (XAGUSD) July Breakdown = Trend Reversal SetupSilver’s explosive rally may be running out of steam — the July setup is screaming SELL.
📌 Using Vinnie’s Trading Cheat Code System, here’s the case:
✅ CC SELL confirmed near the 37.30 zone
✅ RSI Overbought printed — classic blow-off top conditions
✅ MACD rolling over + weakening momentum
✅ Price rejected cleanly from the top of trend channel
🎯 Bearish targets:
34.60 – first reaction zone / channel midpoint
32.80 – channel base and high-volume node
This is a prime setup for a mean reversion trade or trend reversal, depending on how July opens. Looking to build shorts into rallies.
🧠 Powered by:
Confirm Alerts
CC MACD Screener
RSI OB/OS Zones
Cheat Code Trend Indicator
Watch for continued weakness below 35.80 to confirm momentum shift.

Silver (XAG/USD) on the 1-hour timeframe.Silver (XAG/USD) on the 1-hour timeframe, the chart shows a bullish breakout from a symmetrical triangle pattern. Here's the target breakdown:
📈 Silver Bullish Targets:
Current Price: Around 36.42
1st Target (TP1): Approximately 36.95 – 37.00
2nd Target (TP2): Approximately 37.40 – 37.50
These targets are based on the breakout from the triangle and previous resistance zones marked on your chart.
🛑 Suggested Support Zone (Breakout Retest Area):
Around 36.00 – 36.20 (acts as support now after the breakout)
If price holds above this zone, the bullish structure remains valid. Let me know if you'd like stop loss suggestions or lower timeframe analysis.

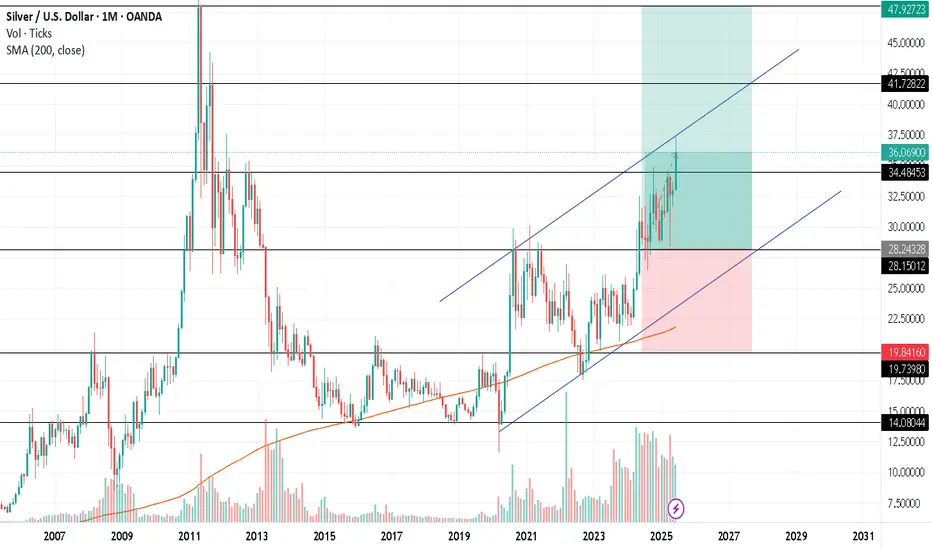
$18 retest.Silver historically always crushes the bulls when they are most hopeful for a parabolic breakout.
Even if we are at the start of a super bull cycle in silver, the bull market MUST have massive retracements to achieve insane highs. The higher and faster a bull market goes up without complete washouts along the way, the lower the final ATH.

This is the thing about silver & recessions...This is the thing about silver & recessions...
You can STILL have price rocket upwards heading into it.

Silver’s "make-or-break" moment.Silver’s "make-or-break" moment.
Price is heading straight for that rising line...
If it holds, this could be the last lower-risk entry area before the rush toward $40.

Silver could also outperform the stock market by 52%?Silver would need to rally 33% from current levels to retest its potential historical breakout line around $48.
If that happens in sync, silver could also outperform the stock market by 52% — reaching its own breakout level on the silver vs. stocks ratio chart.

Silver Looking For A Support Of wave 4 at 36.37Silver retested the lows of the week and even broke slightly below the spike from June 12, where the market previously found support at 35.46. We highlighted that as a key area for potential stabilization, especially since there were likely a lot of stops, just below it. So it's no surprise that the market turned around from there and is now trying to stabilize. I’m starting to think the a-b-c drop could already be finished in wave 4.
A daily close above 36.37 would confirm a continuation higher.
We can also see some RSI divergence between waves A and C, which further suggests that silver may be coming down into strong support.

Possible Movement of Silver: Watch the Golden Zone RetestSilver has broken above a two-top downtrend with a strong bullish impulse, marked by a long white candle. Currently, it appears to be forming a Head and Shoulders pattern. A break below the neckline and the supporting uptrend could lead price back to the golden zone—around the base of the breakout candle—before resuming its upward move toward the main target near $39.

KOG - SILVERSILVER
As with gold and oil, looking at this expecting a gap on open and potential for a move driven by the news. If we do spike down, the red box is the level to watch with the red box levels above as potential target levels on the breaks.
Please do support us by hitting the like button, leaving a comment, and giving us a follow. We’ve been doing this for a long time now providing traders with in-depth free analysis on Gold, so your likes and comments are very much appreciated.
As always, trade safe.
KOG

SILVER (XAGUSD): Buyers Show Strength
Silver is going to rise more, following a strong bullish sentiment this morning.
The price violated a strong falling trend line and an intraday horizontal resistance.
These 2 breakouts indicate a strong buying pressure.
The price may grow more today and reach 37.14 level.
❤️Please, support my work with like, thank you!❤️
I am part of Trade Nation's Influencer program and receive a monthly fee for using their TradingView charts in my analysis.

Silver - M30What a breath-taking EDGE...
Wait for confirmation then enter...
Please Manage Your Risk.
#Silver #XAGUSD #Forex #chart #Edge #MJTrading

Silver - overview with Initiative AnalysisHey traders and investors!
Hourly Timeframe
📍 Context
The hourly chart is in a sideways range.
Currently, the buyer has the initiative, potential target 36.55.
📊 Key Actions
The 35.30 level on the hourly timeframe has worked well. This level marks the correction extreme within the dominant buyer initiative (i.e., an initiative where the correction is less than 50%).
A seller attack bar (IKC) targeting the lower boundary of the sideways range was absorbed by the buyer, and this absorption led to a renewed buyer. Targets visible on the chart - Hourly and daily timeframe: 36.55 and 36.89
Daily Timeframe
📍 Context
Currently, the buyer has the initiative, potential target 36.89.
📊 Key Actions
On the daily timeframe, there was also a seller IKC bar attacking the lower boundary of the buyer's initiative, which was bought back by the buyer.
🎯 Trade Idea
Potential buying patterns can now be monitored at: 36.20, 36.05, 35.67, 35.458
With targets set at: 36.55, 36.89, 37.32.
This analysis is based on the Initiative Analysis concept (IA).
Wishing you profitable trades!

SILVER BEARS ARE STRONG HERE|SHORT
SILVER SIGNAL
Trade Direction: short
Entry Level: 3,607.1
Target Level: 3,250.7
Stop Loss: 3,843.0
RISK PROFILE
Risk level: medium
Suggested risk: 1%
Timeframe: 1D
Disclosure: I am part of Trade Nation's Influencer program and receive a monthly fee for using their TradingView charts in my analysis.
✅LIKE AND COMMENT MY IDEAS✅

Silver - Daily - LongXAGUSD D1 Continuation play with these confluence factors:
- Trending: Silver (Gold and other precious metals) trending up
- Support level: Consolidating around the $35 level
- Signal: Two bullish pin bars

Market next target 🔀 Disruption Analysis - Alternative Scenario
While the current chart suggests a bullish breakout from the support area around $35.85–$35.90 with an upward target above $36.20, a potential bearish disruption scenario could unfold under the following conditions:
⚠️ Bearish Disruption Possibility:
1. Weakening Buying Pressure:
Price has tested the support zone multiple times, showing signs of weakening bullish momentum.
Buyers may be exhausting near the $36.00 area without strong follow-through.
2. Break Below Support:
If price breaks and closes below $35.85 support zone on high volume, it could invalidate the bullish setup.
This would create a lower low, indicating a potential trend reversal to the downside.
3. Next Downside Targets:
Immediate support lies around $35.60.
Further downside could take price to $35.40 if bearish momentum strengthens.
4. Bearish Triggers:
Negative economic data (especially U.S.-related as indicated by the calendar icon).
Rising DXY or bond yields may pressure silver prices

XAGUSD is BullishPrice went down on a small retracement and with double bottom and bullish divergence we can expect a rebound from here. If previous lower high is broken then we can expect a bullish reversal on 15 min time frame. Targets are mentioned on the chart.