Silver 12 months consolidation box completedSilver 12 months consolidation box completed. On the way to $40, then $50, then blue sky...... get ready. Position position.
XAGUSDK trade ideas

SILVER TO 40$ HELLO TRADERS
As i can see Silver is still trading inside a upward channel and did not created any big moves like Gold and its under value i am expected a boost from this zone to 40 $ incoming days if it did notr break the channel friends its just a trade idea share ur thoughts with us we love ur comments and support Stay Tuned for more updates

Silver - How long have you waited?Silver 30 year Cup & handle break out.
Is the silver squeeze finally happening?
Credit to @EdTheLorax calling it

Silver(XAG) Long Set-UPTVC:SILVER MCX:SILVER1!
📈 𝐏𝐫𝐨𝐟𝐞𝐬𝐬𝐢𝐨𝐧𝐚𝐥 𝐓𝐚𝐤𝐞𝐚𝐰𝐚𝐲:
𝐁𝐮𝐥𝐥𝐢𝐬𝐡 𝐁𝐢𝐚𝐬 🚀
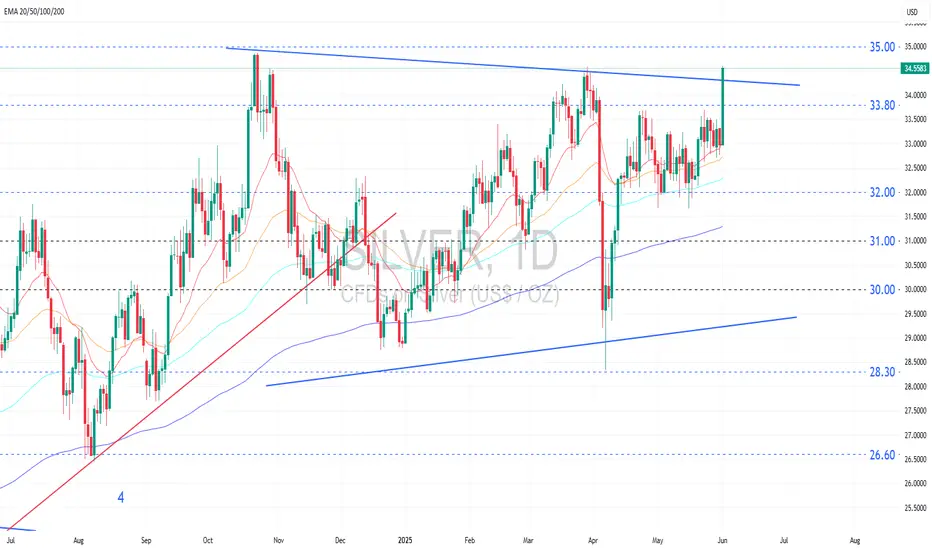
The technical setup points toward a potential breakout after a 13-year consolidation.
If silver breaks above ~$35 convincingly on a monthly close, the next key target would be $48–$50 (2011 highs).
⚠️ 𝐂𝐚𝐮𝐭𝐢𝐨𝐧
This is a major resistance; failure to break above it may result in a pullback or consolidation.
A rejection here would keep silver in the range-bound regime, especially if the trendline support (~$30) breaks.
🧠 𝐒𝐭𝐫𝐚𝐭𝐞𝐠𝐢𝐜 𝐕𝐢𝐞𝐰
Position traders/investors might look to accumulate on dips near the trendline or on a confirmed breakout retest.
𝐑𝐢𝐬𝐤 𝐦𝐚𝐧𝐚𝐠𝐞𝐦𝐞𝐧𝐭 𝐢𝐬 𝐜𝐫𝐮𝐜𝐢𝐚𝐥 𝐡𝐞𝐫𝐞: set stops below the trendline or prior swing lows.
Macro tailwinds (inflation, rate cuts, weakening USD, geopolitical stress) will play a pivotal role in confirming this breakout technically and fundamentally

Silver got a healthy breakout and appears reasonably trend folloSilver got a healthy breakout and appears reasonably attractive as a buy following the signal.
1. After an extended consolidation, silver has broken out of its upper range to retest the previous swing high.
This breakout from its sideways range is technically significant, reinforced by a strong bullish candlestick that indicates robust upward momentum. Another $0.50 move would mark the highest level in over 12 years, which could attract a surge of speculative buying which may ignite the following surge.
2. Fundamentally, silver prices are rising in tandem with gold, as silver serves as an alternative investment in the precious metals group and acts as a reliable safe-haven asset, making this rally justifiable.
3. Especially in the current situation, where economic fragility, unresolved trade issues, and escalating geopolitical tensions are all pushing investors toward precious metals.
4. In addition, the unusually large amount of US debt maturing during this month has contributed to a weaker US dollar, which in turn provides further support for precious metal prices.
Analysis by: Krisada Yoonaisil, Financial Markets Strategist at Exness
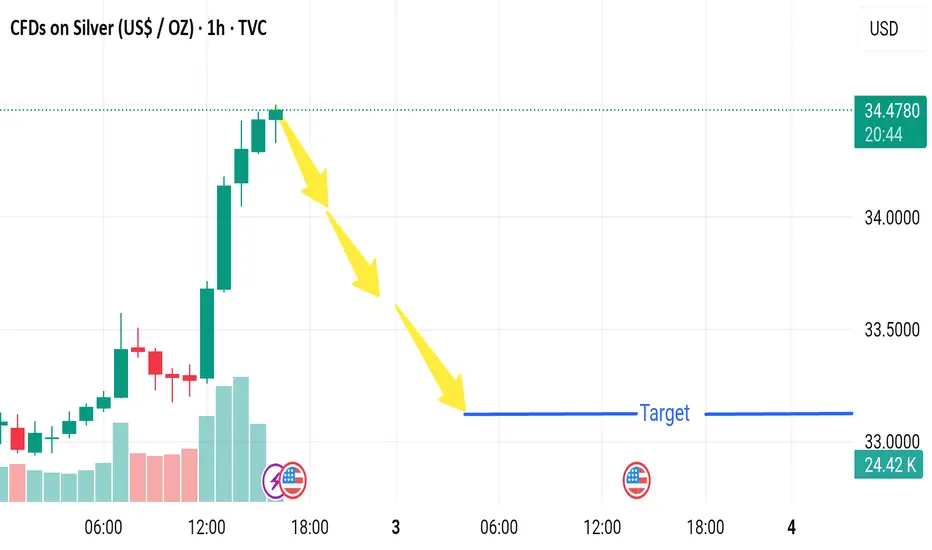
Market next target 🟢 Disruptive Bullish Scenario:
🔁 1. Healthy Bull Flag or Consolidation
The steep rally (+4.5%) may not lead to a breakdown.
The current pause near $34.50 could be a bull flag or tight range consolidation, common in continuation patterns.
🔼 2. Volume Supports the Move
Notice the strong rising volume on the breakout candles.
This shows genuine buyer interest, not a pump-and-dump move.
🧲 3. Breakout Holding Above Previous Highs
Price is holding above previous resistance, which now acts as support around $34.00–$34.20.
Holding this zone can lead to a retest and breakout to new highs.
📈 4. Strong Macro Bullish Catalyst
The U.S. event icon suggests important data is near.
If the data (like weaker dollar or inflation concerns) supports metals, Silver could surge further rather than drop.
SILVER: The Market Is Looking Down! Short!
My dear friends,
Today we will analyse SILVER together☺️
The market is at an inflection zone and price has now reached an area around 34.374 where previous reversals or breakouts have occurred.And a price reaction that we are seeing on multiple timeframes here could signal the next move down so we can enter on confirmation, and target the next key level of 33.902..Stop-loss is recommended beyond the inflection zone.
❤️Sending you lots of Love and Hugs❤️

SilverCurrent Price: $32.33
Mid-point: $32.07
Upside: $33.21, $33.77, $34.40 and $35.03
Downside: $30.94, $30.38, $29.75 and $29.11
Stoploss: $31.49
Resistance: $32.66

SILVER Massive Long! BUY!
My dear friends,
My technical analysis for SILVER is below:
The market is trading on 32.985 pivot level.
Bias - Bullish
Technical Indicators: Both Super Trend & Pivot HL indicate a highly probable Bullish continuation.
Target - 33.258
About Used Indicators:
A pivot point is a technical analysis indicator, or calculations, used to determine the overall trend of the market over different time frames.
Disclosure: I am part of Trade Nation's Influencer program and receive a monthly fee for using their TradingView charts in my analysis.
———————————
WISH YOU ALL LUCK

#336025 | XAGUSD Supply Zone 1:4XAGUSD Supply Zone Appears in H4 Time Frame Looking Price Action for Long Term Sell Risk and Reward Ratio is 1:4
After 50 pips Profit Set SL Entry Level
"DISCLAIMER" Trading & investing business is "Very Profitable" as well as risky, so any trading or investment decision should be made after Consultation with Certified & Regulated Investment Advisors, by Carefully Considering your Financial Situation.

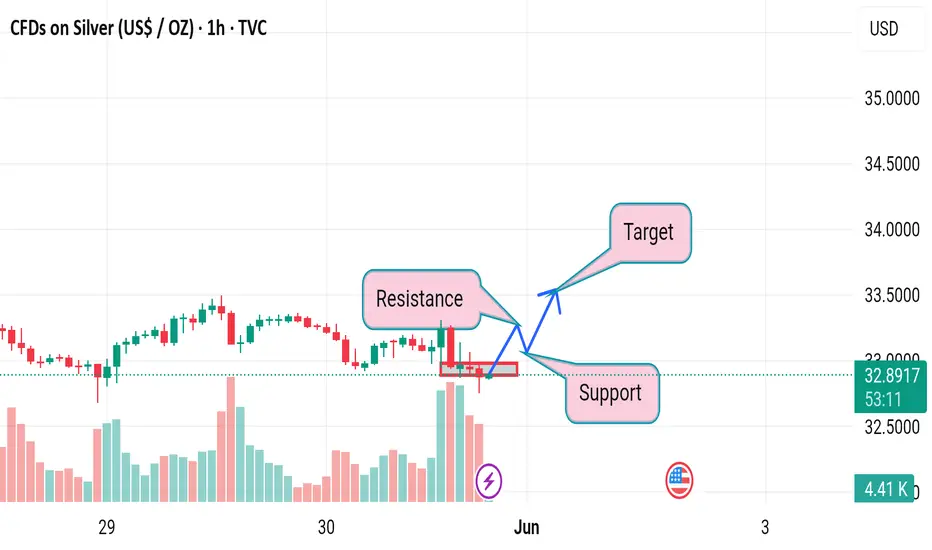
Market next target 🔍 Original Analysis Summary:
Bullish Continuation is expected.
Price is projected to rise with a series of higher highs (yellow arrows).
Target area is marked above 34.000 USD.
---
⚠️ Disruption (Bearish/Neutral Counter-View):
1. Flat Consolidation Zone = Distribution Risk
Price has been moving sideways in a tight range (approx. 32.90–33.15), indicating indecision.
This could be a distribution phase, where smart money sells into retail bullishness.
---
2. Weak Volume Profile
Volume is relatively low and not increasing with attempted bullish moves.
A strong breakout should be backed by volume, but current price action lacks conviction.
---
3. False Breakout Trap Risk
Price is testing the upper boundary of a range.
A small push higher could be a bull trap, especially if it reverses back inside the range — a common fake-out setup.

XAG/USD H4 AnalysisWith 3 previous rejections of $32.80 over the back end of May, we saw a glimpse of a 4th at the close of play last Friday.
There is a potential for buys if you agree with this analysis and it meets your strategy rules.

Silver is in the Bearish trend after testing ResistanceHello Traders
In This Chart XAGUSD HOURLY Forex Forecast By FOREX PLANET
today XAGUSD analysis 👆
🟢This Chart includes_ (XAGUSD market update)
🟢What is The Next Opportunity on XAGUSD Market
🟢how to Enter to the Valid Entry With Assurance Profit
This CHART is For Trader's that Want to Improve Their Technical Analysis Skills and Their Trading By Understanding How To Analyze The Market Using Multiple Timeframes and Understanding The Bigger Picture on the Charts

Small Clues In A Big Breakout PatternSilver has been consolidating as of late and if there's one thing we no about contraction is that it eventually leads to expansion aka a breakout.
The issue with this particular setup is that based on location of the pattern, there's no predetermined directional bias for the breakout.
Therefor, what we're doing today is looking for small clues that the market has provided to give us any type of edge in predicting a breakout one way or another and guess what. WE FOUND SOME!
If you have any questions or comments, please leave them below!
Akil

SILVER (XAGUSD): Bullish Momentum Continues Silver (XAGUSD) has been showing strong resilience and upward momentum, reinforcing a generally bullish outlook for the near to medium term. Despite recent minor fluctuations, the underlying fundamentals and technical indicators suggest continued potential for price appreciation.
Technical Observations:
Consolidation & Breakout Potential: Silver has been consolidating, forming a base that could lead to a significant breakout.
Support Levels : Monthly Key support around the $28.00 - $29.00 zone has proven robust, suggesting strong buying interest on dips.
One-Month Chart Perspective: On a one-month chart, you would typically observe the broader trend and significant long-term support/resistance zones. Given the bullish outlook, the one-month chart would likely show a series of higher lows and potentially higher highs, indicating sustained upward momentum. Look for strong monthly closing candles above key psychological levels, which would reinforce the bullish sentiment and suggest continued strength into the next month. Any pullbacks on this timeframe would ideally find support at previous resistance levels, which then act as new support.
Key Price Targets and Predictions (as of late May/early June 2025):
Based on various analyst forecasts and market models, here are some notable price targets for silver:
Short-Term (Q2 2025): Expectation around $33.79 - $34.00 per troy ounce.
Mid-Term (Next 12 months / End of 2025):
Analysts generally forecast targets ranging from $36.00 to $40.00 per ounce.
Some more optimistic predictions reach towards $48.00 - $50.00 per ounce.
Longer-Term (2026-2030): Some projections see silver potentially reaching $75.00 - $80.00 per ounce.
Driving Factors:
Industrial Demand: The increasing adoption of green technologies (solar panels, EVs) continues to drive significant industrial demand for silver.
Safe-Haven Appeal: Ongoing global economic uncertainties and geopolitical tensions enhance silver's role as a safe-haven asset.
Supply Deficits: Persistent supply shortfalls in the silver market are expected to provide upward price pressure.
Monetary Policy: Potential interest rate cuts could make non-yielding assets like silver more attractive.
Strategy:
Maintain a bullish bias while closely monitoring key support and resistance levels. A decisive break above current resistance could confirm further upside.
Disclaimer: This is not financial advice. Trading involves risk, and past performance is not indicative of future results. Always do your own research and consult with a financial professional before making any investment decisions.

XAGUSD Weekly Technical Analysis Breakdown (MMC Style) + Target📈 Chart Summary:
The chart shows the price action of Silver (XAG/USD) on the daily timeframe, capturing a significant shift in market sentiment. This analysis is based on the MMC (Market Maker Cycle) concept and a combination of Smart Money Concepts, Pennant Structure, and Volume Contraction patterns.
Over the past weeks, XAGUSD has transitioned from accumulation and markup to distribution and markdown, suggesting that smart money has exited long positions and is now pushing price toward discount zones for future reaccumulation.
🔍 Detailed Breakdown:
🔹 1. Major Resistance Area – The Selling Origin
At the top of the chart, we see a major resistance zone near $35–$36, which acted as a structural ceiling for months. Each time price approached this area, sellers stepped in aggressively, rejecting price and creating long wicks.
This level represents institutional supply—where big players offload positions, often leaving a liquidity trail behind for later use.
🔹 2. Pennant Formation + Volume Contraction – Classic Distribution
From late April to mid-May, Silver formed a pennant structure, a well-known consolidation pattern. What's special here is the volume contraction—a subtle clue that buyers are drying up while sellers prepare for a large move.
This is a classic Wyckoff distribution behavior:
Buyers are lured in as price moves in a tight range.
Breakout traders enter early expecting a bullish continuation.
Institutions trap liquidity before dumping price into inefficiency.
The mini Break of Structure (BOS) to the upside acted as a false breakout, perfectly engineered to trap liquidity above the pennant.
🔹 3. Structural Breakdown – Momentum Shifts Bearish
Once the trap was complete, price reversed with strong momentum, breaking past key supports and violating internal structure. The label "Structural Analysis" marks the beginning of this break in market structure, confirming the change in character.
This shift aligns with Smart Money’s "Manipulation → Distribution → Expansion" logic.
We also note how price broke below the SR-interchange zone, where support became resistance—a powerful reversal confirmation.
🔹 4. Target + Next Reversal Zone – The Magnet
Currently, Silver is headed toward the $29–$28 zone, highlighted in red as the "Target + Next Reversal" area.
This level has high confluence:
Acts as a previous QFL (Quasimodo Failure Level).
Has unmitigated demand.
Matches with earlier lows where smart money likely accumulated positions.
Here, we can expect either a strong bounce or short-term consolidation before the next directional move.
📌 Confluence Zones:
Key Zone Significance
$35–$36 Major Resistance (Supply / Exit zone)
$33.5 Mini BOS & Liquidity Trap Area
$31.8 – $32.5 Structural Break Zone (Old Demand Broken)
$29 – $28 Target + Reversal (High Confluence Zone)
🧠 Smart Money Perspective:
This entire sequence is not random—it’s engineered.
Institutions:
Collected orders at the bottom.
Pushed price up to resistance.
Consolidated in a pennant to build liquidity.
Triggered a false breakout to trap late buyers.
Dumped aggressively, targeting previous lows for re-entry.
This is the Market Maker Cycle in action — and we’re in the Distribution to Markdown phase right now.
🎯 Trading Plan:
Short-Term Bias: Bearish until $29–$28 is reached.
Swing Traders: Look for signs of reversal in the $28–$29 zone (bullish engulfing, FVG fill, or demand reactivation).
Day Traders: Watch for pullbacks to the $32.5–$33 resistance zone to enter continuation shorts.
🧵 Final Thoughts:
This is a textbook example of how Smart Money manipulates structure, traps liquidity, and moves price in phases. Patterns like pennants, BOS, and SR flips, when combined with volume and context, give us clear directional bias.
If you're still chasing the breakout without understanding the setup behind it, you're trading against those who engineered the move. Understand the structure — or get trapped by it.

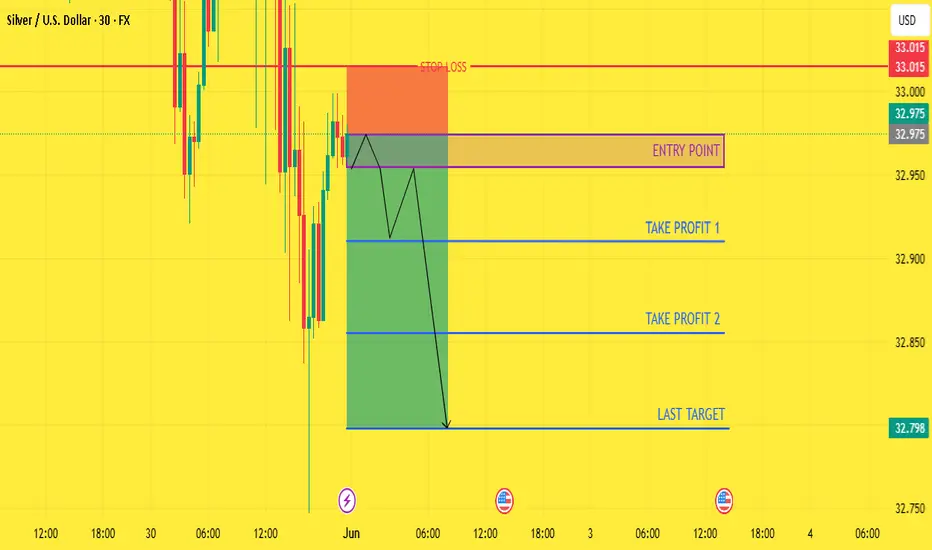
NEXT WEEK XAGUSD BUY NOW READ CAPTAIN( XAGUSD ) SELL zone
( TRADE SATUP)
entry point (32.974) to (32.954) 📊
FIRST TP (32.910)📊
2ND TARGET (32.855) 📊
LAST TARGET (32.798) 📊
STOP LOOS (33.015)❌
Review and Estimation of the 3rd 3 Elite pairsYou can follow us for more Analysis(Images and Videos) with Precise definition of the Financial Market.ENJOY!!!

SILVER: Will Start Growing! Here is Why:
Our strategy, polished by years of trial and error has helped us identify what seems to be a great trading opportunity and we are here to share it with you as the time is ripe for us to buy SILVER.
Disclosure: I am part of Trade Nation's Influencer program and receive a monthly fee for using their TradingView charts in my analysis.
❤️ Please, support our work with like & comment! ❤️

Market next move ⚠️ Disruption of the Bullish Silver Setup:
---
1. Misleading Support-Resistance Interpretation
The resistance zone highlighted is flat and overlapping with multiple wicks.
The support zone is not well-established; it's only tested once or twice with weak bounce reaction, which is not enough to consider it strong support.
---
2. Lack of Bullish Confirmation
The price is currently hovering around the support with no breakout candle or strong bullish engulfing pattern.
The recent candlesticks near resistance are small-bodied with long wicks, suggesting indecision or weakening buying power, not strength.
---
3. Volume Disagreement
There's no surge in bullish volume that would confirm buyers stepping in.
The large red volume bars toward the right indicate selling pressure dominating, which contradicts the bullish target.
SILVER: The Market Is Looking Up! Long!
My dear friends,
Today we will analyse SILVER together☺️
The market is at an inflection zone and price has now reached an area around 32.984 where previous reversals or breakouts have occurred.And a price reaction that we are seeing on multiple timeframes here could signal the next move up so we can enter on confirmation, and target the next key level of 33.109.Stop-loss is recommended beyond the inflection zone.
❤️Sending you lots of Love and Hugs❤️

Strong Fundamental and Sentiment Bias - Bulls Incoming!Bounce on the lower trend, expecting a continuation to the upside, price has been in a range zone for while- low risk setup

LONG SLVER Back to take the Swing low of 4H
Start creating SMT with GOLD in 1H
And after the close 1H as a bullish respected candle, I entered
stop loss belowthe swing low of 1H
DOL is PWH and PDH
