XAI breakout Buy breakout, #XAI
The price is moving within a descending channel on the 1-hour frame and is expected to break and continue upward.
We have a trend to stabilize above the 100 moving average once again.
We have a downtrend on the RSI indicator that supports the upward break.
We have a support area at the lowe
Related pairs

XAI/USDT Breakout XAI has completed a 60% retracement back to a key demand zone on the daily timeframe. Price action shows a clean breakout from the downtrend line, followed by a successful retest a classic confirmation of reversal structure.
with a potential upside move of +150% from current levels.
#XAI #XAIUSDT

#XAI/USDT#XAI
The price is moving within a descending channel on the 1-hour frame, adhering well to it, and is heading for a strong breakout and retest.
We have a bounce from the lower boundary of the descending channel, which is support at 0.0448.
We have a downtrend on the RSI indicator that is about to

#XAI/USDT#XAI
The price is moving within a descending channel on the 1-hour frame, adhering well to it, and is heading toward a strong breakout and retest.
We are experiencing a rebound from the lower boundary of the descending channel. This support is at 0.0570.
We are experiencing a downtrend on the RSI

#XAI/USDT#XAI
The price is moving within a descending channel on the 1-hour frame and is expected to break and continue upward.
We have a trend to stabilize above the 100 moving average once again.
We have a downtrend on the RSI indicator, which supports the upward move by breaking it upward.
We have a s

XAIUSDT / LONG / 12.06.25⬆️ Buy XAIUSDT, 12.06.25
💰 Entry: 0.06687
🎯 Target: 0.14819
⛔️ Stop: 0.05947
Reasons for entry:
— 1D
Price in consolidation for more than 1 day
Correction into the discount zone
— 1H
Divergence in long, exit from correction
Decrease in volumes during correction
Predominance of volumes for purch

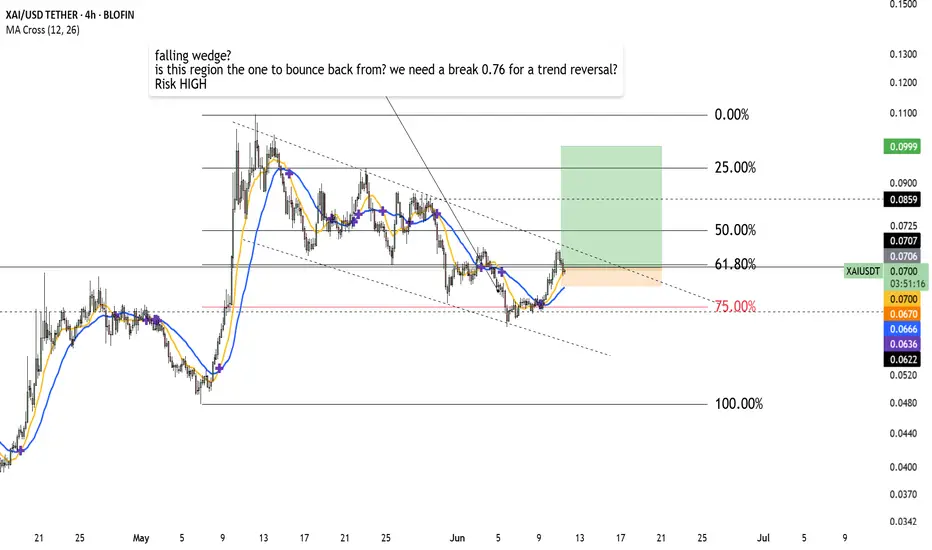
XIA/USDTBetting this chart.
Very high risk trade as XIA has been known for being volatile especially in day like today.
I am interested to see how this is going to react to the CPI data.
Is it going to pump with the whole market?
There is a posible faling wedge pattern here.
XAI 4H
There is an inverse head-and-shoulders formation in XAI. If closings come above $0.074, the price is expected to touch $0.087 as the target.

#XAIUSDT Analysis — Reversal Confirmed, Eyes on 100%+ Potential
🚀 #XAIUSDT Analysis — Reversal Confirmed, Eyes on 100%+ Potential
🗓 Published: May 9, 2025
🕰 Timeframe: 1D | 📊 Exchange: Binance
🔍 Technical Overview
XAI just broke out of a bullish pennant formation following an aggressive bounce off key support.
Momentum is strong — with a breakout candle reclai

#XAI/USDT#XAI
The price is moving within a descending channel on the 1-hour frame and is expected to break and continue upward.
We have a trend to stabilize above the 100 moving average once again.
We have a downtrend on the RSI indicator, which supports the upward move by breaking it upward.
We have a s

See all ideas
Summarizing what the indicators are suggesting.
Oscillators
Neutral
SellBuy
Strong sellStrong buy
Strong sellSellNeutralBuyStrong buy
Oscillators
Neutral
SellBuy
Strong sellStrong buy
Strong sellSellNeutralBuyStrong buy
Summary
Neutral
SellBuy
Strong sellStrong buy
Strong sellSellNeutralBuyStrong buy
Summary
Neutral
SellBuy
Strong sellStrong buy
Strong sellSellNeutralBuyStrong buy
Summary
Neutral
SellBuy
Strong sellStrong buy
Strong sellSellNeutralBuyStrong buy
Moving Averages
Neutral
SellBuy
Strong sellStrong buy
Strong sellSellNeutralBuyStrong buy
Moving Averages
Neutral
SellBuy
Strong sellStrong buy
Strong sellSellNeutralBuyStrong buy
Displays a symbol's price movements over previous years to identify recurring trends.
Frequently Asked Questions
The current price of Xai / Tether US (XAI) is 0.0485 USDT — it has fallen −1.60% in the past 24 hours. Try placing this info into the context by checking out what coins are also gaining and losing at the moment and seeing XAI price chart.
Xai / Tether US price has fallen by −8.19% over the last week, its month performance shows a −20.36% decrease, and as for the last year, Xai / Tether US has decreased by −86.24%. See more dynamics on XAI price chart.
Keep track of coins' changes with our Crypto Coins Heatmap.
Keep track of coins' changes with our Crypto Coins Heatmap.
Xai / Tether US (XAI) reached its highest price on Mar 11, 2024 — it amounted to 1.6094 USDT. Find more insights on the XAI price chart.
See the list of crypto gainers and choose what best fits your strategy.
See the list of crypto gainers and choose what best fits your strategy.
Xai / Tether US (XAI) reached the lowest price of 0.0385 USDT on Apr 7, 2025. View more Xai / Tether US dynamics on the price chart.
See the list of crypto losers to find unexpected opportunities.
See the list of crypto losers to find unexpected opportunities.
The safest choice when buying XAI is to go to a well-known crypto exchange. Some of the popular names are Binance, Coinbase, Kraken. But you'll have to find a reliable broker and create an account first. You can trade XAI right from TradingView charts — just choose a broker and connect to your account.
Crypto markets are famous for their volatility, so one should study all the available stats before adding crypto assets to their portfolio. Very often it's technical analysis that comes in handy. We prepared technical ratings for Xai / Tether US (XAI): today its technical analysis shows the sell signal, and according to the 1 week rating XAI shows the sell signal. And you'd better dig deeper and study 1 month rating too — it's sell. Find inspiration in Xai / Tether US trading ideas and keep track of what's moving crypto markets with our crypto news feed.
Xai / Tether US (XAI) is just as reliable as any other crypto asset — this corner of the world market is highly volatile. Today, for instance, Xai / Tether US is estimated as 6.46% volatile. The only thing it means is that you must prepare and examine all available information before making a decision. And if you're not sure about Xai / Tether US, you can find more inspiration in our curated watchlists.
You can discuss Xai / Tether US (XAI) with other users in our public chats, Minds or in the comments to Ideas.