Failed to break up price reacting to resistance If price doesn't survive resistance, will most likely see a further decline :(
XAIUSDT trade ideas

XAI close to breaking trendlineTrend line on 4h close to breaking price might test key level and potential up bullish sentiment def

#XAI (SPOT) IN ( 0.1700- 0.2100) T.(0.8300) SL(0.1666)BINANCE:XAIUSDT
#XAI / USDT
Entry ( 0.1700- 0.2100)
SL 1D close below 0.1666
T1 0.3800
T2 0.5300
T3 0.8300
______________________________________________________________
Golden Advices.
********************
* collect the coin slowly in the entry range.
* Please calculate your losses before the entry.
* Do not enter any trade you find it not suitable for you.
* No FOMO - No Rush , it is a long journey.
Useful Tags.
****************
My total posts
www.tradingview.com
**********************************************************************************************
#Manta #OMNI #DYM #AI #IO #XAI #ACE #NFP #RAD #WLD #ORDI #BLUR #SUI #VOXEL #AEVO #VITE #APE #RDNT #FLUX #NMR #VANRY #TRB #HBAR #DGB #XEC #ERN #ALT #IO #ACA #HIVE #ASTR #ARDR #PIXEL #LTO #AERGO #SCRT #ATA #HOOK #FLOW #KSM #HFT #MINA #DATA #SC #JOE #RDNT #IQ #CFX #BICO #CTSI #KMD #FXS #DEGO #FORTH #AST #PORTAL #CYBER #RIF #ENJ #ZIL #APT #GALA #STEEM #ONE #LINK #NTRN #COTI #RENDER #ICX #IMX #ALICE #PYR #PORTAL #GRT #GMT #IDEX #NEAR #ICP #ETH #QTUM #VET #QNT #API3 #BURGER #MOVR #SKL #BAND #ETHFI #SAND #IOTX #T #GTC #PDA #GMX #REZ #DUSK #BNX #SPELL #POWR #JOE #TIA #TFUEL #HOT #AVAX #WAXP #OGN #AXS #GALA #ONE #SYS #SCRT #DGB #LIT #QI #FIL #GLMR #ATOM #LTC #MANA #ONT #TLM #SLP

#XAI (SPOT) entry range (0.17- 0.19) T.(0.8390) SL (0.1655)entry range ( 0.17- 0.19)
Target1 (0.5360) - Target2 (0.8390)
SL .4H close below (0.1655)
*** Breakout is done in 1H Frame & this entry will be in the retest *****
************************************
#XAI
#XAIUSDT
#XAIUSD
BINANCE:XAIUSDT
#swingtrade
#shortterminvestment
#ALTCOIN
#Cryptotading
#cryptoinvesting
#investment
##trading
#cryptocurrencytrading
#bitcoininvestments
#Investing_Coins
#Investingcoins
#Crypto_investing
#Cryptoinvesting
**** #Manta ,#OMNI, #DYM, #AI, #IO, #XAI , #ACE #NFP #RAD #WLD #ORDI #BLUR #SUI #Voxel #AEVO #VITE #APE #RDNT #FLUX #NMR #VANRY ****
#bitcoin
#BTC
#BTCUSDT

XAI is ready - Are You?I earned a lot from XAI.
I have made almost $50K (although I know its more than that) from XAI/USDT (Perpetual Contracts).
Now listen to ME very carefully:
First point to roam nearby for XAI is 0.600 then 0.7300 then 0.8200 being the ideal target for ME.
I don’t do Spot because I do “Chief Swings” My Own Invention via my own Analysis (“Chief Analysis” which I’m founder of) via my own strategies and my own asset.
So be careful while trading futures because I AM THE FUTURE & I tell you you aint in it if you’re not smart 😉
“The Crypto Chief” Signing out
BINANCE:XAIUSDT

XAI. Next Stop $0.7048. 01/02/25Not much to explain. A classic continuation structure. In case of a broader sell-off, pending orders will be easily triggered.
EP: $0.2174 - $0.1656
TP (futures): $0.4304
TP (spot): $0.7048
SL: No stops on spot, futures SL: $0.1535 (enter with proper risk).
DYOR.

#XAI/USDT#XAI
The price is moving in a descending channel on the 1-hour frame and is expected to continue upwards
We have a trend to stabilize above the moving average 100 again
We have a descending trend on the RSI indicator that supports the rise by breaking it upwards
We have a support area at the lower limit of the channel at 0.2170
Entry price 0.2240
First target 0.2330
Second target 0.2463
Third target 0.2584

XAI at support zoneXAI is developed for game , small cap coin and with that anything would go exploded if it gained interest from a big audiences . The potential is huge , surged from support last month together with all big guns and now back to the base again. Until 20th Jan next year , it is in accumulated phase and ready to retest the old high .

#XAI/USDT Ready to go higher#XAI
The price is moving in a descending channel on the 1-hour frame and sticking to it well
We have a bounce from the lower limit of the descending channel, this support is at 0.2540
We have a downtrend on the RSI indicator that is about to be broken, which supports the rise
We have a trend to stabilize above the moving average 100
Entry price 0.2660
First target 0.2771
Second target 0.2935
Third target 0.3150

XAIUSDT 2DXAI Update ~ 2D
#XAI Again rejected from this resistance line. the best way for now, buy gradually after breaking through this resistance line. with a minimum target of 20%+

A great opportunity to accumulate XAI for 2025 bullrunBINANCE:XAIUSDT has a 400% potential if you buy and HODL now. It is not a far fetched price either. We are targeting the all time highs. Of course if you use the fib expansion tool you can aim for even higher targets but this price target is even okay with me and I will get out then.

XAI 1H Update I think the cryptocurrency XAI needs some Corrections
We have two scenarios for the correction
First : It could start correcting right from this range after some sideways movement.
Second : It might make one more upward move, and then after the sell orders are activated, we could see a deeper correction.

Xai/UsdtBINANCE:XAIUSDT
### **Current Price: 0.3773 📊**
The current price of **XAi** is **0.3773**. If the price holds steady here, it could potentially rise towards the next resistance levels.
---
### **Resistance Levels 🚧**:
These are the price points where XAi may face difficulty rising above. If the price breaks through them, it could continue climbing.
- **0.4100** 🚀: The first resistance level. If broken, the price could continue upwards.
- **0.4345** ⚡: A stronger resistance point. Breaking this might signal more bullish momentum.
- **0.4934** 🌟: A key resistance level that could indicate a major price surge if breached.
---
### **Support Levels ⬇️**:
If the price does not hold and starts to decline, it may find support at these levels, where buying interest could stop the price from falling further.
- **0.3600** 🛑: The first support level. If the price drops to this point, it might stabilize or bounce back up.
- **0.2800** 💡: A more significant support level. A drop here could indicate further weakness.
- **0.2500** 🏚️: A crucial support level. If this breaks, further declines could be expected.
---
### **Explanation**:
- If **XAi** holds at its current price of **0.3773** 📊, it could target the **resistance levels** (0.4100, 0.4345, 0.4934) 🚀⚡🌟.
- However, if the price fails to hold at the current level and starts to drop, it could fall back to the **support levels** (0.3600, 0.2800, 0.2500) 🛑💡🏚️.
- If the price breaks through any of the support levels, it may continue to decline, signaling a potential bearish trend 📉.
---
### **Not Financial Advice 🚫💸**
This is just an analysis based on current price levels. Always do your own research and stay cautious when trading!

XAIUSDT Is a Breakout on the Horizon or a Pullback Imminent?Yello, Paradisers! Could #XAIUSDT be gearing up for a significant breakout, or is it poised for a pullback? Here's what we're seeing:
💎#XAI is displaying bullish potential after rebounding from the demand zone and forming a strong rejection candle. If the daily candle closes similarly, there is a real chance for the price to push toward the $0.228 supply zone. A successful breakout could lead to further upward movement, potentially crossing the resistance trendline and reaching the major resistance area we’re monitoring.
💎If XAI fails to hold above the demand zone and breaks down, a retest of the $0.18 - $0.166 area is likely. This zone has proven resilient in the past, often triggering rebounds and significant upward trends.
💎A daily close below the $0.166 major support would invalidate the bullish outlook, suggesting a potential deeper dip.
Stay disciplined and strategic, traders. Success in this market comes to those who trade with patience and precision.
MyCryptoParadise
iFeel the success🌴

xai breaks multiple resistancesseems like xai is finally ready for solid recovery horizontal range breakout retest has already got confirmed also descending broadening breakout has confirmed too expecting 120 to 150% bullish wave incoming weeks

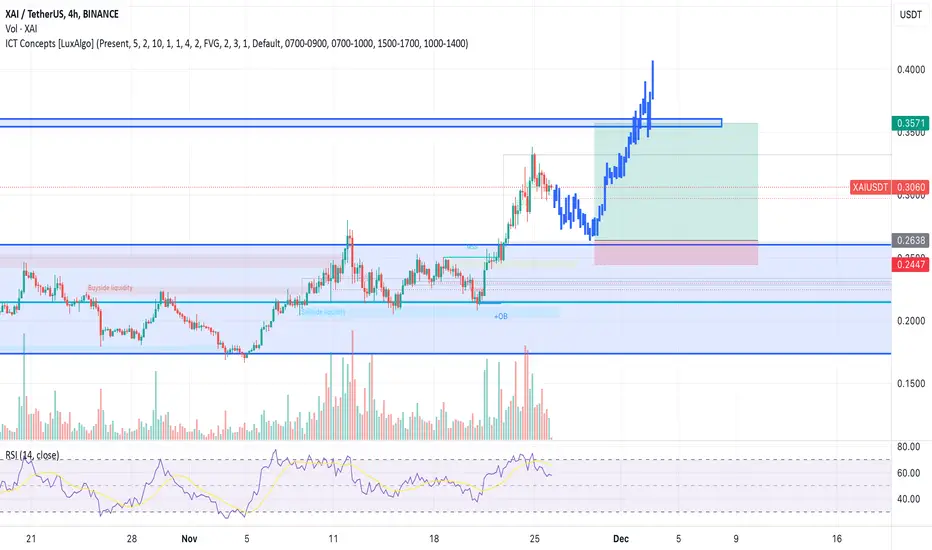
XAI Buy at Support – Bullish Daily + Golden Ratio Alignment
Analysis
This trade idea is based on the bullish daily trend and a flip of support to resistance. The entry zone aligns with the Golden Ratio (0.618 Fibonacci Retracement), offering a strong confluence for a potential bounce.
- Asset Pair: XAI/USDT
- Timeframe: 4HR
- Key Levels:
- Entry: 0.2638
- Stop Loss: 0.2447
- Target: 0.3574
- Risk-to-Reward Ratio: 4.88
- Additional Note: Trailing stop loss can be applied to secure profits as the trade progresses.
Risk Management
The stop loss is tightly set at 0.2447, ensuring a defined risk for a high 4.88 R:R ratio.
---
Disclaimer
This idea is for educational purposes only and is not financial advice. Trading involves significant risks. Always perform your own analysis and consult with a licensed professional before executing trades.
#XAI: Driving AI and Blockchain InnovationDescription:
This trading idea centers on XAI, a cryptocurrency designed to bridge the gap between artificial intelligence (AI) and blockchain technology. XAI powers a decentralized ecosystem aimed at enhancing the scalability, security, and efficiency of AI applications. By leveraging blockchain’s transparency and decentralization, XAI enables innovative solutions across industries such as healthcare, finance, and logistics. The growing demand for AI-driven platforms positions XAI as a promising asset for investors seeking exposure to cutting-edge technologies with real-world applications.
As with all cryptocurrencies, XAI is subject to the high volatility of the crypto market, influenced by factors like regulatory changes, technological developments, and macroeconomic conditions. While the potential is significant, investing in XAI requires careful evaluation of the risks and opportunities.
Disclaimer:
This trading idea is intended for educational purposes only and does not constitute financial advice. Investing in cryptocurrencies, including XAI, involves significant risks, including the potential for total capital loss. Always conduct thorough research, assess your financial situation, and consult with a financial advisor before making any investment decisions. Past performance is not indicative of future results.

XAIUSDT Eyes Bullish BreakoutXAIUSDT Technical analsysi update
XAIUSDT has been trading within a parallel channel for the past 110 days. The price is now moving toward the channel's resistance, signaling a potential breakout. Additionally, the price is trading above the 100 EMA on the daily chart, further supporting a bullish outlook.

TradeCityPro | XAIUSDT - Buying Opportunity for a New Coin👋 Welcome to the TradeCityPro channel! Let's dive into XAI and analyze its technical structure, entry points, and potential scenarios.
🌍 Bitcoin’s Impact on Altcoins
Bitcoin has set another new high since yesterday, attracting global attention.
Its dominance in the global financial system now surpasses major banks like JPMorgan Chase, Bank of America, and ICBC China.
However, Bitcoin's dominance has started to decline on lower timeframes, creating opportunities for altcoins to rise, as mentioned in our previous analysis.
🕒 Weekly Timeframe Analysis
XAI has retraced nearly 90% from its ATH, typical for newly listed coins. These large corrections often result in the formation of accumulation boxes, where the price consolidates for an extended period.
With the current weekly candle nearing a breakout from the accumulation zone, there’s potential for an uptrend to begin. If this breakout fails, a stop-loss near 0.1680 can minimize losses.
Buy if the weekly candle closes above the current range , Set a stop-loss at 0.1680 for better risk management , Utilize XAI in DeFi platforms after a breakout for additional yield opportunities.
📆 Daily Timeframe Analysis
XAI remains range-bound between 0.1699 and 0.2583, showing clear signs of accumulation.
Higher lows indicate buying strength and the absence of strong sellers.
Each test of resistance (0.2583) is accompanied by increased volume, signaling interest from buyers.
After breaking 0.2583, consider a spot buy with a stop-loss at 0.2142 for a riskier but calculated entry.
⏱ 4-Hour Timeframe Analysis
sharp upward move has brought the price close to 0.2497, where immediate resistance lies.
📈 Long Position:
Buy after a confirmed breakout above 0.2497.
Watch for RSI to enter the overbought zone, as this often precedes sharp upward moves.
📉 Short Position:
Avoid shorting. Instead, wait for corrections and look for long opportunities at lower entry points near 0.2102.
🔄 XAI/Bitcoin Pair Analysis
The XAI/BTC pair shows a downtrend but with significant weakening momentum in recent times.
On lower timeframes, the pair may begin a new uptrend, which could result in faster and sharper moves in the XAI/USDT chart.
Break and confirm above 0.00000299 on the XAI/BTC chart to signal a stronger bullish move.
📝 Final Thoughts
XAI is showing promising signs of an impending breakout on multiple timeframes. Monitor key levels closely and manage risk with appropriate stop-loss settings.
This analysis reflects our opinions and is not financial advice.
Share your thoughts in the comments, and don’t forget to share this analysis with your friends! ❤️

Xai / Usdt BINANCE:XAIUSDT
** NASDAQ:XAI 110 Days Range Breakout Expected!** 🚀
This is **typically a good asset to hold on SPOT** during the coming days! 📈
**Pump Potential**: **+35% - 50%** 📈
**Main Resistances**:
- **$0.2600**
- **$0.3050**
- **$0.3600**
- **$0.3950**
The **weekly view** looks strong, indicating positive movement ahead! 🌟
**See you in a few days!** 🚀
**Tell others** 📣
*This is not financial advice.* 🙅♂️📊

Last call for #XAI NASDAQ:XAI 1D;
For 4 months, it has been accumulating very smoothly and has now reached the end of the trend breakout.
Although it gave its first signal with the arrival of the MSS breakout, it will now start an uptrend with the closing above the -OB level.
In short, all the necessary infrastructure has been formed and it is only waiting for the trend to shift in this direction.
With a hard momentum candle, the first reaction level will be $0.39.
For the target, the Ath level can be considered in the first place. So exactly 6x the current level
#xai #ai

#XAI/USDT#XAI
The price is moving in a descending channel on the 4-hour frame and is sticking to it well
We have a bounce from the lower limit of the descending channel and we are now touching this support at 0.1860
We have an upward trend on the RSI indicator that is about to be broken, which supports the rise
We have a trend to stabilize above the moving average 100
Entry price 0.2110
First target 0.2302
Second target 0.2478
Third target 0.2668

XAIUSDT Breaks Out of Accumulation ZoneXAIUSDT Technical analysis update
XAIUSDT has been trading inside a rectangle pattern at the bottom for the last 100 days, which is considered an accumulation stage. The price is now breaking the rectangle resistance and has crossed the 100 EMA on the daily chart. We can expect a strong bullish move in the coming days.
Regards
Hexa
