GOLD EUR SELL (GOLD - EURO)Hi there. Price is moving impulsively to the downside. Wait for the price to complete the continuation pattern that its forming and watch strong price action for sell.
XAUEUR trade ideas

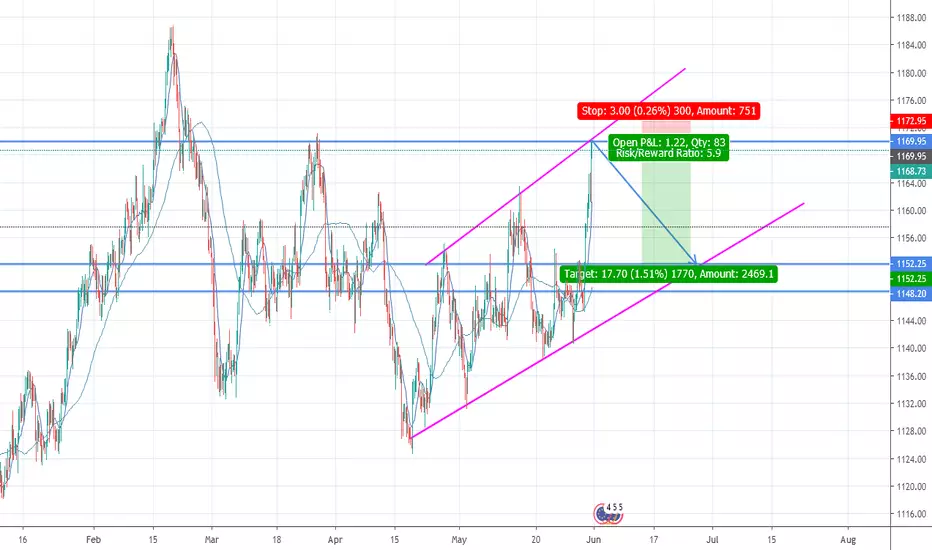
XAUEUR 1D- broke the trend line
- enter on confirmation retest.
- overall is sell.
Regards, GoldfXcc Team

GOLD/EUR #XAUEUR - short term analysisGold/EUR has built a symmetrical triangle on the H4 TF, but this could also be a bullish pennant.
At the moment there is bearish momentum according to the StochRSI on H4 TF which could easily break the yellow trend line of the triangle.
Next support is at €1251 and I would set SL slightly below (2-3%).
If Gold can maintain this price level more bullish momentum will build up on 1D TF and then Gold could break out bullish.
TP1@ €1279.- (slightly below Fib 1.272 extension); TP2@€1295.- (@ Fib 1.618 below violet resistance line).
Bearish short-term scenario is that the sym triangle breaks bearish to the downside to the support level at around @1221.-
Consolidation will follow but bears will win on higher TFs (check 1W candle stick chart)!
Lets see how this will play out...
WARNING:
I´m not a financial advisor. For educational purpose only!

XAU/EUR - Sentiment analysisGold has broken the €1245 resistance and has tested Fib 0.786 resistance at €1273.-
Sentiment is bullish but has still not reached resistance levels. Also ADX shows that there is still strong bullish power which could lead to short-term raise in Gold price to the 0.888 Fib level (€1322 - 1327).
The Dow is currently trying to break through it´s overhead trend-line resistance €27420-27460.
If the Dow does not have sufficient strength to brake trough this resistance line then this could lead to an extended rally in Gold.
However, latest COT report indicates that commercial traders are already net short and that small / retail traders are net long which is a bearish signal.
Next few days will tell us in which direction the DJI is going and what that means for the Gold price.
Short-term I´m bullish/neutral, intermediate term bearish and long-term bullish on Gold.


XAU/EUR - long-term analysisGold is in a strong uptrend since the bullish Gartley, WaveTrend oscillator, MFI, RSI and stochastics oscillator indicated a perfect long-entry at around €1000.- on Oct 2018.
Price actions shows that Gold is currently in an impulse wave 5 which will end soon and turn into a ABC correction which should find support in the between €1111 and 1070.- in 2020 (Fib 0-618 - 0.786).
Price should find long-term support on bullish order blocks which were formed over the past few years between €1100 - 1070 which is a perfect accumulation zone for long-term Gold investors.
A short-term long opportunity for swing and day traders could be between 30 MA and Fib 0.5 between €1180 - 1143.
Volume profile also indicates HVN @ €1170 - 1155.
Short and intermediate term I´m bearish on Gold, however long-term I´m bullish due to the golden cross 50/100 MA!


XAUEUR, Buy on H4**Disclaimer** the content on this analysis is subject to change at any time without notice, and is provided for the sole purpose of assisting traders to make independent investment decisions, -

XAUEUR LONGStay Long on this incredible BUTTERFLY BEAR pattern. The reversal of this harmonic pattern will be awful, sadly.
Have a good trading day!
Trading Mickette from Germany ;-)


Gold/Euro buy ABCD opportunityThis chart show ABCD on XAUEUR buy opportunity for testing the area again, we have three targets, close 33.3% of the trade at each target, trade with care, cheers.


Possible XAUEUR outcomesThese are to possible outcomes for XAUEUR to come. based on trendline support or the rejection of those :)


Gold/EUR forming head-and-shoulders on hourly chartAny out there who wants to short gold, consider XAU/EUR. It seems to be creating a head and shoulders pattern on the hourly chart.
EUR/USD's daily chart is flashing bullish conditions. Meanwhile, markets have already priced in three Fed rate cuts for 2019. So upside in Gold ($) looks limited. Hence, GOLD/EUR looks overdue for a price pullback.
A break below the neckline support of 1181 would open the doors to 1170-1165.


Inverted H&S in XAUEUR Testing 1170Inverted H&S in XAUEUR Testing 1170.
Also Bullish MACD Divergence.

AXUEUR SHORT POSITION IDENTIFIED ON CHANNEL UPSell analysis above.
For any help check my status.
Please comment or like for your support

