XAUEUR trade ideas

XAUEUR - Double Button He test the values Twice and and made double Bottom, when the first higher high break take a trade and make a profit.
Bye

XAUEUR - Made Bearish FlagThere is no divergence, and there is in 4 hours chart made a Bearish flag.
Trade Plan is:
when last Lower High Break then take a trade, and Enjoy your profile,

LiveI updated my idea on the notes but posting it again so new followers can jump on the trade. This is the last one until the new year

Put this in your stocking One last surprise, if/when price breaks out of the wedge it's time to get in and ride it through to the new year.

[EN] XAUEUR vs XAUUSD // GaliortiTradingOANDA:XAUEUR has greatly improved its appearance relative to the chart of $OANDA:XAUUSD. See the weekly charts of both:
1 W €
1 W $
We will now comment on the charts OANDA:XAUEUR :
OANDA:XAUEUR has reached a market top in the very short term but we think that before the end of the year it will reach new all-time highs with free upside , a fact that will probably take time for the XAUUSD to achieve. For this we base our analysis on:
- large volume in euros since mid-August ( volume has tripled ), a fact that has not occurred in dollars.
- the best technical aspect.
In the first half of March 2022 OANDA:XAUEUR made record highs but the price was rejected with strong volume (the highest in the entire historical series).
For such reason, we expect a correction in the coming days as this is the third time it faces that resistance arriving with strong overbought. It does not facilitate the rise:
1. weekly bearish divergence in the RSI.
2. Technical figure of an evening star on the daily chart.
3. Extreme slope of the short term bullish guideline.
1 D
We believe that in the coming weeks there will be a correction with a target of 50% of Fibonacci of the entire rise since the beginning of the month (around 1.803-1.813€), a level that will be reinforced by the 200-session average .
4h
On 30-minute charts, the price is supported by the 100-session average . Its loss will accelerate the falls towards the floor of the bullish channel with origin at the beginning of the month. Its first downside targe t is 1,850 ( 23.6% Fibonacci correction area). Its loss would generate a second downward targe t at 1,810-1,820 ( 50% Fibonacci correction area).
30
From there, the stock will probably restructure upwards to try to beat its historical highs before the end of the year .
Pablo G.

XAUEUR: Massive signal in Gold vs EuroIf you're in the EU, you might wanna secure some exposure to Gold with Euros...💰
There is now a strong trend in all timeframes here, and downside risk is very small, I think you could easily hold something like 20-25% in Gold as a hedge and be safe.💹
Upside potential to 2344 Euros per Ounce is massive vs the downside risk under 1739 per ounce.
As for instrument selection, you could use an ETF that holds futures or physical bullion for convenience, or own some physical gold yourself (but not as liquid and harder to get in and out from in size)📊
Best of luck if you take the trade!🤝
Cheers,
Ivan Labrie.

China's Long-Term Gold BuyingChina's persistent and substantial gold buying activities have been steadily driving up the price of this precious metal, presenting an exciting opportunity for traders like yourself to consider going long on gold.
Over the past few years, China has been actively diversifying its foreign reserves by increasing its gold holdings. This strategic move is aimed at reducing their reliance on the US dollar and mitigating potential risks associated with global economic uncertainties. China's consistent and significant purchases have already made it the world's largest gold consumer, surpassing India.
The long-term implications of China's gold buying spree cannot be overlooked. As the demand for gold continues to rise, driven by China's insatiable appetite, the price of this precious metal is likely to experience sustained upward pressure. This trend could create a favorable environment for traders who choose to go long on gold.
Considering the predictable nature of China's gold buying activities and their commitment to diversify their reserves, now might be an opportune time to consider adding gold to your portfolio. By taking advantage of this trend, you could potentially benefit from the price appreciation of gold in the long term.
I encourage you to carefully evaluate this opportunity and assess how it aligns with your trading strategy. Conduct thorough research, analyze market trends, and consider consulting with your financial advisor to make an informed decision.
To assist you in capitalizing on this potential opportunity, I recommend keeping a close eye on China's gold buying announcements and monitoring any related market developments. Stay informed about global economic indicators and geopolitical events, as they can significantly influence the price of gold.
Remember, trading always involves risks, and it is essential to exercise caution and implement appropriate risk management strategies. However, with careful analysis and a well-informed approach, going long on gold in light of China's long-term buying activities could prove to be a rewarding investment.
Should you require any further information or assistance, please do not hesitate to comment.

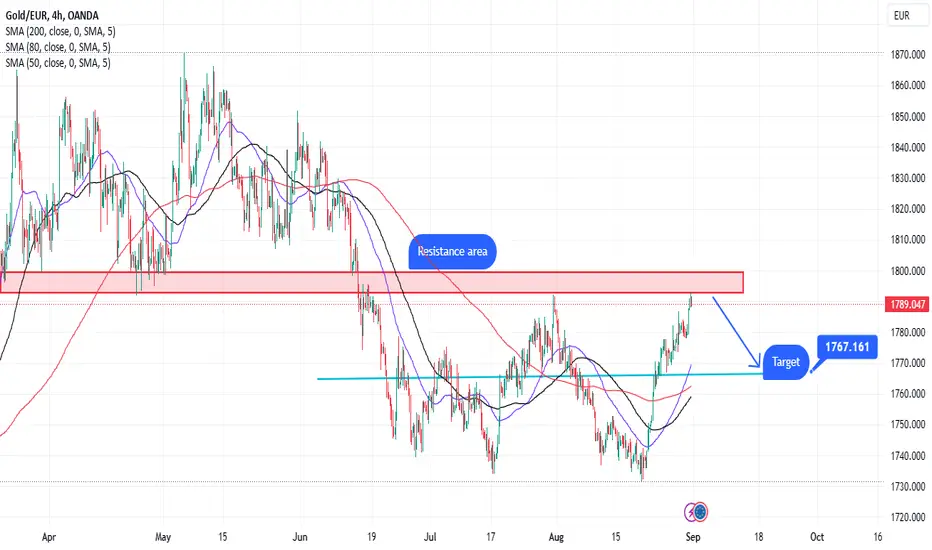
XAUEURXAUEUR ,has approached a resistance area at 1798.i believe price will sell of towards 1767. The EUR was abit weak today but as we approach NFP tomorrow ,am hoping to see sells.
XAUEUR (LONG IDEA)Morning Folks.
I have a long trade idea here on XAUEUR. 4H bearish structure has shifted to bullish. I'm expecting price to retrace back to the demand zone (also support) at 1749.42 which is the August 2020 high. I'll be looking for confirmation before going long. A shift in momentum will be enough to justify an entry with stops around 1745.37.
I'll be watching yields as we approach the zone.
Let's see how it plays out?


#Long XAU/EURLong on following rational;
1. Dow theory
2. Bullish Harami Candle
3. Respect of bullish trendline

XAU/EURWe expect a good rise of gold in the daily time. Gold has already done a good upward movement in dealing with moving 200.

XAU/EURFriends, in daily time, gold is rising. Due to the good support of moving 200, we expect a good rise in gold.
Good luck.

XAU/EUR DAILYConsidering the support of moving 200 that we have in the daily time and the upward divergence that we expect at the floor, we expect gold to rise. Of course, the gold chart is analyzed based on the euro.

2. XAUEUR - Bearish TrendXAU EUR is working according to Dow's theory. it is making LH and LL simultaneously and showing a bearish trend on the chart. We will split our Risk in 2 orders. 1st order will have a 1% Risk along with a 1% reward and 2nd order will have a 1% Risk along with 2% Profit.
Sell XAU EUR when the price is below this point 1753. 576
Stop Loss: 1759.961
Take Profit 1: 1747.191
Take Profit 2: 1740.806

Potential Breakout: Higher Highs and Rising Wedge FormationXAUEUR, the gold-to-euro currency pair, has recently shown signs of a potential bullish breakout. After testing a significant support level at 1740, the pair has started to form a pattern of higher highs and higher lows, indicating a shift in momentum.
Currently, XAUEUR is consolidating within the confines of a rising wedge formation. This technical pattern is characterized by converging trend lines, with the upper trend line sloping at a steeper angle than the lower trend line. Such patterns are often regarded as bullish continuation patterns, suggesting that an upside breakout may be on the horizon.
I will closely watch for a potential breakout above the upper trend line of the rising wedge. If the price manages to breach the upper trend line decisively, it could signify a shift in sentiment and the resumption of an upward trend.

POTENTIAL LONG TRADE SET UP FOR XAUEURPair: XAUEUR
Analysis: Chart Patterns + Highs & Lows + Impulses & Corrections
Directional Bias: Long
Entry: Continuation Corrective Structure after the breakout.
⚠️ Do your research and apply proper risk management as nothing is guaranteed in forex trading. As we have often said, this is a high risk venture and past performance is not indicative of future results. Trade Responsibly!
#TheTradingAmbience 🙏🏽🙇🏽♀️

New high coming? This is a very interesting view .. uptrend is really building up and if having those bands on its riding the bulls to push it up higher.
New high? This is a maybe we should be able to see a new high, the recent is 1903.. will it surpass it? It might.
1830’s area is a good buy opportunity before the huge sell off. If new high is coming then I say about 2000, some others said 2050 or 2100.. we will see how it plays out if it chose to sell off it’ll sell off. But this seems like a buy in a longterm.
Watch any reversals trade safe and if new Hugh is coming then we might see new high for Gold.

Important level breakoutThere has been a very long time since the price touched this price level should we look for positions freely? I mean, there is almost nothing about this level how ever it has been a very very strong resistance in the past. It might be wise to wait if it ghoes back to test the zone and then we go long.

XAU EURHi Folks
Find enclosed the updated of the chart of the gold in EUR.
Last days Gold was consolidating. We were expecting the support to hold tight, and this is happening.
A wedge pop happened yesterday and the prices are moving upward => Let continue to follow the trend.

✨ NEW XAUEUR ✨ DT (1M)-SL @ 1902.50
SLO @ 1850
SSO @ 1715
TP1 @ 1550 (shaving 25%)
TP2 @ 1400 (shaving 25%)
TP3 @ 1300 (shaving 25%)
TP4 @ 1066 (closing all)

eurjpy and gold position an overview of why i took a long trade on the eurjpy and xaueur, in this video you will understand the workings of why i took these
positions
