I'm selling GOLDThis is classic price action, sometimes it is that simple.
No need to complicate it, dont think about tariffs, no one knows what it means for the market, they all interprete after the facts
XAUUSD.F trade ideas

gold on the move till end of aprilwell we will see if this plays out like this
it looks like this could build up like I drew it
maybe some of you can catch these waves
by end of april gold price would be around new ath s 3300

GOLD GOLD watch 3212 zone and the lower break of structure .the buy back is strong and selling is a mistake until price drop below 3000

Gold short from 3255Crazy how this thing is going .
Will short the top of that channel .
Lets wait first.

GOLD WEEKLY CHART MID/LONG TERM ROUTE MAP UDPATEDWeekly GOLD Analysis – Quantum Trading Mastery
Hello Everyone,
Here’s the latest update on the GOLD weekly chart we’ve been diligently tracking and trading. Below is a comprehensive breakdown of the current range and key levels we’ve identified.
Recap of Last Week’s Analysis:
Last week, our predictions aligned perfectly with market movements:
* A strong resistance level at 2790 caused a short-term reversal near 2735.
* The FVG acted as dynamic support at 2735, sustaining the bullish momentum.
* The EMA5 crossed and locked above the key level at 2735, solidifying upward movement.
* As predicted, the resistance was broken, leading to a new all-time high of 2817.
Our analysis delivered precise predictions, allowing you to trade confidently and minimize risks.
What’s Next for GOLD This Week?
Key Level: 2735
Bullish Targets:
* TP1: 2877
* TP2: 3018
* TP3: 3160
Bearish Targets:
* 2735
* 2680
* 2595
This week, we have identified two critical GOLDTURN levels at 2735 and 2595. While we anticipate GOLD reaching TP1 at 2877, there may be short-term reversals around these key levels and GOLDTURN zones.
Recommendations:
To better understand the support structure and identify optimal dip-buying opportunities, review our smaller time-frame analyses (daily, 12H, 4H, and 1H). These insights will help you navigate the market with precision, keeping long-term gaps in perspective.
We’ll continue to provide daily updates and insights to keep you informed.
Thank you for your continued support! Don’t forget to like, comment, and share this post to help others benefit as well.
The Quantum Trading Mastery

Gold (XAU/USD) Bounces Sharply After Retesting TrendlineGold surged +1.43% to close at $3,126.77, delivering a strong bullish engulfing candle after bouncing off both the trendline and 50-day SMA support zone near $2,960.
🔹 MACD is curling back higher, hinting at a bullish momentum reset
🔹 RSI sits at 63.40, supportive of continued upside without being overbought
🔹 Key higher low structure remains intact above the trendline
The rejection of lower prices and follow-through strength reinforce the bull trend. Unless the price breaks below $2,960, buyers remain firmly in control.
Momentum was tested—and it passed. The bull trend remains intact.
-MW

XAUUSD H4 | Bearish Drop Based on the H4 chart analysis, we can see that the price is testing our sell zone at 3113.30, which is a pullback resistance that aligns close to the 78.6% Fibonacci retracement.
Our take profit will be at 3056.01, a pullback support level.
The stop loss will be placed at 3169.78, which is a swing high resistance.
High Risk Investment Warning
Trading Forex/CFDs on margin carries a high level of risk and may not be suitable for all investors. Leverage can work against you.
Stratos Markets Limited (tradu.com):
CFDs are complex instruments and come with a high risk of losing money rapidly due to leverage. 63% of retail investor accounts lose money when trading CFDs with this provider. You should consider whether you understand how CFDs work and whether you can afford to take the high risk of losing your money.
Stratos Europe Ltd (tradu.com):
CFDs are complex instruments and come with a high risk of losing money rapidly due to leverage. 63% of retail investor accounts lose money when trading CFDs with this provider. You should consider whether you understand how CFDs work and whether you can afford to take the high risk of losing your money.
Stratos Global LLC (tradu.com):
Losses can exceed deposits.
Please be advised that the information presented on TradingView is provided to Tradu (‘Company’, ‘we’) by a third-party provider (‘TFA Global Pte Ltd’). Please be reminded that you are solely responsible for the trading decisions on your account. There is a very high degree of risk involved in trading. Any information and/or content is intended entirely for research, educational and informational purposes only and does not constitute investment or consultation advice or investment strategy. The information is not tailored to the investment needs of any specific person and therefore does not involve a consideration of any of the investment objectives, financial situation or needs of any viewer that may receive it. Kindly also note that past performance is not a reliable indicator of future results. Actual results may differ materially from those anticipated in forward-looking or past performance statements. We assume no liability as to the accuracy or completeness of any of the information and/or content provided herein and the Company cannot be held responsible for any omission, mistake nor for any loss or damage including without limitation to any loss of profit which may arise from reliance on any information supplied by TFA Global Pte Ltd.
The speaker(s) is neither an employee, agent nor representative of Tradu and is therefore acting independently. The opinions given are their own, constitute general market commentary, and do not constitute the opinion or advice of Tradu or any form of personal or investment advice. Tradu neither endorses nor guarantees offerings of third-party speakers, nor is Tradu responsible for the content, veracity or opinions of third-party speakers, presenters or participants.

Gold Wave 5 Bull Complete?! (4H UPDATE)Wave 1 'Impulse Move' has moved very nicely to the downside & more is yet to come. So far the Wave 1 sell off has consisted of a 2,100 PIP move to the downside.
I'm now waiting on a Wave 2 correction of some sort, weather that's a 'Simple 3 Sub-Wave' or 'Complex 5 Sub-Wave' correction. During this correction I can enter more sell positions on behalf of my Gold Fund investors.

XAUUSD Analysis todayHello traders, this is a complete multiple timeframe analysis of this pair. We see could find significant trading opportunities as per analysis upon price action confirmation we may take this trade. Smash the like button if you find value in this analysis and drop a comment if you have any questions or let me know which pair to cover in my next analysis.

Gold drops sharply amid panic but fundamentals remain strongGlobal markets opened the week under pressure, with major equity indices tumbling once again as volatility swept through the Asian session. The latest wave of selling follows China’s announcement of retaliatory tariffs on the U.S., intensifying the fallout from last week’s ‘Liberation Day’ tariff shock.
Investors had hoped that the worst of the uncertainty would fade following the initial U.S. tariff announcements. Instead, the reality has proven more severe. With tariffs exceeding expectations and no sign of negotiations, markets are now increasingly pricing in the risk of a global recession—beginning with the U.S.
This risk-off mood has triggered broad-based liquidation across asset classes. Even traditional safe havens have not been spared.
Gold Suffers in Unusual Selloff
Gold, typically a beneficiary of risk aversion, has not been immune. XAU/USD has dropped more than 6% since Thursday, a move that seems to defy its status as a hedge during times of market stress. The likely explanation: forced liquidation. As losses pile up elsewhere, investors appear to be selling profitable or liquid assets like gold to meet margin calls or reduce exposure. As a result, this selloff looks more technical and sentiment-driven than fundamental. The key factors that have supported gold remain intact:
- Rising geopolitical tensions
- Ongoing global growth concerns
- Expectations for lower interest rates
- Continued central bank demand for gold
Looking beyond the short-term panic, the medium- to long-term outlook for gold remains bullish. The current environment—marked by volatility, economic uncertainty, and central bank caution—typically favours gold.
Last week, Fed Chair Jerome Powell reaffirmed the Fed’s “wait-and-see” approach in response to the unfolding instability. This week’s March CPI release will be crucial. If inflation data shows further softening, it could strengthen the case for future rate cuts, potentially reigniting demand for gold. On the other hand, a surprise uptick in inflation could limit the Fed’s ability to ease, injecting more uncertainty into the macro picture.
Technical View: Consolidation May Invite Fresh Buyers
On Monday morning, XAU/USD briefly dipped below the 3,000 level, but quickly found support and began stabilizing. While gold has pulled back from recent highs, the daily chart suggests there’s no strong appetite for aggressive selling at current levels.
The RSI (Relative Strength Index) has reset from overbought territory, creating a more favourable technical backdrop for new buying interest—particularly from bargain hunters seeking entry at lower prices.

we are long now againI am considering buying XAUUSD (Gold vs. US Dollar) based on a trendline analysis.
Key Considerations
1. Trendline Confirmation: Ensure the trendline is confirmed by multiple data points.
2. Support and Resistance: Identify key levels that may impact price movement.
3. Market Conditions: Consider broader market trends and relevant news or events.
Trading Strategy
1. Entry Point: Determine your entry point based on the trendline analysis.
2. Risk Management: Set stop-loss and take-profit levels to manage risk.
Additional Insights
1. Technical Indicators: Use indicators like Moving Averages or RSI to gauge momentum and volatility.
2. Chart Patterns: Look for patterns that may support or contradict the trendline analysis.

Mon 7th Apr 2025 XAU/USD Daily Forex Chart Sell SetupGood morning fellow traders. On my Daily Forex charts using the High Probability & Divergence trading methods from my books, I have identified a new trade setup this morning. As usual, you can read my notes on the chart for my thoughts on this setup. The trade being a XAUUSD Sell. Enjoy the day all. Cheers. Jim
Gold crash Q3 & Q4 2025, rebound in 2026Last time Gold hit an RSI of ~85 was the first half of 2008, when it crashed 31% (a high of $988 to a low of $681) during the 2nd half of the year, only to rebound to new highs the following three years. History could begin to repeat this year.

Lingrid | GOLD anticipating Potential MARKET RetracementThe price perfectly fulfilled my last idea . It hit the target zone. Overall, OANDA:XAUUSD market is in the process of forming an ABC move, with the C point nearing completion around the 3175 resistance zone. The market has made a corrective move of about 1.9% from the peak of the consolidation zone before. I think that the price might create a similar pullback from the all-time high zone. Given the high-impact news scheduled for today, it’s possible that the price could retest the area below yesterday's low. However, considering the current momentum, I expect the market is likely to bounce off the support level and the upward trendline, ultimately moving forward to complete the ABC pattern. My goal is resistance zone around 3170.
Traders, if you liked this idea or if you have your own opinion about it, write in the comments. I will be glad 👩💻

The golden large-scale "roller coaster" has near misses and no dFrom the 4-hour analysis, pay attention to the short-term suppression at the 3130-35 line on the top, and the short-term support at the bottom is around 3100-3106, with a focus on the support at 3083-3087. Continue to maintain the rhythm of low-long positions above this position, and stick to the idea of buying more on pullbacks. Go long with the trend to hold the long space, and try not to go against the trend.
Gold operation strategy:
Gold retreats to the 3100-3106 line for more, and retreats to the 3083-3087 line to cover more positions, stop loss 3077, target the 3130-3135 line, and continue to hold if the position is broken;

Gold ideas April 3rd📢 Market Insight of the Day:
Gold continues its moon mission 🚀, fueled by central banks stacking like it’s Black Friday shopping 🛒. Inflation? Still a headache 🤕. Geopolitical tensions? Still spicy 🌶️. The result? Gold remains the MVP of safe-haven assets 🏆.
But hold up—price has tapped major liquidity levels above $3,160 💰. Is this a clean breakout, or is NY about to pull its favorite trick 🃏—a liquidity sweep before a fresh rally? Trap or continuation? That’s today’s game. 🎮
Session Breakdown – How to Play This Plan Before NY
🌙 Asia Session (Now) 🏮
Expect slower movement unless China drops a surprise bombshell 📉💣 (economic data or gold hoarding spree).
If gold sweeps liquidity early, watch for rejections near $3,116 – $3,122 for potential scalp longs 🎯.
If price runs too high now, London might sell off first!
☀️ Frankfurt & London Sessions (Big Moves Start Here) 🇩🇪🇬🇧
This is where the real game begins! 🎮
London loves a fakeout—expect either a sweep of $3,116 before a pump 🚀 OR a stop hunt above $3,160 before a drop.
Buyers: Look for London to wick into our sniper zones before going up.
Sellers: If price spikes to $3,165+ in Frankfurt/London and struggles, short scalps are on the table 🎯.
🔥 NY Session (Final Boss)
By this point, liquidity has been taken somewhere, and NY will either continue trend OR completely reverse it.
If London pushed high, NY might sell off first. If London dumped, NY might pump.
The sniper plays in the plan are mostly for NY, but Frankfurt/London traders can catch setups earlier.
👑 Bottom Line:
Asia = Slow & Steady 🐢 (unless China flexes)
London = The Trap Session 🎭 (watch for fakeouts!)
NY = The Big Move 🎯 (final trend decision)
🎯 💎 High-Probability Trade Setups
🟢 🎯 Buy Setup 1 (Precision Long Play – Trend Continuation)
📍 Entry: $3,122 – $3,116 (OB + FVG demand zone 💰)
⚡ Trigger: M1/M5 CHoCH + bullish engulfing confirmation 📈
⛑️ SL: Below $3,110
🎯 TP1: $3,135
🎯 TP2: $3,150
🎯 TP3: $3,165
📌 Why?
✅ As long as price holds above $3,110, gold is still bullish 🐂.
✅ Order Block + FVG + liquidity grab = sniper confluence 🔥.
🟢 🎯 Buy Setup 2 (Deeper Discount Play – If NY Sweeps Lower Liquidity)
📍 Entry: $3,100 – $3,094 (Major demand zone 💰)
⚡ Trigger: M1/M5 bullish CHoCH or exhaustion wick 🕯️
⛑️ SL: Below $3,090
🎯 TP1: $3,116
🎯 TP2: $3,135
🎯 TP3: $3,150
📌 Why?
✅ Still bullish as long as we stay above $3,090 🚀.
✅ If price nukes below $3,090, don’t fight it 🚨—look for deeper entries.
🟥 🚨 Sell Setup (Liquidity Trap Short – Only If Price Gets Exhausted at Supply)
📍 Entry: $3,165 – $3,179 (HTF supply + liquidity grab zone 🚨)
⚡ Trigger: M5/M15 bearish CHoCH + exhaustion wick 🕯️
⛑️ SL: Above $3,182
🎯 TP1: $3,150
🎯 TP2: $3,135
🎯 TP3: $3,116
📌 Why?
✅ Confluence: Supply zone + liquidity sweep 💦 + exhaustion pattern.
✅ Short scalps only ⚡! If gold stays above $3,150, don’t be a perma-bear. 🐻❌
✅ 📌 Key Takeaways:
✔ Gold remains bullish above $3,100 – buy dips like a pro sniper 🎯, don’t FOMO into highs.
✔ If NY sweeps below $3,110, sniper long opportunities will be on fire 🔥.
✔ Sells are scalps only – favor longs unless $3,090 gets nuked. 💣
✔ NY session is a manipulation master 🎭 – stay patient, don’t chase!
📌 Important Notice!!!
The above analysis is for educational purposes only and does not constitute financial advice. Always compare with your own plan and wait for confirmation before taking action.

XAUUSD | Sniper Entry Zones Ready – Eyes on 3145 & 3086 Reactio🔍 Daily Bias: Neutral with Bearish Intraday Tilt
Price is reacting to a previously unmitigated zone and potentially retesting a premium area, suggesting sell-side interest may return before any bullish continuation.
🧠 Key Context from Your Marked Chart
✅ Marked Sell/Retest Zone @ 3135–3145:
Clearly defined premium zone with imbalance and prior bearish reaction — confluence with OB + FVG, potential sniper entry for shorts.
✅ Unmitigated OB @ 3086–3095:
Valid demand zone where price bounced aggressively — still active liquidity + FVG.
✅ Major Imbalance Below @ 3054–3040 & 3040–3029:
Heavy drawdown target area. If price breaks 3086, expect it to fill imbalance and potentially bounce at 3040 or deeper around 3029.
🔽 Sell Scenarios
🟥 Sell #1 — Retest of Supply Sniper Entry
Entry Zone: 3135–3145
Confluences: Valid OB, FVG, Premium, Bearish PA from last touch
Target: 3086, then 3054–3040 imbalance zone
RSI: Check for overbought on M15–H1
🎯 "Classic sniper setup — get in, get out. No overthinking required."
🟥 Sell #2 — Break and Retest Below 3086
Trigger: Bearish close below 3086 + BOS on M15
Retest Entry: 3086 zone from below
Target: 3054 (first FVG), then 3029
EMAs: 5/21/50 flip short on M15 for confirmation
🟩 Buy Scenarios
🟩 Buy #1 — Bounce from 3086–3095 (Unmitigated OB)
Entry: Clean reaction + bullish PA in zone
Target: 3135 retest, partials at 3114
Sniper Confluence: BOS on M5/M15 + RSI divergence
🟩 Buy #2 — Deep Bounce from 3040 or 3029 Imbalance Zone
Entry: Only on strong PA confirmation (no early knives)
Target: 3086 first, 3135 secondary
RSI + EMA: Look for EMA 100–200 confluence, bullish divergence on RSI M15/M30
🧾 Technical Confluences Summary
✅ SMC: BOS + CHoCH present across M15–H1
✅ FVG: 3135–3145 (upper), 3054–3040 (lower)
✅ GAPS: Visible in 3054–3029 zone
✅ LIQUIDITY: Above 3145 + below 3029
✅ OB VALID: 3086–3095 still unmitigated
✅ RSI: Overbought earlier, neutral now. Watch intraday shifts.
✅ EMA Clusters:
EMA 5/21 flat after rebound
EMA 50/100 just below 3100
EMA 200 near 3050–3040 (high confluence for bounce)
⚠️ News & Fundamentals
Trump conference added USD volatility, but gold didn’t rally — watch for Fed speakers & JOLTS data tomorrow.
If dollar strengthens intraday again → watch sell setups more closely.
🧨 TradingView Title Suggestion:
“🎯 XAUUSD | Sniper Entry Zones Ready – Eyes on 3145 & 3086 Reactions!”

Non-agricultural gold is expected to fall sharply. On Friday (April 4), at 20:30 Beijing time, the U.S. Bureau of Labor Statistics released the highly anticipated March non-farm payrolls report, which put pressure on gold.
Fundamentals: Today, gold is expected to fall sharply. The market continues to short at resistance points.
Market volatility is expected to increase during the period. The long-short game of the US dollar index near the 102 mark will determine whether it can continue to rise. If it breaks through 103, it may further suppress gold and non-US currencies. Gold is looking for direction in the range of 3080-3100 US dollars/ounce. If risk aversion picks up, it may retest the 3100 mark; on the contrary, if the US dollar continues to strengthen, breaking through 3080 will open up downside space. The decline in US stock futures may continue until early next week.

#XAUUSD: Last Sell Idea Dropped +300 Pips, Bias Changed? XAUs price behaviour has deviated from previous analysis, which had anticipated a +300 pips increase. However, we now anticipate the price to continue its upward trend, potentially reaching another record high. Our next target price range is estimated to be between 3170$ and 3200$.
We extend our best wishes for your successful trading endeavours. To enhance your trading outcomes, we strongly recommend employing accurate risk management techniques.
Team Setupsfx_
🚀❤️

Snipper plan ideeas before NFP and Powell Speech - April 4th📌 Macro & Market Context
Gold remains in a strong HTF bullish market structure, with recent highs around $3,160 acting as a key resistance.
NFP data, Unemployment Rate and Powell's speech will add increased volatility later today.
The market is currently correcting after liquidity grab above $3,160, showing signs of distribution.
📊 Market Structure Overview (4H & 1H)
Bullish/Sell bias remains neutral, but a temporary retracement is underway.
Premium supply zones are positioned above $3,140–$3,160.
Discount demand zones are around $3,080–$3,050.
📍 Setup 1 SELL
Scenario: Bearish retest to this zone
Entry: $3,135 - $3,145 (if price returns to this zone).
Confirmation: Rejection wick + Bearish Engulfing on 15M or 5M.
Stop Loss: Above $3,153
TP1: $3,125
TP2: $3,110
TP3: $3,090
📍 Setup 2 SELL
Scenario: Wait for price to push back into 3,091–3,095 zone (M5 imbalance retest).
Entry: 3091-3095
Confirmation: Entry on rejection + BOS or CHoCH M1/M5.
Stop Loss: Above 3,096
TP1: 3066
TP2: 3054
TP3: 3040
📍 Setup 2 BUY
Scenario: If price retraces to key demand zones $3,080–$3,070, look for a long entry.
Entry: Buy at $3,080–$3,075.
Confirmation: Liquidity grab + Bullish engulfing on LTF (1M, 5M).
Stop Loss: Below $3,070.
TP1: $3,100
TP2: $3,120
TP3: $3,135
📍 Setup 3 BUY
Scenario: Bounce/reversal confirmation near 3,054 (last demand block + imbalance edge).
Entry: Buy at 3048-3055
Confirmation: Entry only if M1/M5 shows CHoCH + volume.
Stop Loss: Below 3048
TP1: 3085
TP2: 3115
TP3: 3128
📌 Important Notice!!!
The above analysis is for educational purposes only and does not constitute financial advice. Always compare with your own plan and wait for confirmation before taking action.
If you find the ideas contribute to your views on the market be kind to press boost🚀/like button. Your support is appreciated.

Let's cover the action of some instruments as we get the NFPLet's see what's happening with the market as we get the NFP number live.
Let's dig in!
MARKETSCOM:DOLLARINDEX
TVC:DXY
TVC:GOLD
FRED:SP500
FX_IDC:EURUSD
MARKETSCOM:EURUSD
Let us know what you think in the comments below.
Thank you.
77.3% of retail investor accounts lose money when trading CFDs with this provider. You should consider whether you understand how CFDs work and whether you can afford to take the high risk of losing your money. Past performance is not necessarily indicative of future results. The value of investments may fall as well as rise and the investor may not get back the amount initially invested. This content is not intended for nor applicable to residents of the UK. Cryptocurrency CFDs and spread bets are restricted in the UK for all retail clients.

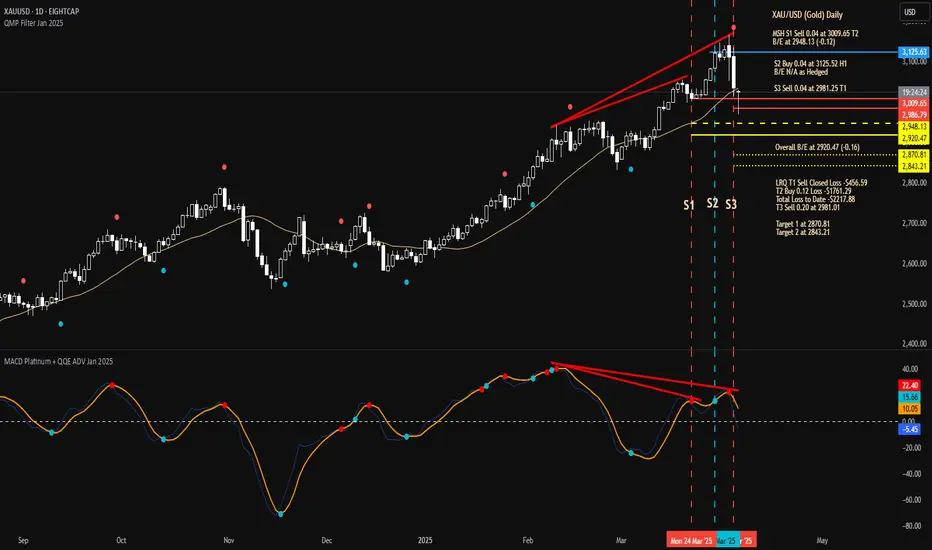
Closing multiple orders with ProfitAs discussed throughout my Wednesday's session commentary: "Technical analysis: The Price-action was once again seen Trading below the #3,152.80 benchmark extended decline where Sellers should finally prevailed and dragg the Price-action more than #57 points downwards (as was announced on one of my remarks lately that Gold always prints #57 point decline once the local High’s rejects the sequence and delivers the eminent rebound). Gold is dangerously approaching again the Higher High’s trendline of the Daily chart’s wide Ascending Channel, way above the #MA50 (aswell on Daily chart, representing in the same manner the Long-term Support zone) in Overbought waters, however every pullback on Gold is accumulation zone for new Bullish cycle."
First order I have engaged was Wednesday's Sell order (#3,132.80 - #3,111.80) and I have continued Selling every local High's throughout yesterday's session as I announced possible Selling correction ahead on Gold.
Technical analysis: Gold delivered Selling extension as I announced however it would be best for Short-term Sellers to wait for area to be engulfed, as today’s session will most likely represent the crossroads for the next Week, taking in consideration that one can never foresee the sequence until when Fundamentally driven rises and upswing (such as current one) will last and how Gold will digest today's session NFP numbers. Lagging upswing sequence comforted Sellers on it’s Intra-day basis, as Price-action was close to the #2-Month Bottom. The Price-action has altered the downtrend fractal near the Daily chart’s Ascending Channel’s Lower zone, as discussed on my latest commentary, with current mentioned configuration above representing former strong #1-Month Resistance zone. As long as this holds, there are Higher probabilities to reach the Hourly 4 chart’s Higher High’s Lower zone again on Spot prices however touch may be completed Lower depending on the aggression of the current variance. Technically, Gold should ease the Overbought levels, but on such Fundamental landscape (Bull bias), both sides are equally probable unless #3,137.80 gets invalidated to the upside once again. After all, on the Daily timeframe, the pattern is an healthy Ascending Channel which just touched the Higher High’s trendline and has a limit just over current structure, my main point of interests (depending on the impulse of the wave started early last Week). Above the #3,137.80, Short-term Selling pattern is invalidated and the relief attempt may be accelerated towards the Hourly 4 chart’s #3,152.80 benchmark.
My position: After excellent week behind me, I didn't had to Trade the NFP however I will as I do expect downside surprise on NFP which could skyrocket Gold upwards coupled with Powell's talks.

GOLD NEXT MOVE (expecting a bullish move)(01-04-2025)Go through the analysis carefully and do trade accordingly.
Anup 'BIAS for the day (01-04-2025)
Current price- 3130
"if Price stays above 3118, then next target is 3148, 3168, 3182 and 3190 and below that 3108 ".
-POSSIBILITY-1
Wait (as geopolitical situation are worsening )
-POSSIBILITY-2
Wait (as geopolitical situation are worsening)
Best of luck
Never risk more than 1% of principal to follow any position.
Support us by liking and sharing the post.
