Gold (XAU/USD) Technical Chart Review – April 6, 2025The gold market is currently undergoing a corrective phase after completing a clear Elliott Wave 5-wave impulse structure to the upside, as marked on the chart.
🟦 Wave Count Overview:
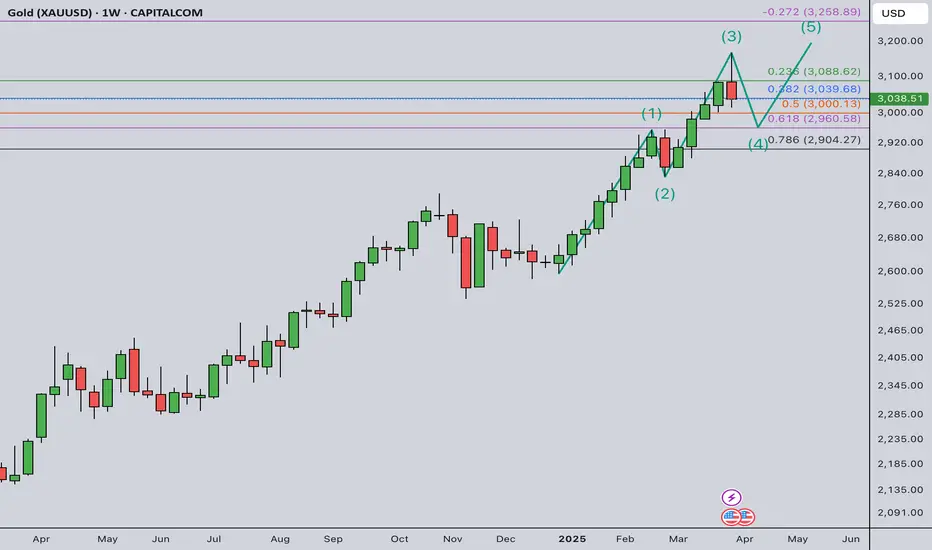
The chart shows a completed 5-wave impulse structure labeled (1) to (5).
The sub-waves within Wave (5) are also clearly detailed: (i), (ii), (iii), (iv), and (v).
This suggests that the bullish cycle has likely peaked near the $3,080–$3,100 range.
🔽 Expected Correction:
A sharp downward move has already started after Wave (v), implying a potential ABC corrective pattern is underway.
The arrow indicates a projected move towards the $2,960 support zone, marked by the first purple rectangle. This zone previously acted as resistance and now could serve as a demand area.
🟪 Key Support Zones:
$2,950–$2,970: Minor support based on the consolidation from mid-March.
$2,850–$2,870: Stronger support level, also aligned with lower channel support and previous Wave (4).
📉 Trend Analysis:
The price is still within a long-term rising channel.
A breakdown below the $2,950 zone could bring gold toward the $2,850 zone, where the structure suggests more significant support.
🔍 Conclusion:
Gold appears to be entering a corrective phase after an extended bullish run. Traders should monitor how price reacts around the $2,950–$2,850 levels. A bounce from those zones could provide long opportunities, while a breakdown would confirm a deeper retracement.
#gold #xauusd
XAUUSD.F trade ideas

GOLD is GOLD .. UP and UpA close above 3060 targets 3072, 3085, and 3095.If we can hold above 3050, then that bullish scenario remains in play. However, a break below 3050 negates the immediate upside and could see us test 3040 support. Watch volume on any move; increasing volume confirms the breakout or breakdown. Key is patience and waiting for confirmation. Remember to manage risk.

GOLD BREAKS SHARPLY — BUT THE MOVE WAS WRITTEN IN THE STRUCTURE🟡 GOLD BREAKS SHARPLY — BUT THE MOVE WAS WRITTEN IN THE STRUCTURE
A steep drop in gold just rattled the markets — but if you’ve been following the macro and technical setup closely, this was not only expected, but anticipated.
From the first week of April, we’ve been tracking signals of potential exhaustion in XAUUSD:
🕯️ Candlestick wicks on higher timeframes
📈 Overextended structure
🧠 Macro divergence
Now, all signs have converged — and we’re finally seeing the correction play out.
🔍 Why This Isn’t Just About Gold
What we’re seeing is a broader shift in global market sentiment:
U.S., European, and Asian equities are all under pressure
Crypto has stagnated with little to no fresh capital inflow
Gold — after months of aggressive buying — is now facing wave after wave of profit-taking
This is classic risk-off behaviour.
Investors are choosing cash, sitting tight, and waiting for clarity — not only in the charts but in the headlines too.
📉 DXY Building a Case for Recovery
The U.S. Dollar Index (DXY) has been heavily sold in recent months — but is now holding at a multi-year structural support zone that’s been tested multiple times since 2021.
With Trump returning to the spotlight and triggering a fresh round of global tariff negotiations, the USD is regaining narrative strength.
Trump’s stance has already prompted discussions among major economies, putting the U.S. in a dominant position — and the market is beginning to price that in.
🤔 What’s Holding the Fed Back?
Despite rising trade tensions, the Federal Reserve has remained cautious — choosing not to act until the dust settles from geopolitical and policy developments.
This creates a window of opportunity:
If the Fed holds rates while global central banks soften
And if the USD holds this major support
→ We could see strong dollar flows return in Q2.
🔮 Gold Outlook – Where Next?
In the short term:
Expect continued volatility
Potential for gold to slide further toward 308x – 305x range
Any bounce is likely to be technical rather than fundamental
In the medium term:
Once political noise fades, gold may find support again
Especially if inflation expectations persist or the Fed pivots dovish later in Q2
💡 Takeaways for UK Traders
✅ Don't trade the news — trade the reaction
✅ Macro structure matters more than the daily headlines
✅ Capital preservation beats chasing euphoria
We’re not guessing.
We’re reading the story and planning with structure.

Gold AnalysisThe 4-hour gold structure is still bullish and the liquidity pool range of 3013 to 3000 can be considered a liquidity trap. Support below this liquidity pool is 2996 to 2990 and resistance ahead of the market is 3070 to 3084. Analysis of the movement towards the liquidity pool hunt and then an increase towards the opposite liquidity level in the range of 3135

Gold Weekly Summary and Forecast 4/5/2025Finally we see another red candle on goldy. A lot of people said this could be the end for the bull. However, I don't think yet as currently it is only in the middle of the 4th wave. The next two weeks would be crucial. If we see another green weekly candle, we will be on the way to the final wave, which i think will be the end for the bull for this year.
For next week's setup, I will engage selling orders for the first few days while be cautious towards the end of the week. My bearish targets are 3000 and 2960. If either of the two numbers blocks the bear's path, we could a see a rebound.
Let's see how the market plays out next week.
new era in gold...just sell gold!!!wave 5 of 5 of 5 has ended yesterday and its the time to sell gold...gold will fall heavily in next 6 month and we should just be selllllllller guys!!!its end of the buyer era!!!trump dump them badly

Aggressive sell set up🔍 Institutional Liquidity Analysis
• Liquidity Zones:
• Above: $3,118–$3,120 (weak highs & EQH)
• Below: $3,111–$3,108 (liquidity pool & EMA cluster)
• Point of Control (POC: $3,114.33) just under current price → suggests price may sweep down before true move
• Volume Clusters: Exhaustion at current candle top (weak bullish imbalance). Institutions may be preparing a liquidity sweep soon.
⸻
📈 Momentum Indicators
• RSI (1m): Entering overbought territory → signal for short-term reversal
• MACD (15m): Still bearish but trying to cross bullish, early confirmation
• VWAP: Price hovering just above VWAP zone, potential for mean reversion
• EMA 50 & 200: Tightening up – possible micro-pullback or trap setup
⸻
📰 News Impact Summary
Recent headlines from TradingView suggest:
• Gold hit all-time highs but reversed due to Trump Tariff headlines and risk-off shift
• Macro tone is now uncertain, with gold reacting to short-term risk sentiment, not long-term dovish Fed policy
• Sentiment = Neutral to Bearish, especially after euphoric highs were sold off
⸻
🛑 Trade Decision:
SELL SETUP (High Probability – 75-80%)
Price is entering minor supply, and forming equal highs just under $3,118 – classic trap pattern for liquidity sweep.
Entry:
$3,116.50 – $3,118.00 (watch for rejection wicks or engulfing patterns on 1m)
Stop Loss:
Above $3,120.50 (above weak high + institutional wick trap)
Take Profit Targets:
1. TP1: $3,111.50 → POC retest zone
2. TP2: $3,108.00 → Demand zone base
3. TP3: $3,104.00 → Discount rebalance
Risk-Reward: Minimum 3.2:1 R:R
⸻
🚨 Final Institutional Verdict:
🔴 SELL at Premium!
Price is now in a liquidity engineering zone, with high likelihood of pullback toward POC or lower imbalance. Institutions likely to grab liquidity above equal highs, then rotate price lower.
⸻
⚡ Ultra-Aggressive Execution Plan
• Confirm on 1m with bearish engulfing OR SFP wick
• Volume spike + RSI > 70 = trigger for entry
• Monitor order book flow and footprint for absorption near $3,116–$3,118
⸻
WE TRADE TO MILK THE MARKET EVERYDAY!
Let’s trap the trap! Institutions are hunting liquidity – we hunt with them!
SELL NOW and BANK those pips! 💰🔥📉🚨💣💵

NFP - Shorting GoldThe gold market experienced huge fluctuations on Thursday, which created very good profits for us. During the entire trading process, we seized the profits of fluctuations of more than $50.
The unemployment rate and NFP data during the US trading session on Friday, as well as Powell's speech on the economic outlook, are the focus of Friday's trading.
Judging from the data released in March, the unemployment rate and NFP are more likely to be bearish for gold, so when trading data, my plan is to focus on short positions.
At present, in terms of technical form, the indicators show that the bulls have not ended. In this case, the transaction needs to pay attention to the 3123/3136 resistance. If it cannot break through, the price is expected to fall again to 3103 or even 3086.
Overall, today's trading focus is to sell at high levels.
GOLD KING…1:16rr Trade BOOOOM VIPAnother short term trade 15-30m Trade
BOOOOOM
1:16rr
Entry as it forms.

gold long after checkout candle OANDA:XAUUSD we going long on gold use risk management all hands up good luck

XAUUSD Pulls Back From Record HighGold price hits a record $3,167.84 before pulling back as traders lock in profits after a steep safe-haven rally.
XAUUSD support sits at $3,083.65, with a break lower exposing $3,000.28 as the next key downside level.

XAUUSD CLOSURE BELOW $3,053 IS NEED TO CONFIRM BEARISH I have made significant profit from gold selling from above $3,161 to $3,086. Now it is just safe to wait for a closure below $3,053 to confirm bearish continuation and sell at a restest after some bearish chart pattern to further confirm and enter.

XAUUSD 1H, 03/04/2025, 04:40PM. Target Done.After deciding this trade as a sell setup in the morning, it has successfully reached its target, which we have shattered throughout the day.

Waiting for the right-side signal, gold prices are still in consDue to the relatively high tariffs signed by Trump, gold has experienced a significant rebound, with daily fluctuations approaching $100—volatility levels previously seen over the course of two weeks or even a month are now occurring within a few hours. After surging past $3000, the increased base has led to a dramatic rise in market volatility. While larger price movements may give the impression of easier profits, they also increase the risk of losses. As volatility rises, risk perceptions diminish, whereas human greed tends to escalate.
When daily fluctuations are limited to $10-20, the risks are minor, allowing for simpler directional trading, albeit with fewer opportunities. However, in the current environment, price changes of over $10 in just five minutes can trigger heightened greed, resulting in more frequent and varied trades. The unpredictability of market behavior complicates trading decisions. As humans, we tend to fear missing opportunities, leading us to enter trades impulsively. Conversely, when volatility decreases and waiting times lengthen, our desires tend to diminish, potentially increasing the chances of profitable trades.
Currently, testing the upper limits of gold prices is challenging as the market is under constant pressure to break higher. It’s essential to note key points: between 7-8 AM, we typically see a first wave of unrestrained upward movement. Observing market cycles is critical; in the last two days, we saw spikes during the European session followed by declines in the U.S. session, which then rebounded. If specific entry points are elusive, focus on cycles and the extent of previous corrections, identifying key timing for trades. For instance, yesterday exhibited a typical morning upward cycle, followed by a sustained upward trend during the European session that didn't break the previous highs, resulting in a lateral movement during the U.S. session.
Today, yet again, we are witnessing a 7-8 AM upward cycle with prices breaking above $3168. However, this pullback increases risks, particularly near the former double-bottom and the 618 retracement levels around $3130-32, which are crucial points to watch this afternoon. If there’s a continued upward move that breaks past the high, one should consider short entries if the price later retraces. A key observation must be made during the U.S. session, as recent pullbacks primarily occurred during this time. Following the morning's upward cycle, be vigilant of the 618 level and small double-bottoms; should there be a second rebound without breaking previous highs, consider going short during the U.S. session.
Although the broader trend lacks definitive signals of a peak, risks are inherently rising. In this environment, it’s important to heed the emphasized cycles of market behavior and timing. Increased volatility necessitates caution; avoid blindly chasing shorts or longs, and remain attuned to the market rhythm.

4.3 How to operate after the sharp rise in gold prices4.3 How to operate after the sharp rise in gold prices
1. Impact of tariff policies
- Base tax rate 10% + "reciprocal tariffs": Trump's radical tariff policy far exceeds market expectations, directly triggering concerns about escalating global trade frictions and triggering market risk aversion demand.
2. Expectations of a weaker US dollar: Tariffs may weaken the competitiveness of US exports, and the Federal Reserve may introduce loose policies, which will put pressure on the US dollar and further support gold.
3. Gold's safe-haven properties have exploded
Gold, as a hard currency without sovereign credit risk, has become a "safe haven" for funds.
4-hour cycle:
Confirmation of strong structure:
3100 support: Multiple retracements have not been broken, forming an "ascending triangle" consolidation pattern, and a sharp breakthrough in the early trading confirms the continuation of the trend.
Target forecast:
Short-term: US$3,200 (integer psychological barrier + fermentation of risk aversion).
Medium-term: If it breaks through 3,200 points, the next resistance level is 3,218 points.
1-hour chart strategy:
Key watershed 3100:
This week's lows gradually moved up (3076→3100→3106). If the callback does not break this position, the trend will not change.
Intraday strength and weakness dividing line 3130:
Yesterday's box top broke through and turned into support, which is in line with the principle of "top and bottom conversion".
Ideal intraday long position: 3115-3120 area, stop loss 3105.
Patiently wait for the callback
Aggressive strategy: If the gold price stands above 3150, you can chase long with a light position, with a target of 3173→3200.

Gold (XAU/USD) AnalysisGold (XAU/USD) Analysis
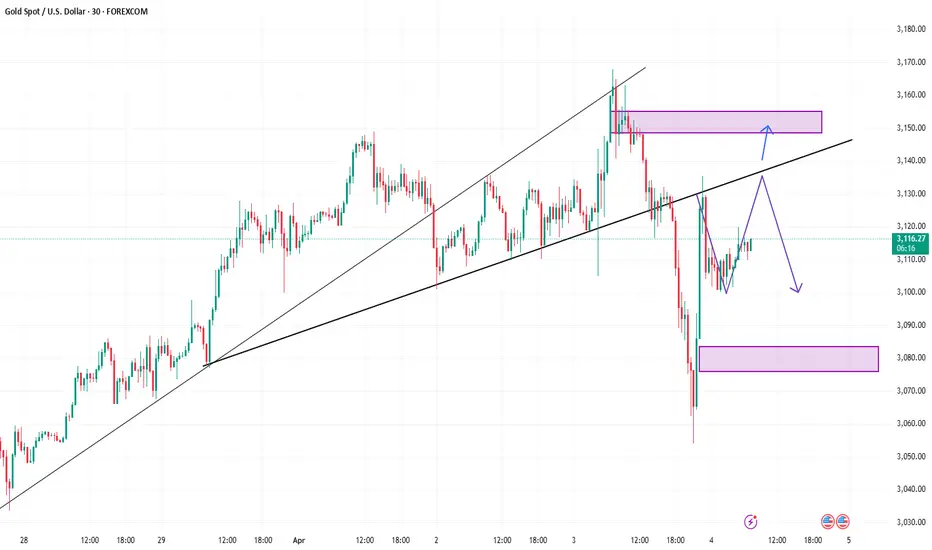
This chart provides a technical outlook on **Gold (XAU/USD)**, showing possible **bullish** and **bearish** scenarios based on price action and support/resistance levels.
Bullish Outlook
Key Support Holding**: Gold is staying above **$3,125-$3,130**, showing buyers are stepping in.
- **Uptrend Structure**: Price is following a rising trendline, meaning bullish momentum is intact.
- **Breakout Zone**: If Gold surpasses **$3,155-$3,160**, it could rally toward **$3,170-$3,180**, as no major resistance exists in that range.
What to Watch?
- A strong breakout with volume above **$3,155-$3,160** confirms upside potential.
- Look for support at moving averages (EMAs) to validate trend continuation.
Bearish Outlook
- **Resistance Rejection**: If Gold fails to break above **$3,155-$3,160**, it might face selling pressure.
- **Break Below $3,140**: If price drops under this level, it could target **$3,125-$3,110**, which is the next key support.
- **Further Downside**: A breakdown below **$3,110** could lead to a deeper decline towards **$3,090-$3,080**.
What to Watch?
- A drop below **$3,140** with strong volume could confirm further downside.
- If selling pressure increases, Gold may retest lower support zones.
Final Thought
Gold is currently in an **uptrend**, but traders must monitor key levels:
✔ **Bullish if** it breaks **$3,160** 📊
✔ **Bearish if** it falls below **$3,140** 🔻
Stay cautious and wait for price confirmation before making a move! 🚀

April 3, 2025 - XAUUSD GOLD Analysis and Potential OpportunitySummary:
After Trump announced details of new tariffs, the market turned highly active. From a fundamental perspective, this provided strong support for gold.
Pay attention to the 3105 level, which was quickly tested following Trump’s statement before price rallied higher.
Unless a clear reversal signal appears, the main strategy remains: buy on pullbacks to support.
Key Levels to Watch:
3170–3175: Bullish target zone
3168: ATH resistance
3156: Resistance
3142: Bullish/Bearish pivot line
3120–3138: Price consolidation / value zone
3105: Strong intraday support
Short-Term Trading Strategy:
For Shorts: Enter a SELL if the price breaks below 3146. Watch 3142 first; if the decline continues, monitor 3138, 3133, and 3128.
For Longs: Enter a BUY if the price holds above 3156. Watch 3160 for confirmation; if momentum continues, target 3165, 3168, and 3170.
👉 If my insights have been helpful to you, or if you traded based on my ideas, please consider giving a like — it’s a great encouragement for me! Thanks for your support!
Disclaimer: This is my personal opinion and not financial advice. Please manage your risk accordingly.

Some history....GOLD HISTORY:
1970 TO 1980:
Gold has a strong bubble rise that falls 50% when it breaks.
2001 to 2011:
10 year up trend
Gold rises further with virtually no setbacks until 1919, but then collapses to $1019.
2015 to 2025:
10 year up trend still at the moment.
The gold price has increased from $1019 in December 2015 to well over $3155 today without serious dips or pullbacks. It is easy to see why this attracts investors, especially when compared to the turbulence in the stock market over the same period of time. It is also easy to see why people might expect that gold will continue to rise after watching it gain consistently for well over a decade.
However, history shows that asset prices cannot continue to go up indefinitely. There are always pull backs, crashes, and bear markets. The last time this happened to gold is a distant memory, but we all remember recent examples such as the tech stocks in the '90s and home prices in the '00s.
Now, lets see Elliot wave principle. When an extending wave 5 ends ( we are at one at the moment), we will see a swift correction down to sub wave 2 of this wave 5. So, the opportunity presents in two ways. First, we know it will be a rapid correction, which means we will not have to wait long for realizing our profits. Secondly, we know approximately how far the down move will likely travel.
At this moment , we are looking for the same escenario as 2008. Wave 3 travels 5.618 from wave 1, then wave 4 made a correction to the 38.2% zone, and finally wave 5 was equal to the entire previous 1-3 movement. This is what is happening right now as welll.
It is always easier to identify assets that are bubbling than to predict when the bubble will pop. Gold has much more downside than upside at this point, but this has been true for years without slowing price gains. Home prices and tech stocks also suggest that bubbles can exist for years even after objective measures (e.g. P/E ratios or rent to buy ratios) show that markets are out of equilibrium.
It is anybody's guess when gold will correct, but it is very likely that it will be ugly when it does.

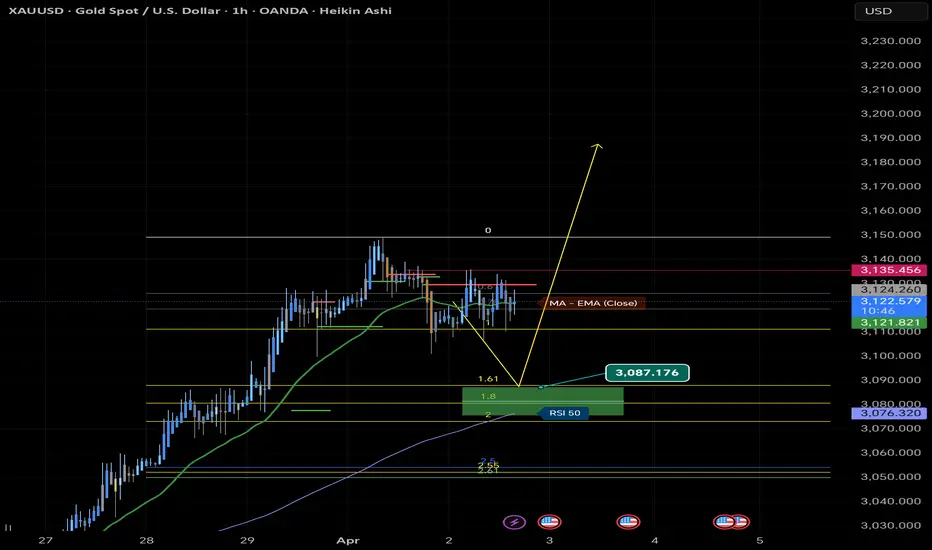
Gold (XAU/USD) Bullish Breakout: Next Target $3,181?"Key Observations:
Current Price: Gold is trading at $3,127.450 at the time of the chart.
Trend: The chart exhibits a strong uptrend, with higher highs and higher lows.
Support Levels: Several support levels are marked in the $3,010 - $2,999 range, extending down to around $2,906.
Resistance and Target:
The immediate price range is highlighted, suggesting possible consolidation.
A breakout above this range could lead to a target around $3,181.
Chart Annotations:
A retracement (red structure) indicates a short-term correction before continuation.
A breakout structure (black lines) suggests a previous significant upward movement.
The range and possible continuation are marked, indicating that the price may consolidate before attempting to reach the target.
Trading Perspective:
If price holds above the range, we may see bullish continuation towards $3,181.
A break below support levels could signal a deeper pullback towards $3,010 or lower.
This chart suggests a bullish outlook, with potential for more upside if momentum continues. Traders might look for confirmations before entering long positions.

A SELL OPPORTUNITY EMERGES ON XAUUSD A sell opportunity is envisaged from the current market price as gold bullish momentum slowed down ahead of US tariff report coming up later In the day. I anticipate a decline in price all the way to 3065.

Gold Market and the Impact of Trump’s Tariff PolicyAs global economic uncertainty intensifies and gold prices hit record highs, investors are seeking safe-haven assets. After several rounds of market turmoil, investors have recovered somewhat in Asian markets this week.
In the coming week, the focus will be on the reciprocal tariff plan that Trump will announce on April 2. If Trump decides to take tough measures and implement high tariffs across the board, it may have a big impact on the market. However, if there is some relaxation of tariff policies, such as tax exemptions for specific countries, then the market may have a chance to rebound.
Trump was proud of Wall Street's record highs during his first term, but now seems to be less concerned about the stock market and more focused on the adjustment of overall economic policies. I think this may be the time to make structural changes to the US economy, although these adjustments may bring challenges in the short term, but the hope is that the economy will recover before the mid-term elections next year.
In addition, Asian stock markets have also been affected by volatility, especially the automotive industries in Japan and South Korea are under pressure. The automotive manufacturing industries in these countries face the challenge of change due to the upcoming 25% tariffs. Investors are full of doubts about Trump's tariff policy, and market sentiment is cautious, and all parties are waiting for the policy announcement on April 2.
In conclusion, although the market has rebounded in the short term, future trends still need to focus on Trump’s tariff decisions and their potential impact on the global economy.

Gold bulls encounter resistance, high-level adjustmentsYesterday, the gold market showed an abnormal trend. The Asian and European sessions broke the routine and showed a clear weak pattern, showing the characteristics of a bear market of "fast decline without rebound". It is particularly noteworthy that despite the positive US manufacturing data released in the evening, gold has abnormally fallen into the dilemma of "good news but no rise", which is often an important signal of trend reversal. Today, the market focus is on the change in tariff expectations. If the expectations are significantly reduced, it will be the last straw that breaks the camel's back for bulls - the previous rise was largely based on tariff expectations.
Key technical nodes
Bull-bear watershed:
Key resistance above: 3124-3128 area (rebound high after testing 3100 yesterday)
Secondary resistance: 3135-3140 area (strong pressure zone)
Ultimate resistance: 3160-3165 (trend line extension)
Downward target:
First look at the breakthrough of 3100
Main target area: 3077-3057 (previous intensive trading area)
Deep correction may touch 3030-3000
Trading strategy recommendations
Main strategy: short on rebound
Ideal shorting area:
Preferred 3124-3128 range
Focus on 3135-3140 area for strong rebound
Consider 3160-3165 range in extreme cases
Stop loss setting :
10-8 dollars above each resistance zone
Strict stop loss after breaking through the previous high
Target position:
Phase 1: 3100 mark
Phase 2: 3077-3057
Phase 3: 3030-3000
Key points for auxiliary observation
The strength of the rebound in the Asian session will determine the timing of shorting in the European session
If the rebound is too large (exceeding 3140), it may turn into high-level fluctuations
Tariff-related news needs to be paid attention to in real time, which may cause violent fluctuations
Risk warning
If Trump suddenly announces the expansion of the tariff scope, short positions need to be closed immediately
If the US economic data continues to weaken, it may slow down the pace of decline
Geopolitical emergencies may temporarily boost risk aversion demand
The current market has shown signs of fatigue, and investors are advised to remain vigilant and seize possible opportunities for trend reversals. Strict risk control and flexible position adjustments will be the key to dealing with potential violent fluctuations. Remember: when the market begins to become numb to positive news, it often indicates that the trend is about to change.
