XAUUSD Channel Up intact and targeting the 1D MA50.Gold (XAUUSD) has been trading within a Channel Up since the October 30 2024 High and is currently on its latest technical Bearish Leg. The last pull-back tested the 1D MA50 (blue tend-line) before rebounding again.
As you can see the Low that this pull-back made was also on the 0.618 Fibonacci retracement level. On the current Bearish Leg, the 0.618 Fib is at 3155 and can make contact with the 1D MA50 within 1 week. That is our short-term Target, but depending on the Fed Rate Decision on Wednesday, it may be achieved earlier.
-------------------------------------------------------------------------------
** Please LIKE 👍, FOLLOW ✅, SHARE 🙌 and COMMENT ✍ if you enjoy this idea! Also share your ideas and charts in the comments section below! This is best way to keep it relevant, support us, keep the content here free and allow the idea to reach as many people as possible. **
-------------------------------------------------------------------------------
Disclosure: I am part of Trade Nation's Influencer program and receive a monthly fee for using their TradingView charts in my analysis.
💸💸💸💸💸💸
👇 👇 👇 👇 👇 👇
XAUUSD.P trade ideas

XAU / GOLD🌟 GOLD: THE BIGGEST TRADE OF SUMMER 2025
XAU/USD Forecast
📈 PHASE 1: SHORT-TERM RALLY (after small correction to 3172$)
We expect a bounce toward the $3,789–$3,800 resistance zone.
🔴 PHASE 2: THE SHAKEOUT
May 27 SELL ZONE.
After May 27, the cycle flips.
Expect a violent correction, retracing into key support around $2,880–$2,970 or even lower.
🟢 PHASE 3: THE BUY ZONE — July 13 +/- few days.
Mid-July marks the ideal long-term entry into TVC:GOLD before the explosive move.
🚀 PHASE 4: THE BREAKOUT
Target: ATH above $4,000 by late summer
Yes, EUROTLX:4K + gold is coming — but only after the market resets.

Gold/ Silver ratio - approaching a resistance pointRatio is overbought in favour of gold
Silver could start outperforming if the overhead resistance hold

5.6 Gold Market Analysis5.6 Gold Market Analysis
Gold prices rose slightly today and then entered a volatile trend. It is expected that the market will continue yesterday's trend and rise steadily.
After the gold price rises, we will wait for the high to pull back to around 3350 before going long. In the morning, the gold price encountered resistance at 3380, so technically this suppression can be used as a key reference for the future market. If it does not break 3380, there is still a risk of falling.
The rise in gold prices in the past two days, whether it is caused by news or the opening of the Asian session, we must maintain a steady rhythm.
Today's support level is 3330, and the resistance level is 3380. The strategy is to go long on the decline.
Thank you for your attention, and I hope my analysis can help you.

Gold Long Term RoadmapUsing multiple 'weight of evidence', Fibonacci, measured moves, support/resistance, distance from moving averages etc, this is what I consider to be the most likely outcome in the next few years.

Gold Buy Call #XAUUSDGold has broken out of a key resistance level at, $3,265 with strong bullish momentum and above-average volume, confirming the breakout. This move is supported by rising RSI and MACD crossover, indicating strength in the trend. The breakout from the consolidation zone signals renewed investor interest, likely driven by macro uncertainty and safe-haven demand.
Traders can consider initiating long positions at current levels with a stop-loss and take profit levels defined in the charts.

Gold rises strongly and bulls restart!At present, the support of the 4-hour cycle is around 3330. If there is a chance of a decline, you can follow the bullish trend. In terms of short-term gold operation ideas, it is recommended to do more on pullbacks and short on rebounds. The upper short-term focus is on the 3415-3420 line of resistance, and the lower short-term focus is on the 3330-3350 line of support. Friends must keep up with the rhythm. It is necessary to control the position and stop loss, set stop loss strictly, and do not resist single operations.

Scalping Trade – Technical Analysis on Gold (1-Minute Timeframe)
In this brief analysis, we examine a scalping opportunity on Gold (XAU/USD) using the 1-minute chart, focusing on a short-term technical setup supported by both price action and indicators.
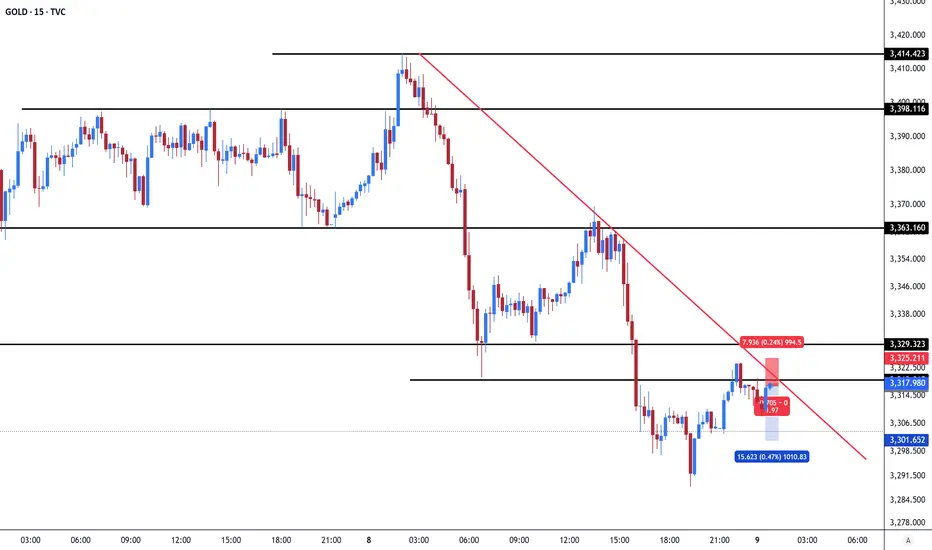
The chart displays a well-defined downward trend, confirmed by two descending red trendlines. These trendlines have been respected consistently by the price, indicating a strong bearish structure. At the time of analysis, the price action approached a key resistance zone around the 3,319 level.
This resistance is notable for two reasons: it represents a horizontal level tested multiple times, and it coincides with a descending trendline, forming a confluence that increases the probability of a price rejection. This dual-resistance scenario presents a compelling case for a short entry.
A sell position was initiated near this resistance area. The stop loss is placed above the resistance zone, near 3,325, to protect against a breakout. The take profit is set around 3,301, targeting a recent support level established by a strong previous low. This provides a clean technical target within the current structure.
Supporting this trade idea, both the MACD and Stochastic Oscillator are showing overbought signals and have begun turning downward, suggesting weakening bullish momentum and the potential for a bearish reversal.
The trade offers a risk-to-reward ratio of approximately 1:1.97, which is considered favorable in scalping strategies, where precision and timing are critical.
Gold (xauusd) a bullish momentum !hello guys
Let's analyze Gold!
Trend Overview:
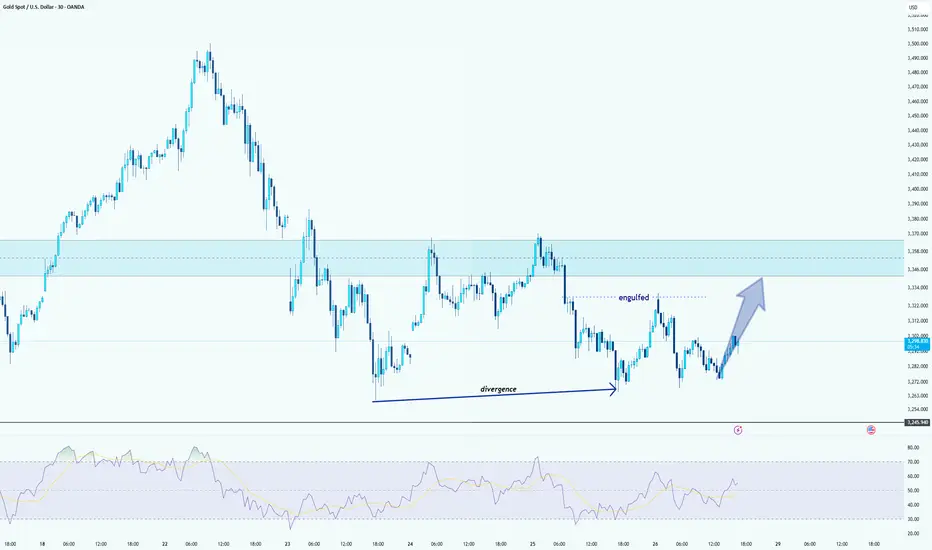
The market has been in a downtrend but has recently shown signs of potential reversal.
Key Observations:
Divergence Identified:
A bullish divergence is clearly spotted between the price action and the RSI indicator. While the price made lower lows, the RSI made higher lows, suggesting weakening selling pressure and a possible trend reversal.
Engulfing Pattern:
An important bullish engulfing pattern appeared around the support area, reinforcing the bullish reversal possibility.
Support and Resistance Zones:
The light blue shaded area represents a key resistance zone where price previously consolidated and sold off. This area will likely act as a strong resistance again upon retest.
Expected Movement:
Based on the bullish divergence and engulfing pattern, a move towards the resistance zone is anticipated, as illustrated by the upward arrow on the chart.
DeGRAM | GOLD Finished Correcting?📊 Technical Analysis
● After two successful touches of rising-channel support near $3 200, XAU/USD pierced the resistance line and the triangle, confirming a bullish breakout.
● A pattern of higher lows now projects a fresh impulse toward the channel top at ~$3 500.
💡 Fundamental Analysis
● Goldman Sachs forecasts central banks will keep buying bullion amid recession fears, driving gold to $3 700 by year-end.
● Traders price in ~80 bp of Fed rate cuts from July, lowering real yields and bolstering gold’s appeal.
✨ Summary
Channel breakout + strong CB demand and Fed-cut bets support a short-term long bias: a clear break above $3 315 targets $3 500; view invalid below $3 200.
-------------------
Share your opinion in the comments and support the idea with a like. Thanks for your support!

Hanzo | Gold 15 min Retest 3275 – Confirm the Next Bullish Move🆚 Gold – Hanzo’s Strike Setup
🔥 Timeframe: 15-Minute (15M)
——————
💯 Main Focus: Bullish Retest at 3275
We are watching this zone closely.
———
Analysis
👌 Market Signs (15M TF):
• Liquidity Grab + CHoCH at 3265
• Liquidity Grab + CHoCH at 3318
• Strong Rejections seen at:
➗ 3270 – Major support / Key level
➗ 3325 – Proven resistance
🩸 Key Zones to Watch:
• 3272 – 🔥 Bullish breakout level X 7 Swing Retest
• 3325 – Strong resistance (tested 5 times)
• 3270 – Equal lows
• 3328 – Equal highs
Hanzo | Gold 15 min Retest 3275 – Confirm the Next Bullish Move

Gold Bears Back in Control – Targeting 3270 AgainIn my analysis yesterday, I noted that after the false break above 3370 resistance, there was a high likelihood of a reversal, potentially driving Gold back down to the 3270 support zone.
Market Reaction:
• As expected, Gold turned lower after retesting the broken 3370 support, now acting as resistance.
• The price dropped nearly 1000 pips, which has become the new norm for daily Gold fluctuations lately.
W hat’s Next?
• With the current rebound, the 3370 zone should once again act as a barrier.
• The strategy remains to sell rallies, targeting a fresh test of the 3270 support zone.
Until this support is broken, expect very volatile moves, but the broader trend remains bearish
Disclosure: I am part of Trade Nation's Influencer program and receive a monthly fee for using their TradingView charts in my analyses and educational articles.

Your ULTIMATE Guide For Time Frames in Gold, Forex Trading
If you just started trading, you are probably wondering what time frames to trade. In the today's post, I will reveal the difference between mainstream time frames like daily, 4h, 1h, 15m.
Firstly, you should know that the selection of a time frame primarily depends on your goals in trading. If you are interested in swing trading strategies, of course, you should concentrate on higher time frames analysis while for scalping the main focus should be on lower time frames.
Daily time frame shows a bigger picture.
It can be applied for the analysis of a price action for the last weeks, months, and even years.
It reveals the historical key levels that can be relevant for swing traders, day traders and scalpers.
The patterns that are formed on a daily time frame may predict long-term movements.
In the picture above, you can see how the daily time frame can show the price action for the last years, months and weeks.
In contrast, hourly time frame reflects intra week & intraday perspectives.
The patterns and key levels that are spotted there, will be important for day traders and scalpers.
The setups that are spotted on an hourly time frame, will be useful for predicting the intraday moves and occasionally the moves within a trading week.
Take a look at the 2 charts above, the hourly time frame perfectly shows the market moves within a week and within a single day.
4H time frame is somewhere in between. For both swing trader and day trader, it may provide some useful confirmations.
4H t.f shows intra week and week to week perspectives.
Above, you can see how nicely 4H time frame shows the price action on EURUSD within a week and for the last several weeks.
15 minutes time frame is a scalping time frame.
The setups and levels that are spotted there can be used to predict the market moves within hours or within a trading session.
Check the charts above: 15 minutes time frame shows both the price action within a London session and the price action for the last couple of hours.
It is also critical to mention, that lower is the time frame, lower is the accuracy of the patterns and lower is the strength of key levels that are identified there. It makes higher time frame analysis more simple and reliable.
The thing is that higher is the time frame, more important it is for the market participants.
While lower time frames can help to predict short term moves, higher time frames are aimed for predicting long-term trends.
❤️Please, support my work with like, thank you!❤️
I am part of Trade Nation's Influencer program and receive a monthly fee for using their TradingView charts in my analysis.

XAU/USD Targeting $3,250Gold (XAU/USD) shows strong bullish momentum with $3,250 as the next key target. Watch for breakout confirmation.

#XAUUSD: Price to go beyond $3650 to $3700 around 3500 pips moveThe XAUUSD price is moving nicely as we had predicted in our previous analysis. Both of our analyses have hit the take-profit target, and we are likely to see more bullish momentum continue in the coming time. There are two areas where price could move or reverse. Both targets have a long-term view, which means we are talking about a possible swing move that will take time to complete. Stop-loss and intraday target and position can be taken based on your own analysis and overview. Strong fundamentals are needed for price to reach our designated target area.
Good luck and trade safely. Trading financial instruments like gold and other markets brings extreme risk and can be severe if the risk is not managed correctly.
We are sharing our bias here, but it does not guarantee that the move will happen as described.
Once the trade is activated, you can set two targets. You can choose your own take-profit based on your analysis and trade management.
Good luck and trade safely! 😊
Thanks a bunch for your unwavering support! ❤️🚀
If you’re feeling generous, here are a few ways you can help us out:
- Like our ideas
- Comment on our ideas
- Share our ideas
Cheers,
Team Setupsfx_
❤️🚀
GOLD - FVG-Based Long & Short Setup Within Range ContextPrice action remains range-bound with well-defined FVG zones acting as both support and resistance, offering reactive trading opportunities on both sides.
---
1. Upper FVG as Resistance — Short Setup Trigger Zone
The highlighted upper green zone marks:
- Fair Value Gap (FVG): A clear inefficiency from the previous bearish impulse.
- Structural Significance: Price has struggled to break and hold above, showing signs of supply reactivation.
This zone is likely to attract sellers upon revisit, offering a clean risk-defined short opportunity.
---
2. Lower FVG as Support — Long Setup Zone
The lower blue zone serves as:
- FVG Rebalance Area: A region where price previously left inefficiency, now acting as strong support.
- Accumulation Interest: Smart money often reloads in such imbalanced areas on retests.
This zone is optimal for positioning into the next bullish leg should price dip lower.
---
3. Liquidity Sweep Mechanics — Trap Both Sides
The market structure hints at:
- Step 1: Induce buyers into breakout longs into resistance.
- Step 2: Reverse from FVG, triggering short entries and trapping longs.
- Step 3: Collect liquidity from lower range, potentially initiating new accumulation.
This movement pattern is characteristic of engineered liquidity grabs in both directions.
---
4. Mid-Range Reaction — Key Pivot Area
Price currently hovers around the mid-range zone:
- Serving as a temporary balance point before volatility expansion.
- Acting as a launchpad for the next impulsive move, depending on order flow dominance.
Patience here is key — waiting for clean confirmations near FVGs provides optimal entry quality.
---
5. Summary:
- Upper FVG Resistance → Short Bias
- Lower FVG Support → Long Bias
- Structured Reactions Around Imbalances Suggest Smart Money Activity
This is a dual-sided setup ideal for reaction-based traders awaiting price confirmation at extremes.

Falling towards pullback support?The Gold (XAU/USD) is falling towards the pivot and could bounce to he 1st resistance which has been identified as a pullback resistance.
Pivot: 3,361.29
1st Support: 3,310.00
1st Resistance: 3,490.34
Risk Warning:
Trading Forex and CFDs carries a high level of risk to your capital and you should only trade with money you can afford to lose. Trading Forex and CFDs may not be suitable for all investors, so please ensure that you fully understand the risks involved and seek independent advice if necessary.
Disclaimer:
The above opinions given constitute general market commentary, and do not constitute the opinion or advice of IC Markets or any form of personal or investment advice.
Any opinions, news, research, analyses, prices, other information, or links to third-party sites contained on this website are provided on an "as-is" basis, are intended only to be informative, is not an advice nor a recommendation, nor research, or a record of our trading prices, or an offer of, or solicitation for a transaction in any financial instrument and thus should not be treated as such. The information provided does not involve any specific investment objectives, financial situation and needs of any specific person who may receive it. Please be aware, that past performance is not a reliable indicator of future performance and/or results. Past Performance or Forward-looking scenarios based upon the reasonable beliefs of the third-party provider are not a guarantee of future performance. Actual results may differ materially from those anticipated in forward-looking or past performance statements. IC Markets makes no representation or warranty and assumes no liability as to the accuracy or completeness of the information provided, nor any loss arising from any investment based on a recommendation, forecast or any information supplied by any third-party.

Gold price weakens, correction 3176⭐️GOLDEN INFORMATION:
Gold’s intraday decline appears partly driven by technical selling pressure after decisively breaking below the key $3,265–$3,260 support zone. However, the US Dollar (USD) struggles to sustain any significant recovery as expectations grow for more aggressive Federal Reserve (Fed) rate cuts—fueled by an unexpected contraction in US GDP and signs of softening inflation. These factors may continue to support demand for the non-yielding precious metal, suggesting that traders should remain cautious before anticipating a deeper pullback from the recent all-time high near $3,500.
⭐️Personal comments NOVA:
Crossing the 3264 mark in the sideways price zone, gold prices continue to weaken.
⭐️SET UP GOLD PRICE:
🔥SELL GOLD zone : 3270- 3272 SL 3277
TP1: $3260
TP2: $3250
TP3: $3240
🔥BUY GOLD zone: $3178 - $3176 SL $3171
TP1: $3185
TP2: $3200
TP3: $3210
⭐️Technical analysis:
Based on technical indicators EMA 34, EMA89 and support resistance areas to set up a reasonable SELL order.
⭐️NOTE:
Note: Nova wishes traders to manage their capital well
- take the number of lots that match your capital
- Takeprofit equal to 4-6% of capital account
- Stoplose equal to 2-3% of capital account
3419 , gold price can reach today⭐️GOLDEN INFORMATION:
Gold price (XAU/USD) pulls back slightly from its intraday peak near a two-week high reached during Tuesday’s Asian session, but remains firm around the $3,360 mark, extending its winning streak for a second day. Improved US economic data has helped temper recession fears, offering modest support to the US Dollar. Meanwhile, signs of a potential thaw in US-China trade tensions have curbed safe-haven demand for gold, prompting some investors to adopt a wait-and-see approach ahead of the highly anticipated two-day FOMC policy meeting.
⭐️Personal comments NOVA:
Bulls regain the upper hand, uptrend nears 3400 ahead of market interest rate cut expectations
⭐️SET UP GOLD PRICE:
🔥SELL GOLD zone : 3418- 3420 SL 3425
TP1: $3410
TP2: $3400
TP3: $3385
🔥BUY GOLD zone: $3323 - $3321 SL $3316
TP1: $3330
TP2: $3340
TP3: $3358
⭐️Technical analysis:
Based on technical indicators EMA 34, EMA89 and support resistance areas to set up a reasonable BUY order.
⭐️NOTE:
Note: Nova wishes traders to manage their capital well
- take the number of lots that match your capital
- Takeprofit equal to 4-6% of capital account
- Stoplose equal to 2-3% of capital account

Gold Trade Plan 06/05/2025Dear Traders,
price broken 3320 (Means Market will continue Upward movement)
i expect price will be continue upward movement to 3400-3420 Area Today ,
If you enjoyed this forecast, please show your support with a like and comment. Your feedback is what drives me to keep creating valuable content."
Regards,
Alireza

GOLD 4H CHART ROUTE MAP UPDATEHey Everyone,
Please see update on our 4h chart route map today after 2 days of smashing targets on the 1h chart idea.
Once again another great day on the markets today. We got our Bearish 3282 and our Bullish 3343 targets hit. No cross and lock on either level, so we are seeing tennis between both Goldturns.
We will look for a ema5 cross and lock on either level to determine the next move. We will see levels tested side by side until one of the weighted levels break and lock to confirm direction for the next range.
We will keep the above in mind when taking buys from dips. Our updated levels and weighted levels will allow us to track the movement down and then catch bounces up.
We will continue to buy dips using our support levels taking 30 to 40 pips. As stated before each of our level structures give 20 to 40 pip bounces, which is enough for a nice entry and exit. If you back test the levels we shared every week for the past 24 months, you can see how effectively they were used to trade with or against short/mid term swings and trends.
BULLISH TARGET
3343 - DONE
EMA5 CROSS AND LOCK ABOVE 3343 WILL OPEN THE FOLLOWING BULLISH TARGET
3404
EMA5 CROSS AND LOCK ABOVE 3404 WILL OPEN THE FOLLOWING BULLISH TARGET
3439
EMA5 CROSS AND LOCK ABOVE 3439 WILL OPEN THE FOLLOWING BULLISH TARGET
3503
BEARISH TARGETS
3282 - DONE
EMA5 CROSS AND LOCK BELOW 3282 WILL OPEN THE FOLLOWING BEARISH TARGET
3224
EMA5 CROSS AND LOCK BELOW 3224 WILL OPEN THE SWING RANGE
SWING RANGE
3190 - 3138
EMA5 CROSS AND LOCK BELOW 3138 WILL OPEN THE SECONDARY SWING RANGE
SECONDARY SWING RANGE
3088 - 3046
As always, we will keep you all updated with regular updates throughout the week and how we manage the active ideas and setups. Thank you all for your likes, comments and follows, we really appreciate it!
Mr Gold
GoldViewFX

Gold's volatile decline is in line with expectationsFrom the perspective of the 4-hour cycle, a big negative line closed down, breaking the support of the 5-day and 10-day moving averages. This wave may continue to fall to the Bollinger middle rail near 3300, but if it is a high-level shock, the Bollinger middle rail is not broken, and it may rise again to the high point of 3430. In this cycle, gold has experienced a big rise and fall, and now it is possible to rise or fall. In the short-term cycle, we will first pay attention to the support effect of 3360-3350 under weakness. If it does not break, we can continue to go long and bullish, with the upper target at 3400. On the whole, the short-term operation strategy of gold is recommended to be mainly short-selling on rebounds, supplemented by long-selling on pullbacks. The upper short-term focus is on the 3400-3405 line of resistance, and the lower short-term focus is on the 3350-3300 line of support.

XAUMO XAUUSD Tactical Breakdown – April 30, 2025
1. XAUMO Tactical Map
Red Zone – Bearish Rejection (Sell Trap Zone):
Upper Limit: 3314.60–3318.00
Strong historical rejection + VWAP & Ichimoku base rejections.
Yellow Zone – Liquidity Sweep Trap Area:
Zone: 3297.50–3306.00
Price bounced repeatedly from this sweep zone; stop hunts likely.
Green Zone – Bullish Activation (Breakout):
Break Level: 3318.50+
Clean air above with strong upside potential to 3330+
2. Market Structure Overview
Ichimoku Cloud: Bearish crossover confirmed, price below cloud.
Volume Spike (RVOL): Reaching 1.93 on final leg = heavy sell interest.
Price Action: Lower highs forming. Current candle series weak.
VWAP Rejections: Ongoing rejection at 3305–3310.
Momentum: Bearish, confirmed by RSI < 45 on M15 & M30.
3. Tactical Entry Setups (Live Ready)
A. Intraday Sell Setup – Trap Breakdown
Type of Entry: Sell Stop
Entry Price: 3280.00
SL: 3287.00
TP1: 3270.50
TP2: 3259.00
TP3: 3246.00
Confidence: 82%
Justification:
Break below key liquidity shelf w/ heavy volume + trend confirmation from Ichimoku + RVOL surge.
B. Breakout Reversal Long Setup
Type of Entry: Buy Stop
Entry Price: 3318.50
SL: 3310.00
TP1: 3326.50
TP2: 3334.00
TP3: 3341.00
Confidence: 71%
Justification:
Break above compression + rejection cluster. Cloud flip + volume confirmation required.
C. Mean Reversion Scalp Play
Type of Entry: Sell Limit
Entry Price: 3305.00
SL: 3309.50
TP1: 3298.00
TP2: 3292.00
Confidence: 75%
Justification:
Previous VWAP + red zone overlap. Perfect trap zone confluence with divergence across M5.
4. STRIKE | DEFEND | SCALP | SWING
STRIKE:
15:30 Cairo → Enter Sell Stop @ 3280 if NY Open flushes.
3318.50 breakout long only if volume sustains.
DEFEND:
Stay out of chop 3298–3305 unless confirmed wick fakeout.
SCALP:
Inside Yellow Zone: scalp wick traps at 3304–3305 or 3288–3290.
SWING:
If price holds below 3280 post-NY, swing short down to 3259+ over 1–2 sessions.
5. Summary
Market still biased Bearish unless 3318.50+ breaks.
Volume + structure + Ichimoku confirms ongoing downside with brief retrace attempts.
NY Open = trigger window for explosive move.
