XAUUSD.P trade ideas

GOLD at its peak, Trump and Powell in focusSpot OANDA:XAUUSD surged, with gold just hitting a new record high of $3,384.62 an ounce. Gold is now up more than $60 on the day. Trump's comments and the Powell "conspiracy" have combined to trigger market activity.
Earlier, US President Donald Trump released his insights into the negotiations on his social media platform Truth Social, saying that "the golden rule of negotiation and success is that he who has the gold makes the rules," meaning he who has the gold will have the upper hand. This post on gold is quite interesting, considering the market volatility caused by Trump's previous comments on stocks on social media.
Gold prices have surged to a record high as the U.S.-led trade war fuels safe-haven demand and the dollar weakens, Bloomberg reported, and data in the coming days could highlight early signs of damage to the global economy.
The International Monetary Fund is expected to cut its economic growth forecast on Tuesday, while the Purchasing Managers’ Index (PMI) the following day will provide a snapshot of economic activity since U.S. President Donald Trump imposed tariffs.
Gold prices have hit record highs this year as trade conflicts have roiled global markets, denting demand for riskier assets while spurring a rush to safe havens among investors.
Gold ETF holdings have risen for a 12-week streak, the longest such streak since 2022. Central banks have also increased their holdings of gold, supporting strong global demand.
Bloomberg notes that the sell-off in the US dollar intensified on Monday as US President Trump weighs whether to fire Federal Reserve Chairman Jerome Powell.
Powell's possible removal could undermine investor confidence as the Fed's independence is seen as a key factor in investing in US assets. However, given that Trump has previously said he welcomes a weaker currency because it makes US products more competitive, he may welcome a weaker US dollar.
Technical Outlook Analysis OANDA:XAUUSD
On the technical chart, the short correction last Friday ended quickly as gold continued to rise along the short-term price channel.
The increase broke the 0.618% Fibonacci extension, giving gold the conditions to continue to rise with the target of the 3,400 USD price point in the short term, more than the 3,420 USD price point of the 0.786% Fibonacci extension.
It is difficult to expect a significant correction in the current context, but the RSI down through 80 can be considered a good signal for the expectation of a short-term correction.
However, with the current position, the main technical outlook for gold is still bullish with notable positions listed as follows.
Support: 3,372 – 3,357 USD
Resistance: 3,400 – 3,420 USD
SELL XAUUSD PRICE 3414 - 3412⚡️
↠↠ Stop Loss 3418
→Take Profit 1 3406
↨
→Take Profit 2 3400
BUY XAUUSD PRICE 3316 - 3318⚡️
↠↠ Stop Loss 3312
→Take Profit 1 3324
↨
→Take Profit 2 3330

XAUUSD FALLING WEDGE PATTERNI Created This XAUUSD Chart Analysis In 30-M Tf
Entry: BUY from 3315
Support zone : 3312
Target Will Be : 3355
OANDA:XAUUSD made Falling wedge Pattern, It went to Uptrend, Let me know your thoughts in comments section

GOLD-SELL strategy 6 Hourly chart regression channelGOLD has moved up sharply but it is. again above the channel, and this usually will not last. It needs to correct back towards mid-channel over time.
The RSI is very overbought, but other indicators how still some upward pressure, however, I use the channel as my guidance for now.
Strategy SELL or ADD SELL @ $ 3,375-3,415 and take profit near $ 3,257 for now partially and further down rest @ $ 3,079.

GOLD will take a break hereEntering short after this massive rally.
SL and final TP on the chart.
First target around 3250.
Will be updating


GoldXAUUSD
- Completed " 12345 " Impulsive Waves
- Break of Structure
- RSI - Divergence
- Bullish Channel as an corrective pattern in Short Time Frame
- Change of Characteristics

Gold continues to surge to new highs!Gold technical analysis: Today, the gold price continues to rise strongly. It has risen all the way to more than 80 US dollars. So can it continue to rise? From the long-term chart, the bulls have not changed. Long is definitely the main idea. But you must pay attention to the risks in the short term. Because the increase from 2958 to the present has exceeded more than 340 US dollars. And today's single-day increase is as much as 70 US dollars. So you still need to pay attention to the risks that should be paid attention to in the short term. But don't guess the top too often. Even if you want to guess the top, you must have risk control. You can't trade based on your own sensory thinking.
It has risen sharply from the high point of 3230 yesterday, and has risen nearly 80 points from the low point. It is also trending to hit a new high. Once it breaks the high again, it will continue to hit the 3330-50 line. The next big target of the weekly pattern and segmentation cycle is 3400. It will probably reach it after a few waves of pull-ups. The weekly line rose last week and needs to rise this week. The current focus is still on falling back or breaking through and following the long position.
The current support below can refer to the afternoon low of 3280, which can also be used as an important reference for European trading. The key watershed below may be at the previous top and bottom conversion point of 3245, while the upper pressure is focused on 3330-3350. Overall, today's short-term operation strategy for gold is to focus on long positions on pullbacks and short positions on rebounds. The upper short-term focus is on the 3330-3350 resistance line, and the lower short-term focus is on the 3275-3280 support line.
Short order strategy:
Strategy 1: When gold rebounds around 3330-3333, short (buy short) 20% of the position in batches, stop loss 6 points, target around 3305-3290, break to 3280
Long order strategy:
Strategy 2: When gold falls back to around 3275-3280, buy long positions in batches (buy up) with 20% of the position, stop loss 6 points, target around 3310-3330, break the position and look at 3350

Still a strong bullish momentum for gold - will continue to rise🔔🔔🔔Gold news:
➡️ After a brief pullback on Friday due to pre-Easter profit-taking, gold buyers stormed back into the market early Monday. The precious metal resumed its record-breaking rally, eyeing the $3,400 mark as the US Dollar (USD) plunged to a three-year low against major currencies, driven by growing recession fears in the US amid escalating US-China trade tensions.
➡️ The trade conflict intensified over the weekend when a Boeing jet, initially intended for a Chinese airline, was redirected back to the US manufacturer’s plant in a retaliatory move by China.
Personal view:
➡️ The weaker US Dollar and rising safe-haven demand continue to support gold’s traditional role as a safe-haven asset. However, price swings could be exaggerated in the coming day due to thin liquidity from Easter Monday.
➡️ The RSI remains in overbought territory on the daily chart, and light trading volumes may amplify gold’s price moves.
➡️ Analysis based on important resistance - support and Fibonacci levels combined with trend lines to come up with suitable strategies
Plan:
🔆Price Zone Setup:
👉Sell Gold 3400 - 3398 (Scalping)
❌SL: 3404| ✅TP: 3394 – 3390-3385
👉Sell Gold 3422 - 3424
❌SL: 3429 | ✅TP: 3417 – 3412 -3407
👉Buy Gold 3356 - 3358
❌SL: 3350| ✅TP: 3363 – 3370-3380
FM wishes you a successful trading day 💰💰💰

GOLD Weekly Outlook | Bullish Bias Remains StrongGold (XAU/USD) continues its powerful rally, printing two consecutive bullish weekly candles that reflect increasing momentum and strong buying pressure. The most recent weekly candle opened at 3229.79, dipped slightly to 3193.60, then surged to a high of 3357.67, and finally closed strong at 3327.46—just a few points off the high.
The week prior also closed bullish at 3167.72, (closed well above the open of 3034.91 with significant range).
XAUUSD Weekly timeframe
✅ Weekly Bias: Strongly Bullish
We’re clearly in a higher high, higher low structure on the weekly timeframe, and there's been no sign of exhaustion yet. Last week's candle had a small bottom wick and a large body, showing that bulls dominated from open to close.
🔑 Key Zones to Watch:
Support:
🔹 3320–3211
Resistance / Targets:
🔹 3375
🔹 3400–3420 → Psychological and potential profit-taking area
📌 Trade Idea:
I’ll be watching for bullish setups on a pullback into the 3311–3320 zone. If Gold retests this area and forms bullish price action (e.g., bullish engulfing or rejection wicks on 1H or 4H), I’ll consider long entries.
🎯 TP1: 3370–3380
🎯 TP2: 3400–3420
🛑 SL: Below 3283-3298 (structure invalidation)
📣 Final Thoughts:
Gold continues to be a beast, driven by a mix of macroeconomic uncertainty, central bank accumulation, and safe haven flows. As long as the structure remains intact, dips are for buying.
Let me know in the comments—are you bullish on Gold this coming week? Or do you see a reversal coming soon?

Gold Hits New Highs as US-China Tensions Escalate 📌 Gold Outlook: US-China Trade Tensions Fuel New Bullish Wave Amid Policy Uncertainty 🧨📈
🌍 Geopolitical Drivers Taking the Lead
On April 15th, President Donald Trump ordered an investigation into potential tariffs on all critical minerals imported into the U.S. – a move seen as the latest escalation in his ongoing economic confrontation with global trade partners, most notably China.
This development has shaken overall market sentiment, prompting investors to rotate into safe-haven assets like gold, which has surged in response.
At the same time, the U.S. Dollar weakened sharply, nearing 3-year lows last week, further increasing gold’s appeal for holders of other currencies.
🏦 Central Bank Uncertainty Adds Fuel to the Fire
Fed Chairman Jerome Powell stated that the central bank would not intervene to “rescue” markets during turbulent periods, suggesting that volatility may persist as hedge funds unwind leverage and global investors remain cautious.
He emphasized that the current volatility may be driven by shifting trade policies and broader uncertainty — which he said is “too early to fully diagnose.”
With central banks showing no immediate intent to inject liquidity or cut rates, the bullish case for gold remains strong in the coming weeks.
📊 Technical Outlook: New Highs in Sight, But Volatility Will Be Sharp
Gold continues to print new ATHs, and the dominant strategy right now is to trade with the trend — which clearly remains bullish. In such an environment, sudden drops are normal and not necessarily tied to any single news event.
Rather than attempting to short the market near highs, we are focusing on catching bullish continuation setups after sharp intraday corrections. These will likely form at support zones or classic continuation patterns on M15/M30 timeframes.
🔍 Price Levels to Watch
🟢 Support Zones:
3314 – 3300 – 3284 – 3266
🔴 Psychological Resistance:
3380 – 3396 – 3410
💼 Trade Plan
BUY ZONE:
Entry: 3300 – 3298
SL: 3264
TP Targets: 3304 → 3308 → 3312 → 3316 → 3320 → 3324 → 3330 → higher
SELL ZONE (Psychological Reaction Only):
Entry: 3396 – 3398
SL: 3402
TP Targets: 3392 → 3388 → 3384 → 3380 → 3376 → 3370
⚠️ Final Thoughts
We remain firmly buy-biased, especially as gold continues to be driven by macro and political catalysts. Pullbacks should be welcomed — not feared — and seen as opportunities to scale into longs at structure.
While intraday drops may appear sharp and sudden, they often lack fundamental backing and provide the best entry conditions for continuation traders. Be cautious with shorts — unless reacting to extended psychological resistance zones.
Always trade with a clear plan and never forget to honor your TP/SL levels to safeguard your capital.
💬 How are you navigating gold during this surge in global tension? Are you buying dips or waiting for a deeper correction? Let us know below! 👇👇👇

Trump Considers Firing Federal Reserve Chairman Jerome PowellTrump's Consideration to Fire Fed Chair Powell Sends Shockwaves Through Financial World 😲
Multiple sources reveal that Trump is exploring the possibility of firing Fed Chair Jerome Powell, sparking wide speculation 🤔. The two have long disagreed on monetary policy. Trump
repeatedly criticized Powell on social media, demanding immediate rate cuts ⬇️, while Powell emphasized the need to assess economic impacts before adjusting rates 📊.
Trump favors former Fed governor Kevin Warsh as a replacement, but Warsh advises against the firing 🚫. Legally, there’s no clear precedent for the president firing a Fed chair mid - term. Powell insists on Fed independence, stating that policy should be data - driven, not politically influenced 💼.
The White House is split on this issue. Treasury Secretary Mnuchin opposes the move, seeing Fed independence as crucial ⭐, while some advisors challenge Powell. This power struggle adds significant uncertainty to US and global financial markets 🌍, with the outcome set to reshape US economic policies ⚖️.
We will keep a close eye on this news.
Traders, if you're fond of this perspective or have your own insights regarding it, feel free to share in the comments. I'm really looking forward to reading your thoughts! 🤗
👇The accuracy rate of our daily signals has remained above 98% within a month! 📈 We sincerely welcome you to join our channel and share in the success with us! 🌟

GOLD holds above 3,400, heading towards 3,500As the US Dollar OANDA:XAUUSD weakened and Sino-US trade tensions raised market concerns about the economic outlook, investor risk aversion increased, pushing gold prices to a record high, breaking through the $3,400/ounce mark and maintaining price action above this level, continuing to target a new all-time high of $3,500.
The US Dollar fell sharply during the day as US President Donald Trump made critical remarks about Federal Reserve Chairman Jerome Powell, further undermining market confidence in the US economy. A weaker US Dollar typically makes US Dollar-denominated gold more attractive to holders of other currencies.
On trade, China accused the United States of abusing the tariff tool and warned other countries not to reach broader economic and trade agreements with the United States at the expense of their own interests. Gold, long seen as a hedge against uncertainty and a highly liquid asset, has risen more than $700 since the start of 2025. Gold broke through $3,300 for the first time last Wednesday and the surge has pushed prices above $100 again in just a few days.
Trump is considering removing Fed Chairman Powell and has repeatedly called for interest rate cuts. Chicago Fed President Goolsbee has spoken out publicly against undermining the independence of the central bank.
Trump also made some shocking statements. Trump shared his thoughts on the negotiations on his social media platform Truth Social, saying, "The golden rule of negotiation and success: he who has the gold makes the rules," meaning he who has the gold rules.
This post about gold is quite interesting, considering the market volatility caused by Trump's previous comments on stocks on social media.
Trump also said, "Businessmen who criticize Tariffs are bad at business, but they are really bad at politics. They don't understand or realize that I am the best friend American Capitalism has ever had!"
Technical Outlook Analysis OANDA:XAUUSD
On the daily chart, gold continues to hold above the $3,400 base point and the 0.786% Fibonacci extension level, which is a positive factor for the gold price's bullish outlook. On the other hand, the Relative Strength Index (RSI) is operating in the overbought zone but is not sending any signals indicating a possible downside correction, a sign indicating a possible downside correction is the RSI heading below 80.
In terms of current position, gold still has a bullish outlook in the short term with the price channel as the trend and maintaining activity above the 0.786% Fibonacci extension level provides conditions for gold to aim for a new bullish target at $3,482 in the short term, more than the raw price point of $3,500.
During the day, the short-term bullish outlook of gold will be focused again by the following positions.
Support: $3,420 – $3,400
Resistance: $3,482 – $3,500
SELL XAUUSD PRICE 3517 - 3515⚡️
↠↠ Stop Loss 3521
→Take Profit 1 3509
↨
→Take Profit 2 3503
BUY XAUUSD PRICE 3448 - 3450⚡️
↠↠ Stop Loss 3444
→Take Profit 1 3456
↨
→Take Profit 2 3462

The gold bull surge has not yet reached its peak!Gold has increased by $100 today, reaching a high of $3,430. It continues to fluctuate at a high level and shows no signs of peaking. The 4-hour trend fell slightly and then continued to rise. The main impact on gold is the tariff issue. As long as the tariff issue is not resolved, gold will be difficult to adjust. Therefore, I suggest that short-term operation ideas should be mainly long on pullbacks and short on rebounds. Focus on the 3430-3435 resistance line on the top and 3357-3370 on the bottom.

GOLD: The Market Is Looking Down! Short!
My dear friends,
Today we will analyse GOLD together☺️
The market is at an inflection zone and price has now reached an area around 3,422.40 where previous reversals or breakouts have occurred.And a price reaction that we are seeing on multiple timeframes here could signal the next move down so we can enter on confirmation, and target the next key level of 3,375.96..Stop-loss is recommended beyond the inflection zone.
❤️Sending you lots of Love and Hugs❤️

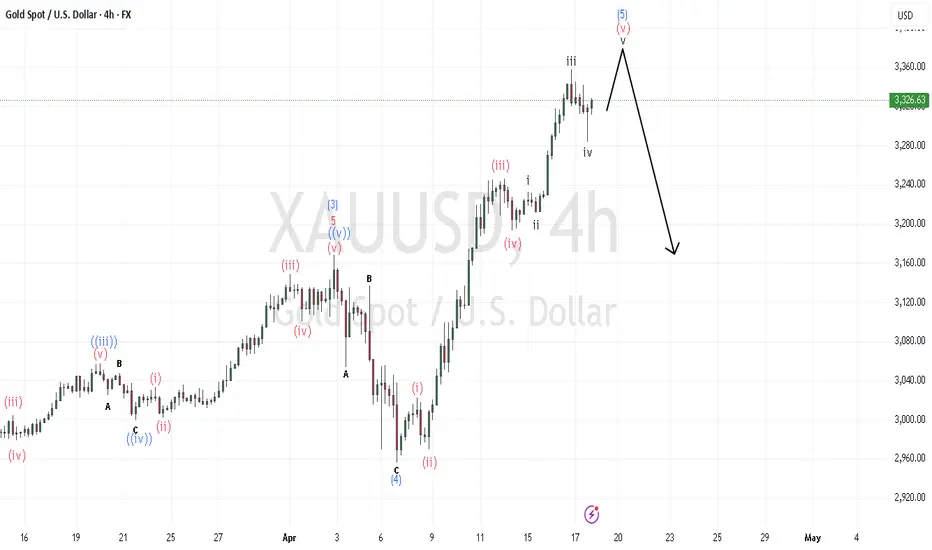
XAU/USD Wave Count UpdatePrice climb from the low of 7th April is close to an ending for 5 waves and soon will be making pullback.
Gold rose strongly!Judging from the market now, after the gold price broke through the 3402 position, it is now very likely to move closer to the 3447 position. However, given that it has already risen by 100 points today, we can do a short sell near 3428 to see if there is a pullback (conservative friends can ignore this short order and wait patiently for a pullback) to see if the gold price can return to 3402 or 3408 before entering into a bullish long order.

Technical Analysis – Gold (XAU/USD) – Weekly Chart 3500$📉 Technical Analysis – Gold (XAU/USD) – Weekly Chart
🔹 Price Action & Structure
Current Price: ~$3,420
Gold has been on a strong bullish rally, breaking previous highs and trending upwards in a steep channel.
The chart shows a long-term ascending parallel channel, with price currently nearing the upper half.
There's a crucial breakout zone marked around $3,500 – a psychological and technical resistance level.
🔹 Key Levels
Immediate Resistance: $3,500 – if a weekly candle closes above, it opens up bullish continuation.
Next Target (TP): $4,083 – based on the breakout projection and mid-channel resistance.
Further TP: $5,031 – top of the channel (longer-term target).
Support Zone: $2,750 – highlighted in blue, a strong demand zone with past accumulation and breakout area.
🔹 Technical Indicators to Watch (not visible but implied):
Fibonacci Levels: The $3,500 zone could align with a major fib extension (likely 1.618 from previous swing).
RSI: Likely in overbought territory on the weekly, hinting at possible short-term exhaustion or retracement.
MACD: Likely showing strong momentum, but a bearish crossover on higher timeframe would confirm a pullback.
Volume Profile: (not shown) could confirm if accumulation is happening above $3,500.
🔹 Potential Scenarios
Bullish Breakout: If price closes above $3,500 and holds, a rally toward $4,083 is likely.
Fakeout & Rejection: If price gets rejected from $3,500 zone, we may see a pullback toward $2,750 for reaccumulation.
Profit Booking: After reaching $4,000+, profit booking could cause consolidation or a deeper correction.
🌐 Fundamental Analysis – Gold Outlook
🏦 Macro Drivers
Global Inflation: Persistent inflation has historically driven gold demand as a hedge.
Interest Rates: Expectations of rate cuts by the Fed or other central banks in 2025 would favor gold prices.
Geopolitical Risk: Ongoing global tensions (Middle East, Eastern Europe, etc.) tend to increase safe haven demand.
Currency Weakness: A weakening USD supports gold, as it's priced in dollars.
💹 Investor Sentiment
Central banks are increasing gold reserves (China, Russia, etc.).
Demand for physical gold is high, especially from BRICS nations as they explore de-dollarization.
📉 Risk Factors
Sudden hawkish stance by central banks could pressure gold.
If inflation cools faster than expected, gold might see reduced interest as a hedge.
Overbought technical could trigger short-term corrections.
✅ Conclusion
Gold is currently in a strong bullish trend, testing a major resistance. A weekly close above $3,500 can push it to $4,083 and potentially $5,031 in the long term. However, retracement is likely if it fails to sustain above this level, with $2,750 acting as a key support zone.
“Watch price action at $3,500 carefully — the breakout or rejection here could define the next 6–12 months of gold's direction.”

XAU / USD 1 Hour ChartHello traders. Happy Thursday. Looking at the hourly chart I have marked my area to watch for potential scalp buy / sell trade set ups. Looking to see if support holds / forms for a push back up, otherwise I would wait for a signifcant push down for a good entry either this week or next week. Tomorrow is Good Friday and all the U.S. markets are closed. Let's see how this morning plays out. Be well and trade the trend. Shout out to Big G.

Gold Will be Bullish from a Historic Support LevelHello Traders
In This Chart GOLD HOURLY Forex Forecast By FOREX PLANET
today Gold analysis 👆
🟢This Chart includes_ (GOLD market update)
🟢What is The Next Opportunity on GOLD Market
🟢how to Enter to the Valid Entry With Assurance Profit
This CHART is For Trader's that Want to Improve Their Technical Analysis Skills and Their Trading By Understanding How To Analyze The Market Using Multiple Timeframes and Understanding The Bigger Picture on the Charts

Let us wait together for gold to break 3200
In terms of operation, short selling is still the main strategy, and short selling is still maintained near 3235. It is expected that gold will continue to adjust in the future, and 3200 will most likely be broken today.
Today's detailed operation strategy
Gold will go long at 3185, defend at 3175, and target 3200-3220
Gold will go short at 3235, defend at 3245, and target 3210-3180
Hello traders, if you have better ideas and suggestions, welcome to leave a message below, I will be very happy

XAU / USD 4 Hour ChartHello traders. I have marked my area of interest on the chart. I am not trading today. The U.S. markets are closed today to honor Jesus, who was killed for mankind's sin today. I will post next week and BIg G gets my thanks. Happy Friday. Be well and trade the trend.

GOLD: Will Go Down! Short!
My dear friends,
Today we will analyse GOLD together☺️
The in-trend continuation seems likely as the current long-term trend appears to be strong, and price is holding below a key level of 3,311.72 So a bearish continuation seems plausible, targeting the next low. We should enter on confirmation, and place a stop-loss beyond the recent swing level.
❤️Sending you lots of Love and Hugs❤️