GOLD - Price can make correction and then continue to growHi guys, this is my overview for XAUUSD, feel free to check it and write your feedback in comments👊
Price broke out from the lower wedge line and started climbing with confidence, building momentum step by step.
After bouncing off the $3215 zone, it pushed higher and touched the wedge resistance without major rejection.
The current candle formation shows signs of slowing down, hinting at a possible short-term pullback ahead.
Despite that, the structure remains bullish, and buyers are likely to defend local support if the price dips slightly.
With the breakout zones holding firm, I expect Gold to make a correction and then resume the upward path.
My target is set at $3500, where the upper wedge boundary might once again act as key resistance.
If this post is useful to you, you can support me with like/boost and advice in comments❤️
XAUUSD.P trade ideas

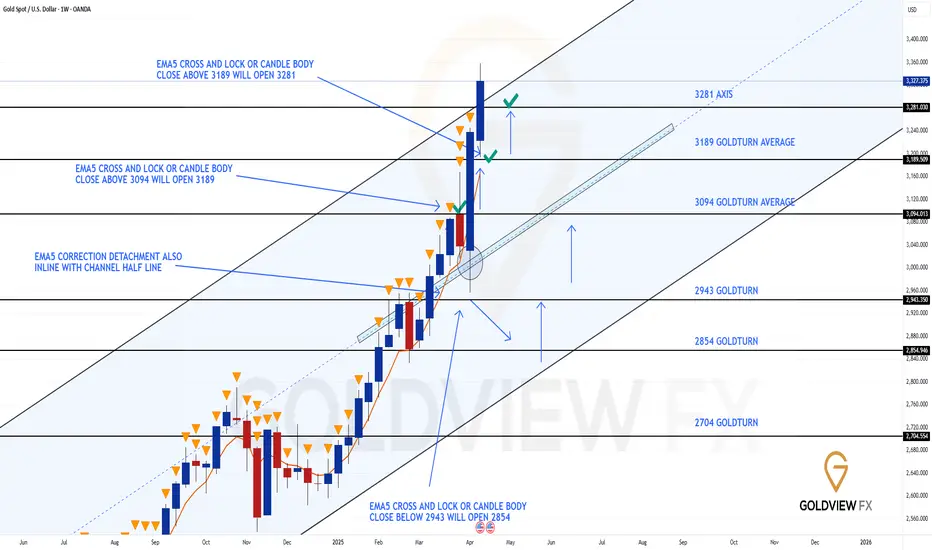
GOLD WEEKLY CHART MID/LONG TERM ROUTE MAPHey Everyone,
Please see update on our week chart idea, which has been playing out perfectly allowing us to track the movement down and trade the movement up and finally complete - BOOOOM!!!
After completed all our [previous targets on this chart, we were left with a body close above 3189 leaving a long range/term gap to 3281. This target was hit last week completed this chart idea.
We will now update a new weekly chart idea next week with more long term/range projections. Please keep an eye out for this for next Sunday or if we get a chance, we will try and get this out earlier.
However, please note if we see a rejection here on the channel top, then the lower levels within the channel, are still valid to track the movement down and up.
Thank you all for your likes, comments and follows, we really appreciate it!
Mr Gold
GoldViewFX
THE KOG REPORT - UpdateEnd of day update from us here at KOG:
Due to the holiday weekend we've taken it easy on the gold, only one short over for a fantastic capture and that's us done for the week.
Some levels to look for:
3224-26 resistance needs to break to go higher.
3280 needs to break to go lower.
Today's bias and red boxes, still apply:
RED BOXES:
Break above 3335 for 3340, 3347, 3350 ,3356 and 3374 in extension of the move
Break below 3320 for 3310✅, 3307✅, 3296✅, 3290✅ and 3277 in extension of the move
KOG's Bias of the day:
Bearish below 3335 with targets below 3310✅, 3306✅, 3300✅ and 3293✅
Bullish above 3335 with targets above 3340, 3349, 3353 and 3360
Wishing you all a great holiday weekend and we'll see you next week for the KOG Report.
As always, trade safe.
KOG

GOLD ROUTE MAP UPDATEHey Everyone,
Once again a great day on the market today with our chart idea playing out, as analysed. This chart idea is now fully complete with our final target being completed today.
Yesterday after completing 3324 we stated that we needed ema5 lock above 3324 to open 3352. We got the cross and lock above 3324 to open 3352, which was hit perfectly completing this target and this chart idea.
We now expect a rejection on this zone and then we can continue to catch bounces from the lower Goldturns.
We will keep the above in mind when taking buys from dips. Our updated levels and weighted levels will allow us to track the movement down and then catch bounces up.
We will continue to buy dips using our support levels taking 30 to 40 pips. As stated before each of our level structures give 20 to 40 pip bounces, which is enough for a nice entry and exit. If you back test the levels we shared every week for the past 24 months, you can see how effectively they were used to trade with or against short/mid term swings and trends.
The swing range give bigger bounces then our weighted levels that's the difference between weighted levels and swing ranges.
BULLISH TARGET
3261 - DONE
EMA5 CROSS AND LOCK ABOVE 3261 WILL OPEN THE FOLLOWING BULLISH TARGET
3292 - DONE
EMA5 CROSS AND LOCK ABOVE 3292 WILL OPEN THE FOLLOWING BULLISH TARGET
3324 - DONE
EMA5 CROSS AND LOCK ABOVE 3324 WILL OPEN THE FOLLOWING BULLISH TARGET
3352 - DONE
BEARISH TARGETS
3230 - DONE
EMA5 CROSS AND LOCK BELOW 3230 WILL OPEN THE FOLLOWING BEARISH TARGET
3201 - DONE
EMA5 CROSS AND LOCK BELOW 3201 WILL OPEN THE RETRACEMENT RANGE
3179
3152
EMA5 CROSS AND LOCK BELOW 3152 WILL OPEN THE SWING RANGE
3120
3094
EMA5 CROSS AND LOCK BELOW 3094 WILL OPEN THE SECONDARY SWING RANGE
SECONDARY SWING RANGE
3069 - 3038
As always, we will keep you all updated with regular updates throughout the week and how we manage the active ideas and setups. Thank you all for your likes, comments and follows, we really appreciate it!
Mr Gold
GoldViewFX

GOLD (XAUUSD): Trend-Following Setup ExplainedI spotted a bullish flag pattern on ⚠️Gold pair.
After reaching a new higher high, the price corrected within an expanding channel
To catch the next bullish move, I'm waiting for a bullish breakout of the flag's resistance.
We need a 4H candle close above that to confirm the breakout.
Target will be 3360

GOLD DAILY CHART MID/LONG TERM UPDATEHey Everyone,
After completing our last daily chart idea please see update on our new daily chart idea. We have also updated a new Goldturn ascending channel.
We are seeing price break out of the channel but will need ema5 to lock outside of the channel to confirm the breakout vs a fakeout. If this happens then the channel top is likely to to form support for a continuation, just like we are seeing the current candles bounce from the channel top, as support.
This is the beauty of our Goldturn channels, which we draw in our unique way, using averages rather than price. This enables us to identify fake-outs and breakouts clearly, as minimal noise in the way our channels are drawn.
We will use our smaller timeframe analysis on the 1H and 4H chart to buy dips from the weighted Goldturns for 30 to 40 pips clean. Ranging markets are perfectly suited for this type of trading, instead of trying to hold longer positions and getting chopped up in the swings up and down in the range.
We will keep the above in mind when taking buys from dips. Our updated levels and weighted levels will allow us to track the movement down and then catch bounces up using our smaller timeframe ideas.
Our long term bias is Bullish and therefore we look forward to drops from rejections, which allows us to continue to use our smaller timeframes to buy dips using our levels and setups.
Buying dips allows us to safely manage any swings rather then chasing the bull from the top.
Thank you all for your likes, comments and follows, we really appreciate it!
Mr Gold
GoldViewFX

#XAUUSD: Bullish Rally To Continue $3550 Area! Gold’s been on a steady upward climb, and it seems like it might keep going up. The only thing that’s really driving it up is the fundamentals. Right now, the price is super high, and selling it could be risky.
Thanks for your support! 😊
If you want to help us out, here are a few things you can do:
- Like our ideas
- Comment on our ideas
- Share our ideas
Team Setupsfx_
Cheers,
Team Setupsfx_

Market Analysis: Gold Extends Record RunMarket Analysis: Gold Extends Record Run
Gold price started a fresh surge above the $3,250 resistance level.
Important Takeaways for Gold Price Analysis Today
- Gold price started a fresh surge and traded to a new record high at $3,384 against the US Dollar.
- A key bullish trend line is forming with support at $3,322 on the hourly chart of gold at FXOpen.
Gold Price Technical Analysis
On the hourly chart of Gold at FXOpen, the price formed a base near the $3,200 zone. The price started a steady increase above the $3,250 and $3,280 resistance levels.
There was a decent move above the 50-hour simple moving average and $3,350. The bulls pushed the price above the $3,380 resistance zone. A new record high was formed near $3,384 and the price is now consolidating gains.
On the downside, immediate support is near the $3,362 level and the 23.6% Fib retracement level of the upward move from the $3,283 swing low to the $3,384 high.
The next major support sits at $3,322. There is also a key bullish trend line forming with support at $3,322. It is near the 61.8% Fib retracement level of the upward move from the $3,283 swing low to the $3,384 high.
A downside break below the trend line support might send the price toward the $3,282 support. Any more losses might send the price toward the $3,242 support zone.
Immediate resistance is near the $3,384 level. The next major resistance is near the $3,388 level. An upside break above the $3,388 resistance could send Gold price toward $3,500. Any more gains may perhaps set the pace for an increase toward the $3,520 level.
This article represents the opinion of the Companies operating under the FXOpen brand only. It is not to be construed as an offer, solicitation, or recommendation with respect to products and services provided by the Companies operating under the FXOpen brand, nor is it to be considered financial advice.

Lingrid | GOLD sideways CONSOLIDATION with BULLISH PotentialAs expected, OANDA:XAUUSD price continues to move sideways after the bullish momentum in the market. The price is still trading within the Friday and Monday range zone. The market may consolidate for a couple of days, however, if the market pulls back below the last 2 days' low and upward trendline, I think there is a great chance of price rebound and further upward move. Another scenario is triangle formation or rising wedge pattern near the current resistance zone. Despite this, I expect the price to rebound from the support level around 3170-3180 then continuation. Watch these key levels closely for confirmation of the next directional move. My goal is resistance zone around 3285
Traders, if you liked this idea or if you have your own opinion about it, write in the comments. I will be glad 👩💻

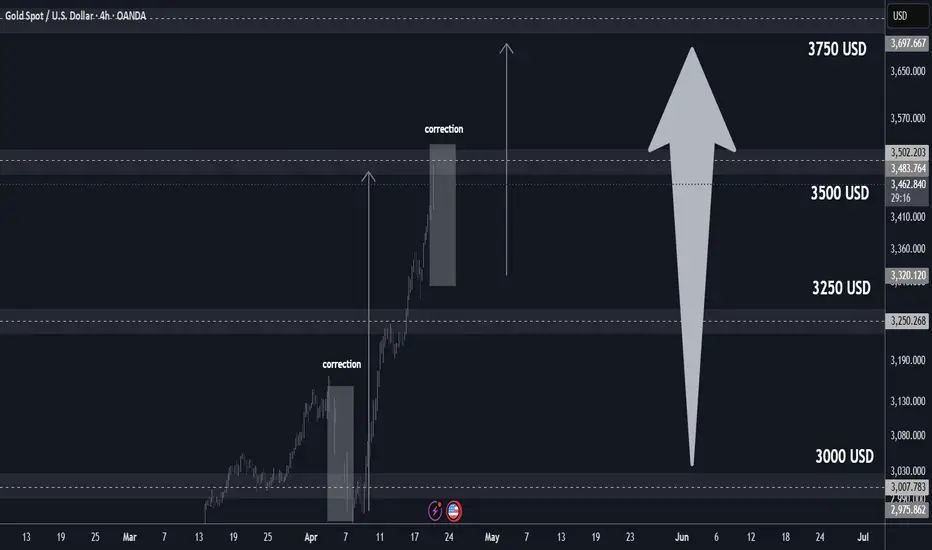
3500/3750 USD Gold Key levels Overview and PT Bulls🏆 Gold Market Mid-Term Update
📊 Technical Outlook Update
🏆 Bull Market Overview
▪️broke above 3 000 USD
▪️3250 USD S/R cleared as well
▪️Testing 3500 USD key S/R now
▪️Break above 3500 - 3750 USD new PT
▪️Bulls maintain strategic advantage
▪️all dips get scooped up
▪️short-term pullback/correction
▪️possible next few days but
▪️Bulls will target 3750 USD
⭐️Recommended strategy
▪️BUY/HOLD accumulate dips
▪️3250/3350 USD reload BULLS
▪️PT Bulls 3750 USD
📢 Gold Price Outlook – Next 30 Days (April–May 2025)
🔥 Key Drivers to Watch
🌍 Geopolitics & Trade
🇺🇸🇨🇳 U.S.–China Tariffs: Escalation continues pushing inflation fears & gold demand
🇪🇺 EU–U.S. tariffs (25%) are further straining global trade
💵 Weaker USD = stronger gold sentiment
🕊 Russia–Ukraine Ceasefire Talks
🗓 May 9 (Victory Day): Symbolic date eyed for a possible ceasefire announcement
🇷🇺 Parade vs 🇺🇦 EU leaders visiting Kyiv — all eyes on peace prospects
☢️ U.S.–Iran Nuclear Deal
🗓 April 28: Talks in Rome
🇮🇷 Iran shows readiness — possible easing of Middle East tensions
📆 Key Dates
📊 Apr 25 – U.S. inflation data
🗣 May 1 – Fed interest rate decision
☢️ Apr 28 – U.S.–Iran nuclear talks
🕊 May 9 – Possible Russia–Ukraine ceasefire date
GOLD → Consolidation before the news. What to expect?FX:XAUUSD is not going to turn around. The level of economic risks is still at a high level and the price may continue to rise, but after the end of consolidation.
Gold is back to a record $3,246 despite calm markets. Lower US bond yields and a pause in capital withdrawals are supporting demand for protective assets.
Uncertainty around Trump's tariff policy and expectations of a Fed rate cut are driving prices higher. Additional support is provided by inflows into Chinese ETFs and expectations of Chinese GDP data. Further gold movement depends on headlines on tariffs and Fed rhetoric.
Technically, the focus is on consolidation 3244 - 3187 and internal support level 3208.
Resistance levels: 3244, 3270
Support levels: 3208, 3187
The market is likely to be in consolidation until tomorrow, when important economic reports will be published. But nevertheless, there could be strong movements intraday due to various factors. I expect to see a retest of support at 3208 or 3187 before further upside. But, consolidation near 3244, breakout and consolidation above the level may give a chance for growth
Regards R. Linda!

Potential Reversal in Gold After Completing Widening Formationhello guys!
The 4H Gold/USD chart exhibits a classic Broadening Formation (also known as a Megaphone Pattern), marked by higher highs and lower lows, reflecting increased volatility and market indecision. This pattern is identified with three key swing points on both the upper and lower trendlines:
Point 1 and Point 2 formed the initial boundaries of the pattern.
Point 3, recently touched, completes the structure by testing the upper boundary of the formation near $3,238, suggesting a potential bull trap, as illustrated in the schematic overlay.
just look at:
The price has sharply rallied to the top of the widening pattern, aligning with the third high, often a strong signal for reversal in this setup.
A rejection from this level is anticipated, supported by the bearish projection arrows targeting multiple demand zones.
Bearish Target Zones:
$3,180 – $3,160: Previous consolidation zone.
$3,140 – $3,120: Mid-pattern volume area with past price sensitivity.
$3,060 – $3,040: Major support zone with a strong volume node and previous reaction area.
Volume Profile Insight:
The volume profile shows significant activity in the $3,040 zone, reinforcing it as a major demand area where buyers might step in again.
__________________________
Summary:
This setup suggests a potential bearish correction after a strong upward move. If price action respects the pattern, traders may look for short opportunities from current levels with the outlined targets. Watch for confirmations such as reversal candlesticks or breakdowns of minor support levels.

#XAUUSD:Time to Sell Gold ? Gold experienced a record high after touching $3358, but it subsequently declined. We anticipate further price drops until it reaches $3250, representing a 1000 pips move. We expect the price to remain bearish until it reaches a specific level. We appreciate your continued support.
Wishing you a joyous Easter.
Much Love ❤️
Team Setupsfx_

GOLD 4H CHART ROUTE MAP UPDATEHey Everyone,
Another great day on the markets today. After completing our 1h chart route map yesterday, we moved onto our 4 chart route map.
On this chart idea, we got our Bullish target at 3330 hit, followed with candle body close gaps to 3372 and 3414, as ema5 didn't catch up due to momentum. However, the body close breaks on each level still gave us enough time for the confirmation before being hit.
We then managed to get ema5 cross and lock above 3414 opening 3457, which was also hit perfectly, completing this target with confirmation. No further lock above 3457 confirmed the rejection. However, we now have a body close above 3457 with a gap to 3503, which just fell short by a few pips.
We will keep the above in mind when taking buys from dips. Our updated levels and weighted levels will allow us to track the movement down and then catch bounces up.
We will continue to buy dips using our support levels taking 30 to 40 pips. As stated before each of our level structures give 20 to 40 pip bounces, which is enough for a nice entry and exit. If you back test the levels we shared every week for the past 24 months, you can see how effectively they were used to trade with or against short/mid term swings and trends.
BULLISH TARGET
3330 - DONE
EMA5 CROSS AND LOCK ABOVE 3330 WILL OPEN THE FOLLOWING BULLISH TARGET
3372 - DONE
EMA5 CROSS AND LOCK ABOVE 3372 WILL OPEN THE FOLLOWING BULLISH TARGET
3414 - DONE
EMA5 CROSS AND LOCK ABOVE 3414 WILL OPEN THE FOLLOWING BULLISH TARGET
3457 - DONE
EMA5 CROSS AND LOCK ABOVE 3457 WILL OPEN THE FOLLOWING BULLISH TARGET
3503
BEARISH TARGETS
3282
EMA5 CROSS AND LOCK BELOW 3282 WILL OPEN THE RETRACEMENT RANGE
3224
3190
EMA5 CROSS AND LOCK BELOW 3190 WILL OPEN THE SWING RANGE
SWING RANGE
3131 - 3077
As always, we will keep you all updated with regular updates throughout the week and how we manage the active ideas and setups. Thank you all for your likes, comments and follows, we really appreciate it!
Mr Gold
GoldViewFX

Gold’s Quiet Ascent to a New Era?Gold has recently regained strong attention as the US dollar weakens, largely due to unstable trade policy in the United States. While the dollar remains the world’s primary reserve currency, there are growing signs that gold is becoming a more reliable alternative in an increasingly uncertain global landscape.
A key catalyst is China’s decision to allow insurance companies to allocate more of their assets into gold. This move alone could generate hundreds of tons in additional demand each year — a significant force in a market where global supply remains limited.
Meanwhile, major banks like Citi, UBS, Goldman Sachs, and Bank of America have all revised their gold forecasts upward for 2025–2026. Some targets now reach as high as $3,500/ounce, reflecting growing conviction that gold is entering a new bull cycle — not just short term, but across the medium and long term.
To me, this isn’t just a reaction to recent headlines — it signals a deeper shift in how institutions are revaluing gold’s role. The $100 surge last Wednesday marked a peak in market enthusiasm, and it’s likely just the beginning.
We might see minor pullbacks ahead, but the broader trend is intact. If gold truly breaks into a new price range in the coming quarters, this could be a crucial time to prepare, observe, and identify well-timed Buy entries.

GOLD (XAUUSD): Classic Trend-Following Pattern
Gold closed on Thursday, forming a bullish flag pattern
on an hourly time frame.
The flag reflects a correction that the market started after a completion
of a strong bullish wave.
A breakout of its resistance line and a candle close above will signify
a highly probable resumption of the trend.
With a high probability, the price will move up at least to a current ATH.
(Remember that the price may respect a trend line one or several times more
and a correction can be more extended, that is why we rely on a breakout of a reliable trigger).
❤️Please, support my work with like, thank you!❤️
I am part of Trade Nation's Influencer program and receive a monthly fee for using their TradingView charts in my analysis.

GOLD - After upward movement, price can correct to support areaHi guys, this is my overview for XAUUSD, feel free to check it and write your feedback in comments👊
After a long, steady climb inside a rising channel, Gold pushed through local resistance and gained momentum.
The move extended beyond the channel's top, marking a fresh high near $3240 points, attracting strong attention.
But after this sharp push, the price began losing steam and rolled into a soft pullback phase.
Now, Gold is holding just above the $3160 area, retesting the zone that was previously broken upward.
Volume is slowing down, and the price action shows hesitation without follow-through on the upside.
I believe Gold could roll over from here and revisit the $3130 support area in the coming sessions.
If this post is useful to you, you can support me with like/boost and advice in comments❤️

XAU/USD: All-Time High Reached with Pullback Opportunity AheadThe XAU/USD market has set a new all-time high, continuing its strong bullish trajectory toward the 3300 resistance zone. This level may act as a potential reversal point, offering a chance to enter on a pullback.
A range zone has formed around the 3225 level, which, along with the nearby upward trendline, could serve as a key support area for identifying buy signals. With high-impact news scheduled for today, volatility is expected. Should a retracement occur, the support zone around 3225 may provide a launchpad for the next move toward the resistance zone at 3390

Gold could give a new bull run Gold is making a counter-trend correction in the early European session, most likely to confirm support or reach liquidity areas.
A false break of support is a good signal for the continuation of growth
Strategy: The correction is forming against the main bullish trend. The only correct decision is to look for support with the purpose of buying.
False breakdown of 3320 or 3313 may resume further growth to a new high.

Gold (XAUUSD) Trade Setup: Bullish Breakout Toward $3,637 TargeCurrent Price: $3,309.18
EMA 30 (Red Line): $3,265.00
EMA 200 (Blue Line): $3,163.35
Trend Direction: Strong uptrend (price above both EMAs)
Timeframe: 1-hour (short-term analysis)
📍 Key Levels
Entry Point: Around $3,266.63 (just above EMA 30)
Stop Loss: Around $3,265.00
Target (EA Target Point): $3,637.23
Potential Profit: +$365.01 or +11.16%
🔍 Technical Patterns & Zones
Rising Channel: Price is moving within a rising wedge or channel, indicating bullish momentum but with narrowing range — a potential reversal signal if broken.
Support Zone: Highlighted purple box around the entry point; likely a demand zone.
Resistance Zone: $3,637.23 area marked as the EA Target Point — previous resistance or Fibonacci extension level.
✅ Bullish Signals
Price is consistently making higher highs and higher lows.
EMAs are aligned in a bullish formation (short EMA above long EMA).
Clear breakout above consolidation range recently.
Trade setup shows favorable risk-to-reward ratio.
⚠️ Risks / Caution
Rising wedge can sometimes break down — watch for volume drop or divergence.
Potential pullback to the entry zone is expected (indicated by the arrow).
News Events: Symbols below the chart indicate upcoming USD economic data, which could bring volatility.
📈 Strategy Summary
Buy on pullback to $3,266.63 with tight stop at $3,265.00.
Target: $3,637.23 — potential 11% gain.
Risk: Minimal if stop is respected, tight stop-loss.

XAUUSDHello Traders! 👋
What are your thoughts on GOLD?
Gold has successfully broken above its resistance zone and the top of the ascending channel, indicating strong bullish momentum.
Two support zones have been identified below the current price. A correction toward one of these levels is expected before the next bullish leg begins.
After a pullback to one of these support areas, we expect gold to resume its uptrend and push toward higher levels and new highs.
Among the two, the second support zone is considered a safer entry point for long positions, as it may offer stronger support and a better risk-reward setup.
💡 Which support zone would you use for your buy entry? Share your thoughts below!
Don’t forget to like and share your thoughts in the comments! ❤️

Gold - 25% crash to 2650, then pump to 7000! (must see)A crash to 2650 is very likely in the next few weeks! Why? Let's take a look at the most popular oscillators - RSI, MACD and STOCHASTIC.
Let's start with the RSI indicator on the monthly chart. The RSI indicator moves between 0 and 100. What we can see here is a strong horizontal resistance at the 85 level in the overbought region. Every time gold hits this strong resistance, a huge crash follows, specifically in 2006, 2008, 2020, and now in 2025. So this is a sell signal. We don't want to chase gold, while the RSI indicator is at such high levels - we want to wait for a pullback.
The next is the MACD indicator - the histogram hit a new all-time high on gold. We have never seen such crazy levels on gold. The histogram is currently too far away from the 0 line, which is a sign of an extremely overbought market. What we want to do here is to wait for the histogram to return to 0 and buy. There isn't really any bearish sign on the MACD indicator yet, but if you want to wait for a confirmation, then wait for a first downtick on the histogram and sell.
The last very popular indicator is STOCHASTIC . This indicator pretty much screams to sell, because both lines have been in the overbought territory since 2023. Plus, we have a bearish crossover this month (if the candle closes like today's price). To see this bearish crossover, you have to zoom in. So this indicator is giving us a bearish signal to sell gold.
Additional bearish reasons: The first reason is that the price of gold just hit a major trendline on the monthly chart. Monthly charts are incredibly powerful, so you want to make sure to know what is going on here. Always trade with a valid trend. The next reason is an untested POC on the volume profile. This POC is exactly at 2650, so this should be a great buying opportunity!
Please write a comment below and let me know what you think about this upcoming crash on GOLD? And are you bullish or bearish? Also hit the like button for more ideas on gold, so I know you are interested!

Lingrid | GOLD Unstoppable MOMENTUM Toward New All-TIME HighsThe price perfectly fulfilled my previous idea. It reached the targeted level. OANDA:XAUUSD market appears unstoppable as it reaches a new all-time high level at 3500. From this peak, price pulled back toward the support level and previous day's high. We can observe that the price completed an ABC move before the pullback formed. Following this retracement, there's a possibility the price is creating either a triangle pattern or flag pattern similar to previous formation. If the market maintains position above the upward trendline and the crucial support level at 3400, there's a strong probability of trend continuation with the market retesting the ATH level and pushing further upward. My goal is resistance around 3520
Traders, if you liked this idea or if you have your own opinion about it, write in the comments. I will be glad 👩💻
