Is gold currently in a bullish or bearish trend?We’ve seen gold surge significantly during times of uncertainty. The problem is, when we look back at the 2008 financial crisis, we notice a similarly exponential rise, which was followed by a 45% correction after reaching its peak. Based on a current price of $3,400, a correction down to $1,800 is possible. This means it’s very realistic that gold could spike again sharply—especially if Powell ends up being fired—and then, once things start to calm down again, we could see a major correction of at least 45%.
XAUUSD.P trade ideas

Similar Bull Runs GOLD Gold is going parabolic on this run with a massive move
This can be compared to a run in previous history of gold
The price of gold moving up could be due to uncertainty in other markets, hence movement into metals and other stores of value
Weekly timeframe

Analysis of gold price trend next week!Market news:
April 14 to April 18, 2025, due to the Good Friday holiday, the market was closed on April 18. There were only four trading days this week, and the spot gold market performed strongly, with a weekly increase of 2.76%. Prior to this, some investors chose to take profits after the international gold price hit a new high of more than $3,357 on Thursday. Although the current technical side shows that gold is overbought, the overall market is still in a steady upward trend.The rise in London gold prices was driven by the safe-haven demand caused by the weakening of the US dollar, trade policy uncertainty, and hawkish remarks by Federal Reserve Chairman Jerome Powell on the risk of stagflation. The economic data released this week showed differentiation, with a solid labor market but weak housing data, coupled with geopolitical risks such as the European Central Bank's interest rate cut and the Russia-Ukraine conflict, further enhancing the attractiveness of gold.Looking ahead, the bullish trend of gold remains solid, and investors should pay close attention to the Fed's subsequent policy statements and trade policy dynamics, which will have an important impact on market sentiment and gold price trends in the coming weeks.
Technical Review:
Gold daily level still maintains a strong unilateral bullish trend in the short term. There is no highest, only higher. Before the top pressure K appears, it will continue to step back and be bullish. The support position confirmed by the step back is about 3300-3290. As long as this position is stabilized, there is hope for further efforts in the future to set a new historical high.The 4-hour level is now in high-level fluctuations. The key MA10-day support moves up to 3313. As long as this moving average can be held, this cycle will still maintain a strong squeeze and pull up. At the hourly level, there will be a certain decline and correction in the short-term Asian session on Thursday, and it will be trapped in a shock consolidation. The next step is to wait patiently for the consolidation to end. The short-term pressure point middle track is also the 10-day moving average 3332-33 line. There may be multiple attempts here, but before breaking through, don't chase the rise! Pay attention to the lower track support 3313 below, and the upper track of the previous channel step back to confirm the range of 3300-3290, because the upward channel is uncertain whether there will be a false piercing. Therefore, it is recommended to wait for 3313, 3300-3290 to stabilize and rise next week, or break through 3332-33 and then step back to confirm stability, which is also bullish. After a sharp rise, it is just a small adjustment at a high level or sideways, which is to prepare for the next round of rise.
Next week's analysis:
Gold fell all the way in the US market on Friday, falling to 3283 at the lowest, but gold rose again in the second half of the night for risk aversion. Will gold return to a large range of fluctuations or end the adjustment? Then the trend of gold after the opening next week is very critical. If gold continues to rise strongly at the opening next week, then gold may be adjusted to the end, and gold bulls may continue to exert their strength. This will be seen after the opening of Monday.The gold 1-hour moving average is now continuing to diverge upward with a golden cross. If the gold 1-hour moving average turns in the short term, then the gold 1-hour will begin to adjust. So if the short-term opening is weak next week, then the gold 1-hour moving average may begin to turn, and if it is strong, it will continue to extend upward. Gold is suppressed by the downward trend line in the 1-hour short term. The short-term pressure of gold moves down to the 3332 line. If gold is still under pressure at 3332 after opening next week, then gold may continue to fluctuate downward in the short term, thereby driving the moving average to turn around. If it directly breaks through 3332 after opening, then gold will start to fluctuate in a large range.
Operation ideas:
Buy short-term gold at 3300-3303, stop loss at 3292, target at 3340-3350;
Sell short-term gold at 3350-3353, stop loss at 3362, target at 3310-3300;
Key points:
First support level: 3313, second support level: 3300, third support level: 3285
First resistance level: 3332, second resistance level: 3357, third resistance level: 3373

XauusdI think the global market is making its last moves and has no more room for further growth. It will soon start a sharp decline and fall below 3,000 again. Wait.

gold Weekly frame price might retest the 1fib level as shown at the chart .
breaking each level should take us to the next .


Gold reaches a very strong overbought levelNew all-time record for the GOLD
Gold has broken through $3300 per ounce, with a market capitalization now of $22,000 billion, i.e. above China's GDP ($18,000 billion) and close to that of the USA ($27,700 billion). It is now the best-performing major asset since the start of the year among all asset classes, with an increase of over 20%. This massive uptrend was triggered by a technical signal given in February 2024, when the former all-time high of $2075 was surpassed.
But today, a real question needs to be asked: should we take profits? The most ambitious technical targets have almost all been reached, and gold has not paused on the stock market since autumn 2024.
Gold has been supported since 2022 by a combination of fundamental factors
- Global geopolitical and macroeconomic uncertainty, which has activated the safe-haven aspect of gold to the detriment of risky stock market assets such as equities
- Demand for gold from Central Banks, which has been a constant support in recent years
- The fall in the value of the US dollar on the foreign exchange market (see Swissquote's analysis of the US dollar, which is linked to this GOLD update)
- Lower interest rates at major central banks
- Solid upward momentum in physical gold demand in India and China
- Strong financial demand for gold, with substantial inflows into Gold ETFs in the USA, Asia and Europe
On the technical front, monthly momentum indicators are showing extreme overbought conditions, which may seem excessive, but no bearish divergence has yet appeared.
We must therefore remain attentive, but not yet jump to conclusions about the end of the bullish cycle. At the current price, GOLD is clearly in a phase of high bullish maturity, and closer to the end of the bull cycle than the beginning.
An analysis of the history of the gold price on the stock market shows that it alternates between 10-year bullish cycles and pauses lasting several years. There's no point in anticipating the end of the current bullish cycle; we need to wait for a clear technical signal to take profit.
In other words: no sell signal yet, but technical vigilance required at these levels.
There's also the question of Bitcoin, an asset often perceived as "digital gold". Against this backdrop of inflation and monetary uncertainty, arbitrage between BTC and GOLD remains a major factor to consider. Movements in cryptos can reinforce (or weaken) the attractiveness of gold, depending on the positioning of institutional portfolios. It's not a simple opposition, but a balancing act that can influence GOLD's medium-term trend.
DISCLAIMER:
This content is intended for individuals who are familiar with financial markets and instruments and is for information purposes only. The presented idea (including market commentary, market data and observations) is not a work product of any research department of Swissquote or its affiliates. This material is intended to highlight market action and does not constitute investment, legal or tax advice. If you are a retail investor or lack experience in trading complex financial products, it is advisable to seek professional advice from licensed advisor before making any financial decisions.
This content is not intended to manipulate the market or encourage any specific financial behavior.
Swissquote makes no representation or warranty as to the quality, completeness, accuracy, comprehensiveness or non-infringement of such content. The views expressed are those of the consultant and are provided for educational purposes only. Any information provided relating to a product or market should not be construed as recommending an investment strategy or transaction. Past performance is not a guarantee of future results.
Swissquote and its employees and representatives shall in no event be held liable for any damages or losses arising directly or indirectly from decisions made on the basis of this content.
The use of any third-party brands or trademarks is for information only and does not imply endorsement by Swissquote, or that the trademark owner has authorised Swissquote to promote its products or services.
Swissquote is the marketing brand for the activities of Swissquote Bank Ltd (Switzerland) regulated by FINMA, Swissquote Capital Markets Limited regulated by CySEC (Cyprus), Swissquote Bank Europe SA (Luxembourg) regulated by the CSSF, Swissquote Ltd (UK) regulated by the FCA, Swissquote Financial Services (Malta) Ltd regulated by the Malta Financial Services Authority, Swissquote MEA Ltd. (UAE) regulated by the Dubai Financial Services Authority, Swissquote Pte Ltd (Singapore) regulated by the Monetary Authority of Singapore, Swissquote Asia Limited (Hong Kong) licensed by the Hong Kong Securities and Futures Commission (SFC) and Swissquote South Africa (Pty) Ltd supervised by the FSCA.
Products and services of Swissquote are only intended for those permitted to receive them under local law.
All investments carry a degree of risk. The risk of loss in trading or holding financial instruments can be substantial. The value of financial instruments, including but not limited to stocks, bonds, cryptocurrencies, and other assets, can fluctuate both upwards and downwards. There is a significant risk of financial loss when buying, selling, holding, staking, or investing in these instruments. SQBE makes no recommendations regarding any specific investment, transaction, or the use of any particular investment strategy.
CFDs are complex instruments and come with a high risk of losing money rapidly due to leverage. The vast majority of retail client accounts suffer capital losses when trading in CFDs. You should consider whether you understand how CFDs work and whether you can afford to take the high risk of losing your money.
Digital Assets are unregulated in most countries and consumer protection rules may not apply. As highly volatile speculative investments, Digital Assets are not suitable for investors without a high-risk tolerance. Make sure you understand each Digital Asset before you trade.
Cryptocurrencies are not considered legal tender in some jurisdictions and are subject to regulatory uncertainties.
The use of Internet-based systems can involve high risks, including, but not limited to, fraud, cyber-attacks, network and communication failures, as well as identity theft and phishing attacks related to crypto-assets.

Gold trading zones: 16-APRIL-2025Stay ahead with today's Gold trading zones. Enhance your market insights and trade carefully.

GOLD Bull Market Price Target is 7 500 USD accumulate on dips🏆 Gold Market Long-Term Update 12/24 months
📊 Technical Outlook Update
🏆 Bull Market Overview
▪️2weeks/candle price chart
▪️Gold Bull market in progress
▪️1976/1979 650% gains - Bull Market 1
▪️1999/2012 650% gains - Bull Market 2
▪️2016/2027 650% gains- Bull Market 3
▪️Price Target BULLS 7500 USD
▪️650% gains off the lows
▪️will hit in 2026/2027
⭐️Recommended strategy
▪️BUY/HOLD accumulate dips
▪️BUY/HOLD physical gold
▪️BUY/HOLD GLD/GDX

Overbought territory Past historical data suggests that everytime gold has hit a new all time high with RSI overbought above 80 it does not sustain and a 10-20% pullback occurs.

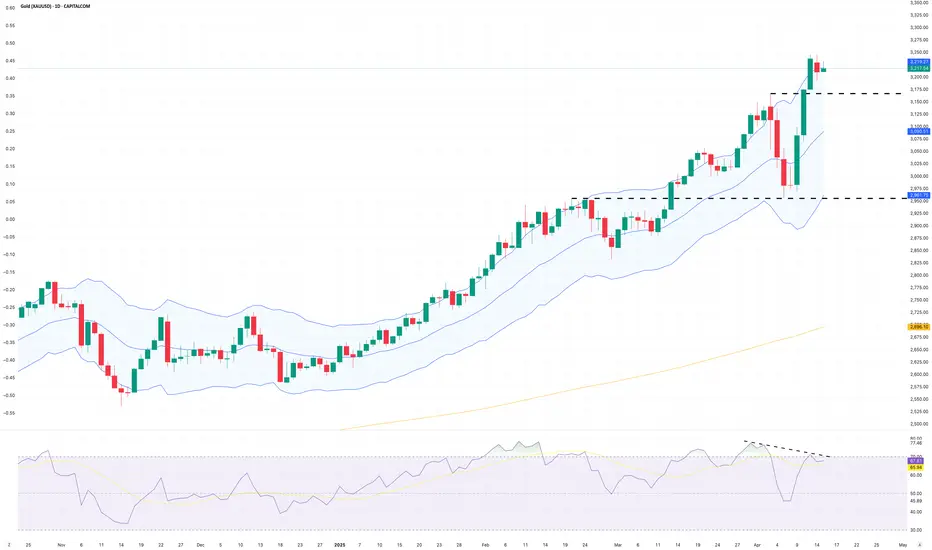
Gold Takes a Pause Near HighsAs gold takes a breather just below its recent highs, it’s a good moment to zoom out and ask a few bigger questions. Is this a healthy consolidation before the next leg higher, or are we seeing early signs of buyer exhaustion? Let’s take a look at the key levels in play, what’s driving the broader move, and how the technical picture is shaping up.
Gold Shines Amid Macro Noise
Most markets this year have been on a Trumpian rollercoaster—rallying on the promise of deregulation and then stumbling as tariff threats rattle risk appetite. But gold has been a different story entirely. It’s been climbing steadily, driven by a cocktail of macro catalysts that continue to align in its favour.
Geopolitical tension is a big one. From renewed trade war threats to simmering conflict in the Middle East, the backdrop is risk-heavy—and gold thrives in that environment. Add in lingering inflation worries and speculation around central bank easing, and you’ve got the ideal conditions for gold to rally.
Crucially, gold isn’t just reacting to the headlines—it’s responding to positioning and flows. Demand from both institutional investors and central banks has remained strong. ETFs have seen persistent inflows, while major buyers continue to stockpile gold as a hedge against currency risk and market volatility. In short, the bull case for gold remains underpinned by more than just fear—it’s backed by allocation shifts and structural demand.
Trend Watch: Strength, But Signs of Stretch
Gold’s daily candle chart shows a market trading well above its rising 200-day moving average—always a strong signal that the broader trend remains intact. This uptrend has been in place for months, and the market has done the hard yards to build a healthy base before each new leg higher.
That said, with gold pausing just beneath recent highs, it’s fair to ask whether we’re setting up for continuation—or due for a deeper pullback. There are arguments on both sides.
The case for trend continuation starts with structure. The market continues to respect former resistance levels, which are now acting as support—always a good sign of an orderly rally. The trend angle itself also looks sustainable; this hasn’t been a parabolic move, which makes it less vulnerable to a violent correction.
Perhaps most telling is the recent ‘high and tight’ consolidation. Rather than giving back gains, gold is simply moving sideways near the highs—a sign that dip buyers are stepping in quickly, and that there’s no real appetite for lower prices just yet.
On the flip side, there are a couple of caution flags worth keeping an eye on.
The first is the Keltner Channel. For context, the Keltner Channel is a volatility-based envelope that plots a band around a moving average, using the Average True Range to define the width. When price pushes into the upper band, it can signal an overextended move. While a 'slide' along the upper edge is possible in strong trends, a full-blown breakout above the channel often precedes a pullback—so it’s something to watch.
Second is RSI divergence. Gold made a new trend high last week, but the RSI didn’t follow suit—instead forming a lower high. This divergence between price and momentum can be an early sign of fatigue. It doesn’t guarantee a reversal, but it does suggest the move may need a bit of a breather.
Gold (XAU/USD) Daily Candle Chart
Past performance is not a reliable indicator of future results
Summary:
Gold’s pause near highs looks healthy for now, especially in the context of the broader trend and supportive fundamentals. But it’s worth staying alert. A push above recent highs, backed by volume and strong momentum, would reinforce the bull case. However, if RSI divergence plays out and the price breaks short-term support levels, we could see a sharper pullback first.
Disclaimer: This is for information and learning purposes only. The information provided does not constitute investment advice nor take into account the individual financial circumstances or objectives of any investor. Any information that may be provided relating to past performance is not a reliable indicator of future results or performance. Social media channels are not relevant for UK residents.
Spread bets and CFDs are complex instruments and come with a high risk of losing money rapidly due to leverage. 83% of retail investor accounts lose money when trading spread bets and CFDs with this provider. You should consider whether you understand how spread bets and CFDs work and whether you can afford to take the high risk of losing your money.
Gold Ideas for Tuesday April 15Trend Context: Bullish but showing signs of exhaustion near 3247.
Focus: liquidity grab + intraday rejection potential.
🔍 Market Structure Overview
HTF (H4–12H): Bullish structure holding after the impulsive move 3120 → 3248. Current premium zone tested around 3233–3247 (H4 OB + FVG).
LTF (M15–H1): Reaccumulation structure between 3172–3247. BOS confirmed on M15 from 3180. Current PA shows early rejection wicks near 3230–3240.
🧠 Liquidity Zones & Imbalances
🔴 Supply Zone: 3233–3247 → H1–H4 OB confluence with premium FVG. Still unmitigated.
🟠 Demand Zone 1: 3172–3180 → Daily imbalance + H1 demand + fib 61.8%.
🟢 Demand Zone 2: 3120–3130 → Only valid on deeper correction sweep (low probability today).
⚠️ Liquidity Trap: 3215–3220 → May induce late buyers into supply rejection.
📍 Trade Setups
SELL ZONE
Entry: 3233–3247
SL: 3252
TP1: 3210
TP2: 3180
TP3: 3145
📌 Reason: HTF OB + FVG + premium level. Look for M5/M15 CHoCH confirmation only.
BUY ZONE
Entry: 3172–3180
SL: 3160
TP1: 3205
TP2: 3230
TP3: 3245
📌 Reason: Daily imbalance + H1 demand confluence + clean internal liquidity sweep expected.
🧭 Summary
Price is consolidating between 3172–3247. Upside capped by unmitigated OBs while downside is protected by a strong daily imbalance. NY may attempt a sweep into one zone before real move unfolds. Use patience — wait for CHoCH or BOS confirmation on LTF before entering.
📌 Important Notice!!!
The above analysis is for educational purposes only and does not constitute financial advice. Always compare with your plan and wait for confirmation before taking action.

Learn 3 Best Time Frames for Day Trading Forex & Gold
If you want to day trade Forex & Gold, but you don't know what time frames you should use for chart analysis and trade execution, don't worry.
In this article, I prepared for you the list of best time frames for intraday trading and proven combinations for multiple time frame analysis.
For day trading forex with multiple time frame analysis, I recommend using these 3 time frames: daily, 1 hour, 30 minutes.
Daily Time Frame Analysis
The main time frame for day trading Forex is the daily.
It will be applied for the identification of significant support and resistance levels and the market trend.
You should find at least 2 supports that are below current prices and 2 resistances above.
In a bullish trend, supports will be applied for trend-following trading, the resistances - for trading against the trend.
That's the example of a proper daily time frame analysis on GBPCHF for day trading.
The pair is in an uptrend and 4 significant historic structures are underlined.
In a downtrend, a short from resistance will be a daytrade with the trend while a long from support will be against.
Look at GBPAUD. The market is bearish, and a structure analysis is executed.
Identified supports and resistances will provide the zones to trade from. You should let the price reach one of these areas and start analyzing lower time frames then.
Remember that counter trend trading setups always have lower accuracy and a profit potential. Your ability to properly recognize the market direction and the point that you are planning to open a position from will help you to correctly assess the winning chances and risks.
1H/30M Time Frames Analysis
These 2 time frames will be used for confirmations and entries.
What exactly should you look for?
It strictly depends on the rules of your strategy and trading style.
After a test of a resistance, one should wait for a clear sign of strength of the sellers : it can be based on technical indicators, candlestick, chart pattern, or something else.
For my day trading strategy, I prefer a price action based confirmation.
I wait for a formation of a bearish price action pattern on a resistance.
Look at GBPJPY on a daily. Being in an uptrend, the price is approaching a key resistance. From that, one can look for a day trade .
In that case, a price action signal is a double top pattern on 1H t.f and a violation of its neckline. That provides a nice confirmation to open a counter trend short trade.
Look at this retracement that followed then.
In this situation, there was no need to open 30 minutes chart because a signal was spotted on 1H.
I will show you when one should apply this t.f in another setup.
Once the price is on a key daily support, start looking for a bullish signal.
For me, it will be a bullish price action pattern.
USDCAD is in a strong bullish trend. The price tests a key support.
It can be a nice area for a day trade.
Opening an hourly chart, we can see no bullish pattern.
If so, open even lower time frame, quite often it will reveal hidden confirmations.
A bullish formation appeared on 30 minutes chart - a cup & handle.
Violation of its neckline is a strong day trading long signal.
Look how rapidly the price started to grow then.
In order to profitably day trade Forex, a single time frame analysis is not enough . Incorporation of 3 time frames: one daily and two intraday will help you to identify trading opportunities from safe places with the maximum reward potential.
❤️Please, support my work with like, thank you!❤️
I am part of Trade Nation's Influencer program and receive a monthly fee for using their TradingView charts in my analysis.

Analysis of tariff policy pushing up inflation expectationsThis week, the market focused on three major focuses:
Trump's tariff policy, US-Iran nuclear negotiations and the Fed's interest rate decision. Tariff policy directly pushes up inflation expectations, weakens the purchasing power of the US dollar, and at the same time intensifies market risk aversion, which is doubly good for gold. If the US-Iran nuclear negotiations achieve a breakthrough, it may ease the geopolitical tensions in the Middle East and suppress the safe-haven demand for gold in the short term, but in the long run, if the negotiations are repeated or no substantive agreement is reached, gold is still expected to gain support. In terms of the Fed's interest rate decision, if it maintains a dovish stance, it will further suppress the US dollar to support gold.
Gold was closed last Friday due to the Good Friday holiday, and most markets were closed, and trading was light. However, the sharp correction of gold by $70 last Thursday did not change its long-term upward trend. In today's Asian session, the price of gold directly rose to break through the new high of 3396, and accelerated after breaking the previous high, setting a new historical high again. Both the monthly and weekly charts show a perfect upward trend, and technical indicators continue to rise, with long-term and medium-term bullish. At present, the upper resistance is at 3396-3400, and the lower support is at 3354-3349. The current operation recommendation is to buy on the pullback and sell on the rebound.
Operation strategy 1: It is recommended to sell on the rebound of 3396-3403, and the target is 3380-3360.
Operation strategy 2: It is recommended to buy on the pullback of 3355-3350, and the target is 3380-3400.

Gold prices soar as tariffs escalate!Yesterday, the gold market opened at 3230 and then fell back slightly to 3229.4. After that, it fluctuated upward all the way. After breaking through the integer mark of 3300 during the session, the US market accelerated its rise. The daily line reached a high of 3342.8 and then the market consolidated. The daily line finally closed at 3342.2 and the market closed with a basically saturated large positive line. After ending in this pattern, today's market still has bullish demand. In terms of points, it directly rose to 3355 at the opening and tried to short stop loss at 3361. The targets are 3341 and 3332. If it falls below, it will exit near 3328 and 3320 to prepare for daily level long orders.

Gold Falls Like Waterfalls (Bearish Gold)Hello Traders Here is my First Ideas About Gold Kindly Share your opinions About it.
XAUUSD (GOLD) Will Drop From Current area After making a new High Gold is ready to falls I have Simply Shared my opinions about Gold That price will drop to 3190 -91 which is also a strong support of the Week.
Keep Boost my ideas & Follow for timely updates.

XAUUSD - Liquidity Grab Before Pullback? | Key Zones MarkedGold (XAU/USD) is approaching a critical liquidity zone around the $3,330 level, which aligns with a strong Fibonacci extension area and previous structural highs. Price has shown an impressive recovery after hitting support below $3,000, triggering a bullish rally that reached our TP at $3,270 following a successful SL re-entry.
The price is currently tapping into a liquidity zone, with expectations of short-term rejection signals forming on the 1H time frame.
If we start to see 1H candle rejections or bearish divergence, we can anticipate a possible pullback towards the $3,140-$3,180 zone, which is a confluence of previous resistance turned support and a Fibonacci retracement level.
📌 Patience is key—wait for proper price action confirmation before entering shorts.

XAU/USD: A Huge Fall Ahead? (READ THE CAPTION)By re-examining the gold chart on the 30-minute timeframe, we can see that the price once again moved exactly as expected and finally managed to rise back above $3100, reaching as high as $3136.5! Currently, gold is trading around $3120, and I expect we will soon see further decline in gold. The potential downside targets are $3115, $3105, and $3100 respectively. This analysis will be updated again!
The Last Analysis :


RSI 101: Revealing the Special Characteristics of RSIWhy does RSI have support and resistance levels at 40 and 60?
Why does divergence happen between RSI and price?
What is RSI momentum?
All the characteristics of RSI (that I know) will be explained here.
Formula and Meaning
If you are using TradingView, you probably already know what RSI is and what "overbought" and "oversold" mean. So, I won’t repeat it here. Instead, I’ll dive deeper into the true nature of RSI, giving you a different perspective.
You can skip the mathematical formula of RSI, it’s already discussed everywhere online. Just remember this ratio table:
Here’s how I explain the table:
At RSI = 50, the average gain equals the average loss (I'll call this the buy/sell ratio). This is a balanced point. Buyers and sellers are equally strong.
At RSI ~ 60 (66.66), the buy/sell ratio = 2/1. Buyers are twice as strong as sellers.
At RSI ~ 40 (33.33), the buy/sell ratio = 1/2. Sellers are twice as strong as buyers.
At RSI = 80, the buy/sell ratio = 4/1. Buyers are four times stronger.
At RSI = 20, the buy/sell ratio = 1/4. Sellers are four times stronger.
The formula shows that when RSI reaches 80 or 20, the buyer or seller is extremely strong — about four times stronger — confirming a clear trend.
At these levels, some Trading strategies suggest placing a Sell or Buy based on the overbought/oversold idea.
But for me, that’s not the best way. The right approach is: when a trend is clearly formed, we should follow it.
I'll explain why right below.
Look at this chart showing RSI changes with the buy/sell ratio:
When RSI > 50:
When RSI < 50:
You can see that the higher RSI goes, the slower it climbs, but the high buy/sell ratio makes price move up faster.
Similarly, when RSI goes lower, it drops slower but price drops faster.
That’s why at overbought (RSI=80) or oversold (RSI=20) areas, you need to be careful. Even a small RSI moving can lead to big price changes, easily hitting your stop loss.
On the other hand, if you follow the trend and wait for RSI to pull back, you will trade safer and more profitably.
RSI Key Levels
Here are some special RSI levels I personally find useful when observing FX:XAUUSD :
(These levels are relative. They might vary with different timeframes or trading pairs. Check historical data to find the right ones for you. On bigger timeframes like M15 or above, the accuracy is better.)
RSI = 20
When RSI hits 20, sellers dominate. This confirms a trend reversal to bearish.
RSI = 80
When RSI hits 80, buyers dominate. This confirms a trend reversal to bullish.
RSI = 40
This is a sensitive level. Sellers start gaining the upper hand (sell/buy = 2/1).
If buyers lose 40, they lose their advantage.
So RSI >= 40 is "buyer territory". In an uptrend, RSI usually stays above 40.
RSI = 40 acts as support in an uptrend.
RSI = 60
Same idea. RSI <= 60 is "seller territory".
RSI = 60 acts as resistance in a downtrend.
40 and 60 are considered the key levels of RSI.
Now you guys know why RSI has support/resistance around 40/60!
RSI Range
As you know, RSI moves between 0 and 100.
Since RSI >= 40 is buyer territory, we can see the relationship between price and RSI:
When RSI stays above 40, price tends to move in an uptrend:
When RSI stays below 60, price tends to move in a downtrend:
When RSI stays between 40 and 60, buyers and sellers are balanced, and price moves sideways in a box:
When RSI is moving, It creates a RSI Range.
Whenever the trend switches between the three states — uptrend, sideways, and downtrend — a Range Shift is formed.
At first, RSI moves in 40-60 range, price moves sideways. A strong price move pushes RSI to 80. Later, RSI stays above 50, helping price grow strongly. When momentum fades, RSI returns to 40-60 and price moves sideways again.
Note:
RSI reflects Dow Theory by showing the stages of accumulation, growth, and distribution.
And as you see, when RSI touches key levels, the trend often pulls it back.
RSI Momentum
Price momentum means how fast price changes.RSI momentum represents the change in the strength between buying and selling forces.
When RSI > 50:
If price falls, RSI shows high momentum — RSI drops fast but price drops slowly.
If price rises, RSI shows low momentum — RSI rises slowly but price rises fast.
For example, at first RSI is above 50.
Price drops from (a) to (b) by 44 units, RSI drops from (Ra) to (Rb) by 25 units.
Later, RSI drops from (Rb) to (Rc) (also 25 units) but price drops from (b) to (c) by 73 units.
When RSI < 50:
If price falls, RSI has low momentum — RSI drops slowly but price falls fast.
If price rises, RSI has high momentum — RSI rises fast but price rises slowly.
RSI and Price Divergence
Divergence happens when price and RSI move in opposite directions:
Price goes up but RSI goes down, or vice versa.
Why does divergence happen?
In a strong downtrend, price forms a bottom at point (1), and RSI drops to level (r1).
When a price pullback happens, price pushes up to a peak at point (2), and RSI also bounces back to level (r2).
Because the downtrend is strong, after completing the pullback (1-2), price continues to make a lower bottom at point (3).
At this point, remember the behavior of RSI momentum when RSI is below 50:
It takes a large price drop (from 2 to 3) to cause a small RSI drop (from r2 to r3).
Meanwhile, even a small price increase (from 1 to 2) causes a large RSI rise (from r1 to r2).
Since the distance (1-2) is smaller than (2-3), but the RSI move (r1-r2) is bigger than (r2-r3), divergence is created.
Divergence shows that the current trend is very strong, not a complete signal of a trend reversal.
(I might share with you how to spot a complete RSI reversal signal in future posts.)
As shown in the example above, after forming bottom (5) and creating a bullish divergence between (3-5) and (r3-r5), price still kept dropping sharply while RSI kept rising.
In these areas, if you keep trying to catch a reversal just based on divergence, you will likely need to DCA or cut your losses many times.
That’s why the most important thing in trading is always to follow the trend.
RSI Exhaustion
RSI Exhaustion happens when RSI keeps getting rejected by a resistance or support zone and can’t break through.
After a strong downtrend, RSI recovers but stalls around the 5x zone.
It tries many times but fails, showing buying power is weakening.
Then the downtrend continues:
Exhaustion near high or low RSI levels creates stronger divergences than exhaustion in the middle range:
Double or triple tops/bottoms on RSI (M or W shapes) basically indicate RSI exhaustion.
RSI Can Identify Trend Strength
In an uptrend:
If RSI pulls back to a higher level before going up again, the trend is stronger.
The pullback should not fall too deep (below 40).
Example:
First rally: RSI drops to 60 before rising again → strong rally (273 units).
Second rally: RSI drops to 50 before rising again → weaker rally (94 units).
Same idea for a downtrend:
If RSI pullbacks to 50 then drops again, the downtrend is stronger than if it pullbacks to 60.
RSI Support and Resistance
Besides 40-60 acting as support/resistance, RSI also reacts to old tops and bottoms it created.
Why does this happen?
RSI is calculated from closing prices.
On a higher timeframe, the candle close price is a high/low or support/resistance price on lower timeframes.
When RSI moves in a trend on a higher timeframe, it maintains a buy/sell ratio, forcing lower timeframe RSI to oscillate within a range.
Example:
On H4, RSI stays above 40 → uptrend.
It makes H1 RSI move between 30-80.
Sharp RSI tops/bottoms react even stronger because they show strong buying/selling forces.
Summary
When looking at the price chart, we can see that price can rise or fall freely without any defined boundaries.
However, RSI operates differently: it always moves within a fixed range from 0 to 100.
During its movement, RSI forms specific patterns that reflect the behavior of price.
Because RSI has a clear boundary, identifying its characteristics and rules becomes easier compared to analyzing pure price action.
By studying RSI patterns, we can make better assumptions and predict future price trends with higher accuracy.
I have shared with you the core characteristics of RSI, summarized as follows:
Besides overbought (80) and oversold (20), RSI respects 40 and 60.
40 is support level in an uptrend. 60 is resistance level in a downtrend.
In an uptrend, RSI stays above 40.
In a downtrend, RSI stays below 60.
An RSI Range-Shift leads to a trend change.
RSI Divergence shows strong trends.
Double or triple tops/bottoms show RSI exhaustion → potential reversals.
The higher the RSI level, the slower it moves, but the faster the price rises.
The lower the RSI level, the slower it moves, but the faster the price falls.
A strong uptrend can be identified when RSI moves within a higher range or shows continuous bearish divergences.
A strong downtrend can be identified when RSI moves within a lower range or shows continuous bullish divergences.
RSI reacts to its old tops and bottoms.
Sharper RSI peaks show stronger selling.
Sharper RSI bottoms show stronger buying.
In the next parts, I’ll show you how to apply these RSI's Characteristics to trend analysis, multi-timeframe analysis, and trading strategies, that you might have never seen before.
I trade purely with RSI. Follow me for deep dives into RSI-based technical analysis and discussions!

XAU USD explained per request of one of my followersXAUUSD is a Futures Spot contract. it trades similarly to a stock or ETF or any stock market derivative. When the stock market is stressed as it is right now, then this futures spot offers potential swing to platform position trading opportunities.
Trade Wars are creating a very stress stock, bond, ETF, and commodities markets situation at this time. Gold is still considered one of the "Safe Haven" investments when the Stock, Bond or other financial markets are stressed and many retail investors are worried and are selling their investments or moving their 401k funds from one type of pension fund to another type that is a safe haven in their opinion.
Using a Spot requires Spatial Pattern Recognition Skills, an understanding of why and how professional traders include Proprietary Desk Traders, Floor Traders for the Buy Side or Sell Side, and Independent professional traders who trade in their home office. These professional side market participants use special order types that strike the penny spread and trade on the ATS venues which means you need to be able to read a stock chart as easily as you read a book or article on the internet as the Level 2 does not show their activity intraday. WHY?
1. Because the speed differential is massive. The Professional Side is trading on a millisecond scale. Retail transaction are required to be filled within 1 minute or less.
2, The lot sizes professionals sue nowadays are not 50,000 or 100,000. That is long gone. In order to make profits on the penny spread the average large not is 1 million to 50 million shares so you never see these orders as they transact on the ATS private venues.
3. Stop losses must be placed a value support levels. Never use percentages unless you are donating your capital to someone on the professional side. Your Broker is required to light all their orders before sending to their PFOF Payment for Order Flow Market Maker who pays your broker to send your orders to the MM.
Trade Wisely
Martha Stokes CMT

Technical indicators warn of the risk of a short-term correctionThe recent gold price has reached a record high, mainly driven by the escalation of global trade frictions and the expectation of the Fed's easing. Although the Trump administration has temporarily revoked tariffs on some goods, it has threatened to impose tariffs on automobiles, semiconductors and pharmaceuticals. The repeated policies have exacerbated the market's risk aversion. At the same time, the market expects the Fed to cut interest rates by 100 basis points in 2025, and the US dollar index has fallen to its lowest level since April 2022, further supporting gold prices.
Technically, gold prices are facing short-term correction pressure, with the key position below being supported by today's lowest point at 3312. If the opening high of 3344 is effectively broken above, it may rise to the 3358-3370 range again. In the medium and long term, trade uncertainty and expectations of monetary easing will still provide support for gold, but we need to be wary of the volatility risks brought about by policy easing or a rebound in the US dollar. Focus on key price breakthrough signals and respond flexibly to short-term fluctuations.
Gold recommendations for the evening: Go long at 3317-3312, with a target of 3340.

Gold hits record high again! Intraday gold trading analysisFundamentally, although risk sentiment improved at the beginning of this week, Trump's policy changes caused gold prices to fluctuate and adjust, but due to the lack of obvious and sustained negative prospects and the uncertainty in the market, gold prices continued to be stabilized by safe-haven demand and strengthened upward. In addition, last week's inflation data was lower than market expectations, which strengthened the prospect of the Fed's interest rate cut. In addition, the monthly chart of the US dollar index has gone out of the 2-year top divergence, suggesting that there is a large and sustained decline in the future market, as well as increased policy uncertainty, which will also provide long-term support for gold prices. Moreover, although the market also expects that tariff policies may push up inflation in the future, US consumer confidence deteriorated sharply in April, and 12-month inflation expectations rose to the highest level since 1981, but this will also enhance gold's anti-inflation appeal and push up safe-haven demand. It is also good for gold prices. Analysts specifically reminded that market liquidity may decline before the Good Friday holiday, and any sudden policy changes may trigger sharp fluctuations. Traders are waiting for the next major fundamental development to drive the gold market, but the technical chart is still bullish. There is still safe-haven demand in the market. Gold is a safe-haven asset in times of political and financial uncertainty. The dollar index was at a nearly three-year low on Tuesday, making gold relatively cheap for buyers holding foreign currencies. Investors are waiting for a speech by Fed Chairman Powell scheduled for Wednesday to look for clues related to interest rates. During the day, attention will be paid to data such as the U.S. retail sales monthly rate in March, the U.S. industrial output monthly rate in March, the U.S. NAHB housing market index in April, and the U.S. commercial inventory monthly rate in February. Although the retail data is expected to be bearish for gold prices, the subsequent overall data is bullish for gold prices. Therefore, the steady trend is still either volatile or continues to rebound and strengthen, and the operation is still biased towards low-multiple bullish.
Analysis of gold market trend:
Technical analysis of gold: Yesterday, the price of gold always fluctuated in the range of 3210 to 3233. At the opening of today, the price of gold broke through the fluctuation range in one fell swoop and showed an accelerated upward trend. So far, it has successfully refreshed the historical high and reached the 3285 line. Gold opened for risk aversion and directly broke through the new high. The short-term adjustment ended and finally completed the adjustment in a fluctuating manner. This kind of strong bullish market with a breakthrough will basically not have a big decline. Since gold has chosen to break upward, the decline of gold now is an opportunity to go long. The first thing to pay attention to now is the top and bottom conversion position of the support line 3245 below!
For intraday short-term trading, the first thing to pay attention to is the support strength near 3245. This position was the previous high point, and pay attention to its top and bottom conversion effect. Secondly, the support level near 3232 should not be ignored. This is the high point of yesterday's fluctuation range. Today's opening price broke through this position and accelerated upward. The top and bottom conversion support role of this position during the decline is worth paying attention to. The 1-hour moving average of gold has begun to turn upward. If the 1-hour moving average continues to diverge upward, the bulls will continue to exert their strength. After gold breaks through 3245, 3245 has formed a short-term support. Go long on dips when it falls back to 3245. The strength of a wave of gold is still there at that time. So after the surge, you must wait patiently for adjustments and continue to go long. Go long when it falls back to around 3248. It is particularly important to point out that the low point of 3211 during the US trading session yesterday is the key support level for the short-term market trend. Once the price effectively falls below this position, it is necessary to be alert that the market may launch a substantial adjustment. On the whole, the short-term operation strategy for gold today is to go long on pullbacks and short on rebounds. The short-term focus on the upper side is the 3285-3290 line of resistance, and the short-term focus on the lower side is the 3245-3240 line of support. Friends must keep up with the pace.
Gold operation strategy reference: Strategy 1: Short gold when it rebounds around 3280-3290, target around 3255-3250, and look at 3245 if it breaks.
Strategy 2: Long gold when it pulls back around 3245-3250, target around 3260-3275, and look at 3290 if it breaks.
