The market bullish trend continues, operation strategy.Driven by multiple favorable factors, the international gold price has continued to hit record highs this year, reaching $3,357/ounce by the close of last Friday. Although a technical correction signal appeared after hitting a record high last Thursday, it eventually closed above $3,320/ounce, with a real positive line on the weekly line and short upper and lower shadows, indicating that there is still inertial upward momentum this week. It is worth noting that while the market is expected to correct overbought at the end of the week, there are still funds that choose to buy on dips, resulting in a bottoming-out and rebound trend in gold prices last Friday, and finally closed at $3,327/ounce, further strengthening the bullish trend.
From the perspective of technical analysis, the correction on Thursday last week was supported at $3,284/ounce, which is more resilient than the previously expected $3,245/ounce previous high conversion support, so it can be adjusted to a short-term long-short watershed. The focus on the suppression effect of the historical high of $3,357/ounce is needed above. If there are major changes in the news over the weekend, especially in trade frictions and Fed policy expectations (such as Trump's remarks continue to pressure the Fed to cut interest rates), the probability of gold going up will be significantly increased.
Based on the current technical form and fundamental factors, this week's gold trading strategy recommends that the callback is mainly long, supplemented by short-term rebound short selling. In terms of specific operations, the first long order entry point can refer to $3310/ounce, which is both the ladder support level of the previous high callback and the technical retracement confirmation point. The stop loss can be set at $3290/ounce, and the target is $3389/ounce. If this resistance level is effectively broken, the upper space can be further expanded to the $3410/ounce area. Comprehensively judged, today's short-term operation of gold recommends callback long as the dominant idea, rebound short selling as an auxiliary strategy, focus on the pressure of the $3400-3420/ounce range above, and focus on the $3370-3360/ounce support level below.
XAUUSD.P trade ideas

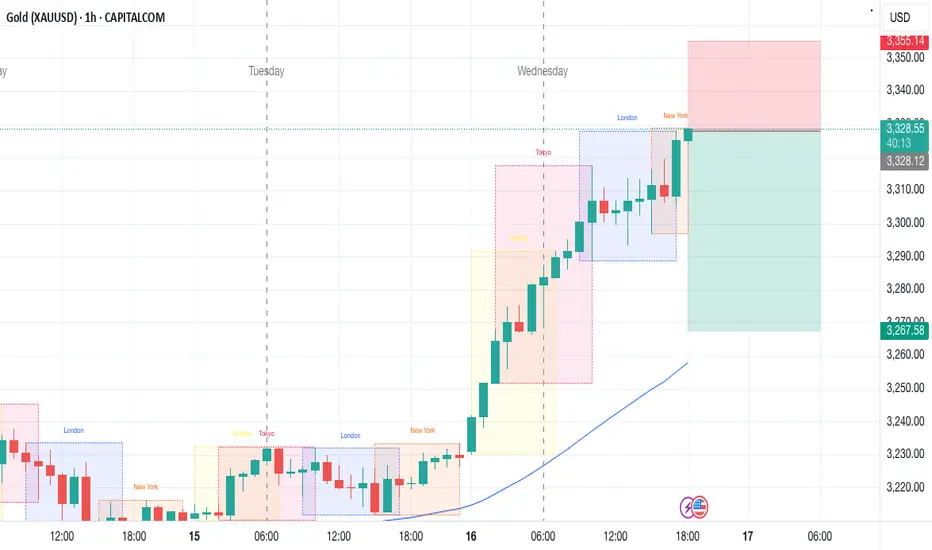
GOLD (XAUUSD): Support & Resistance Analysis For Next Week
Here is my latest structure analysis
and important support & resistance levels/zone on Gold for next week.
Consider these structures for pullback/breakout trading.
❤️Please, support my work with like, thank you!❤️
I am part of Trade Nation's Influencer program and receive a monthly fee for using their TradingView charts in my analysis.

Tariffs accelerate gold's peakGold's 1-hour moving average is still in a bullish arrangement with a golden cross upwards. The strength of gold bulls is still relatively strong. Pay attention to the next adjustment. Pay attention to the support of the 3185 line below, and then gold will fluctuate widely to complete the adjustment. Then gold may maintain a narrow range of fluctuations above 3200, and then seek a breakthrough. In this case, gold is still in a strong form, and there will be a rapid rise after the adjustment.
Investment strategy: Gold 3220 long, stop loss 3210, target 3260

12 April - Still BullishMovement is still very bullish, and there is no reason price will not continue going up. I do see the need for a retracement. This is not a prediction, but technical analysis possibility.

strong bullishIt seems like gold hasn't made WCL yet, there's still a big possibility for a new ATH again.
admin's view for tonight

Correction down after overbought - buying opportunity at good pr🔔🔔🔔 Gold news:
➡️ Gold entered a bullish consolidation phase after reaching a new high on Thursday. A modest rebound in the U.S. dollar and improved risk appetite in the markets limited further gains, especially as the precious metal remains in overbought territory.
➡️ This week’s record-breaking gold rally has been largely driven by the intensification of U.S.-China trade war and ongoing uncertainty over the potential implementation of U.S. tariffs on all major trading partners.
➡️ Rising demand for safe-haven assets, persistent concerns over a possible U.S. economic slowdown, and growing market bets on a Federal Reserve rate cut have continued to support the XAU/USD pair, helping to sustain gold's upward momentum.
Personal opinion:
➡️ The upward trend in the price of golden yellow tubers is still intact, however there will be a decline after yesterday's overbought.
➡️ Watch for strong technical zones to earn good profits for you
➡️ Analyze based on important support resistance zones and Fibonacci combined with EMA and trend lines to come up with a suitable strategy
Plan:
🔆Price Zone Setup:
👉Buy Gold 3308– 3310
❌SL: 3303 | ✅TP: 3315 – 3320- 3325
👉Sell Gold 3388– 3390
❌SL: 3395 | ✅TP: 3383 – 3378 – 3370
FM wishes you a successful trading day 💰💰💰

XAUUSD 4th Week on April 2025Bullish trend still upthere, next week it will continue to reach 3400 even 3500 ?
Good Luck

GOLD.. alternate still buying scnerios, what's next??#GOLD.. well market have single supporting area that is around 3226
Keep close that area because that is our single supporig area and if market thold in that case further bull run is still valid.
Note: we will cut n reverse our position below 3226 on confirmation .
Good luck

New peak of $3,520! Waiting for gold price to reach.
New peak of $3,520! Six major events this week detonated gold prices, waiting for gold prices to hit
📌 Driving events
1. Geopolitical black swans fly frequently
The tariff war between China, the United States and Europe has escalated comprehensively. The United States has imposed a 104% tariff on China (involving rare earths, semiconductors and other fields), and the European Union has implemented a 21 billion euro retaliatory tariff. The World Bank predicts that global GDP growth may fall by 1.8%. The situation in the Middle East continues to deteriorate. After the breakdown of the US-Iran nuclear negotiations, Israel launched an air strike on Iran's nuclear facilities, pushing gold to rise by more than 3% in a single day. Historical data shows that the average increase in gold during geopolitical crises can reach more than 20%.
2. The Federal Reserve may change its coach
US President Donald Trump once again criticized Federal Reserve Chairman Jerome Powell, exacerbating concerns about the independence of the central bank, which has exacerbated uncertainty. Reports that the US government is exploring legal means to remove Powell will only deepen market uneasiness and enhance the attractiveness of gold as a tool to hedge policy and economic instability risks.
3. Global central bank gold purchases hit a record high
In 2024, global central bank gold reserves reached 4,974 tons, and China increased its holdings to 73.7 million ounces for 20 consecutive months (accounting for 4.9%). From January to April 2025, the central bank's net gold purchases exceeded 420 tons, accounting for more than 25% of the annual demand. After China's insurance funds enter the market, it is expected that 255 tons of new demand will be added each year.
4. Gold ETF funds are pouring in
In the first quarter, global gold ETF funds inflow exceeded US$5 billion, and SPDR's daily inflow reached 226.5 tons (a three-year high). The asset management scale of domestic gold ETFs exceeded 101 billion yuan, and the holdings increased to 138 tons. The holdings of post-00 investors surged by 300%.
5. Inflation and stagflation expectations are rising
The US CPI rose 3.5% year-on-year in March, and the core PCE price index hit a 32-year high. The risk of economic "stagflation" strengthened the anti-inflation properties of gold. Citigroup's model shows that if inflation is higher than 3% for a long time, the probability of gold price breaking through $3,500 is over 60%.
6. Technical breakthrough triggers resonance
After spot gold broke through the key resistance level of $3,250, it triggered programmatic buying, and speculative long positions accounted for 67%. COMEX gold futures open interest surged 18%, and the premium of the main Shanghai gold contract expanded to 5 yuan/gram, reflecting the strong bullish sentiment in the market.
📊Comment Analysis
Geopolitical tensions, rising prices, trade tensions, gold prices benefit
💰Strategy Package
Long positions:
Actively participate at 3480-90 points, profit target above 3510-20 points
Short positions:
Actively participate at 3510-00 points, profit target below 3475-65 points
⭐️ Note: Labaron hopes that traders can properly manage their funds
- Choose the number of lots that matches your funds
- Profit is 4-7% of the fund account
- Stop loss is 1-3% of the fund account


XAUUSD 30M CHART PATTERNThis chart shows a gold trading setup (CFDs on Gold - US$/OZ) on a 30-minute timeframe. Here’s a quick breakdown:
Trend Direction: Strong uptrend with a series of higher highs and higher lows.
Entry Point: The second green arrow indicates a breakout confirmation after a small pullback, suggesting a buy entry.
Stop Loss: Set just below the breakout level (in red zone) to limit potential losses.
Take Profit: Target is marked in the green box above, projecting the move upward based on previous price action.
Risk-Reward Ratio: Favorable — the green (reward) zone is larger than the red (risk) zone.
The pattern looks like a bullish flag breakout, suggesting continuation of the prior upward momentum.
Are you trading this setup or just analyzing it?

Gold fulfills weekly review expectations, Go long on the declineGold opened higher and continued to set new highs with strength, which is in line with our weekly review ideas and expectations. The weekly line closed with a full big positive, and there are still high points to be seen this week. After breaking the high on the daily line, it also continued to rise, and the shape remained strong. Before there is a high test and fall back, the short-term will continue to force a short rise, constantly setting new highs, and will not give the bears any breathing room. Therefore, the long idea remains unchanged this week. In the 4H cycle, it rebounded and strengthened relying on the middle track. The middle track support is at 3286, but the strong trend makes it difficult to have a large retracement space. The intraday short-term support remains at 3346, and if it is extremely strong, pay attention to the top and bottom support of 3358. In terms of operation, go long according to the strength of the decline, and gradually look up to 3380 and 3400. Short-term volatility increases. The specific layout is combined with the shape, and the notice before the market opens shall prevail!
Operation suggestion: Go long near gold 3346-3340, look at 3380, 3400! If it is very strong, buy gold at 3360-55!

Will gold still rise after correction? Market analysis referenceAnalysis of gold market trend:
Technical analysis of gold: Today in the Asian session, gold directly rushed to the 3357 line, continuing the previous upward trend. The spot gold price in the Asian session has once again hit a record high, breaking through $3350 for the first time. The US dollar index fell close to a three-year low, triggering a sharp rise in market risk aversion, pushing up gold prices. The current basic trend of gold rising has not changed, and the bulls are strong. However, from the perspective of time nodes, even if you are bullish today, you must pay attention to the adjustment space at any time. The Asian session hit a high and fell back, and the European session did not continue to rise but fluctuated and fell. Attention should be paid to the second bottoming out in the evening. In addition, the market will be closed tomorrow, Friday, and will not open normally until next Monday; therefore, today, Thursday, we must do a good job of risk prevention; such as short positions, such as adjusting positions, and so on.
In the short term, gold is now likely to start a large range of fluctuations again. The 1-hour inverted V trend has begun. Gold will either start a large range of fluctuations or make adjustments. If there is no support from bullish news in the short term, then the short-term gold bulls may be suppressed. Due to the rest tomorrow, do less and wait and see. Gold will be operated next week in combination with the news over the weekend. The recent market has been ups and downs, and I can finally take a good rest for three days to relax the tense atmosphere. The recent ups and downs of gold are like an electrocardiogram, which affects the hearts of everyone who pays attention to gold. It is mainly too active. Maybe you drink a sip of tea and smoke a cigarette, and gold goes back and forth for more than ten US dollars. So, don't be too bullish today. If you are bold, go short, and if you are prudent, just watch the show! Overall, today's short-term operation strategy for gold is mainly to go short on rebounds, and to go long on pullbacks. The short-term focus on the upper side is 3315-3320 resistance, and the short-term focus on the lower side is 3245-3285 support. Friends must keep up with the rhythm.
Gold operation strategy reference: short gold rebounds near 3315-3320, target near 3295-3285, and look at the 3245 line if it breaks.
Strategy 2: Go long on gold pullbacks near 3280-3285, target near 3305-3315, and look at the 3320 line if it breaks.

Upward Potential - Anymore?The bullish bias has been in full swing for over a week now, pushing prices to unprecedented highs. Retail traders seem thrilled to ride the uptrend.
The big question remains: how high can TRADENATION:XAUUSD go? No one truly knows until it unfolds. Make informed decisions for yourself—avoid relying too much on others, as we all have equal access to these price levels.
For now, keep a close watch on the levels indicated in the chart above. Hopefully, this will be helpful to those who need it.
Remember, trading carries significant risks, including the possibility of liquidation. Manage your risk wisely in proportion to your equity size. Enter trades only when prices confirm your strategy. Rushing or chasing trades often leads to losses. Stay vigilant and trade responsibly.

The latest analysis and operation suggestions of gold in the dayGold prices have been rising since the opening today. It is only a matter of time before it breaks through 3400. From a technical perspective, the MACD golden cross has appeared, and the gold moving average continues to radiate upward, indicating that the bulls are strong. But at the same time, the RSI indicator has entered the overbought zone, and short-term profit-taking may be possible. All retracements are opportunities to go long. It is currently not recommended that you pursue long positions and wait patiently for retracement trading opportunities. Pay attention to the 3400-3420 resistance level on the top and the 3370-3360 support level on the bottom. If it breaks through, pay attention to the second support level of 3345
Operation strategy 1: It is recommended to go short at 3396-3403 on the rebound, stop loss at 3410, and the target is 3380-3360.
Operation strategy 2: It is recommended to go long at 3355-3350 on the pullback, stop loss at 3343, and the target is 3380-3400.
If you agree with this point of view, or you have a better idea, please leave a message in the comment area. I look forward to hearing different voices.
OANDA:XAUUSD CAPITALCOM:GOLD FOREXCOM:XAUUSD FX:XAUUSD


GOLD'S CRITICAL DECISION ZONE: The $100+ Swing Play of the Week!The Golden Opportunity That Elite Traders Are Watching NOW 💰
The 4-hour Gold chart reveals a masterfully developing technical setup that demands immediate attention. This isn't just another gold analysis—it's the precise roadmap for what could be the most significant price swing of April 2025.
🔍 TECHNICAL PRECISION POINTS:
⚜️ Expanding Channel Perfection
- Gold trapped within pristine ascending channel (purple boundaries)
- Current price ($3,320.925) testing first support zone
- Channel width expanding—signaling increased volatility ahead
⚜️ Two Critical Consolidation Zones
* Historical accumulation zone ($3,220-$3,245) provided springboard for recent rally
* Current decision zone ($3,300-$3,330) serving as near-term battleground
* Both zones perfectly align with channel support tests
⚜️ Predictive Blue Path Analysis
* Forecasting tactical pullback to $3,225 (channel support confluence)
* Subsequent powerful reversal targeting $3,320+ retest of highs
* Final move potentially challenging the $3,357.775 all-time high
The STRATEGIC ADVANTAGE Most Traders Will Miss
This pattern isn't just about direction—it's about precision timing. The blue forecast line reveals a classic "shake-and-bake" pattern that institutional traders use to accumulate before significant moves.
🔱 Why This Week Is Different:
* April 21-27 window represents peak volatility zone
* Volume profile showing 40.31K contracts with diverging price action
* Bullish bias maintained despite -0.47% daily change (distribution, not weakness)
🔱 The $100+ Opportunity:
Traders positioned at channel support could capture the entire $100+ swing from lower support (~$3,225) to upper resistance (~$3,330), representing a potential 3% move—extraordinary for gold's typical volatility profile.
The EXECUTION BLUEPRINT For Maximum Gain 📊
1. Primary Entry Zone:$3,225-$3,235 (channel support confluence)
2. Conservative Stop: Below $3,210 (channel break invalidation)
3. First Target:$3,275 (mid-channel equilibrium)
4. Final Target: $3,320-$3,330 (upper resistance retest)
{ Risk:Reward = 1:3.5 at minimum } 🚀
The Hidden Geopolitical Catalyst
The technical setup coincides perfectly with next week's critical economic data releases and geopolitical tensions—creating the perfect storm for gold's next explosive move. FOLLOW ME 🔥

XAUUSD 15minutes Forecast Hello guys I hope you're well hopefully, you have made a good profit from our prediction, so let us tell you that today, in our 15-minute time frame, our candle has become bearish/mean 3345, where our target will be bullish mean 3310

Bulls meet risk aversion to set new highsFrom the 4-hour analysis, the current gold bulls continue to sprint. For the time being, we will focus on the short-term suppression of 3290 and 3300 on the upper side. We will focus on the short-term support of 3268-70 on the lower side. The operation is mainly to go long when the price falls back.
Gold operation strategy:
1. Go long when the price falls back to 3268-3270, and add more positions when the price falls back to 3245. Stop loss is 3237, and the target is 3335-3345. Continue to hold if the price breaks through.

Gold Intraday Trading Plan 4/22/2025Gold has been in the bullish trend for a while and there is no sign of slowing down at this moment. However, as explained in my weekly summary and forecast, I do expect it to correct this week. I am looking for selling opportunity from channel top around 3450. 1st target is channel bottom at around 3358. 2nd target is at 3275.

The relentless growth of goldDescription
Given the strong breakout of last week's high and the conversion of the resistance zone into support, the price is expected to continue towards 3450-3460 after a pullback to 3358.
Of course, with this strong trend, a pullback may not occur.
Unfortunately, my trade(BUY POSITION) entry point did not occur in the previous position and gold performed much stronger than I had anticipated at the beginning of the week.
Possible positions this week
A:Suitable prices for BUY positions
1)3358-3347
B:Suitable prices for SELL positions
1)3398~3408
( This high-risk trade is still active )
This is just an analysis and everyone is responsible for their own work.
Hoping for a good and profitable week.

Today's gold analysis strategyThe gold market has experienced significant price fluctuations and corrections. From a technical perspective, the overbought correction has already arrived. The price of gold has deviated significantly from its short-term moving average, strongly suggesting that a correction is needed to complete the technical adjustment. The current correction is not a simple unilateral decline.
From a fundamental perspective, the underlying support for gold remains rock solid. Geopolitical risks, especially the continued escalation of the tariff standoff, have maintained strong demand for safe-haven assets. Therefore, this price adjustment should be regarded as a typical correction following the previous sharp rise.
Buying price: 3290 - 3295
Target price: 3320 - 3330
