Daily live trade with XAUUSD in 15m/30m/1h 20250417Daily live trade with XAUUSD in 15m/30m/1h 20250417
XAUUSD.P trade ideas

XAUUSD intraday sellRetracements from new high are eminent, unless fundamentals sponsor a continuation higher

Keep buying gold!Hello, traders
Gold make a correction and still looking for a strong support, to make a bullish continuation.


GOLD has broken the upper resistance - pullback predictionIt is clear that GOLD is in a very bullish trajectory, however before this peak, the pullback was very mild.
I am suspecting we might be see a bigger pullback now
My prediction is 3184 or maybe a bigger one 3056
What do you guys think?

XAUUSD SHORTSolid market moves the past few days, I thought it was going to continue and it was safe because market started to stabilize again. However, as expected, one word from Trump and made the market spiraling again. Because of the hold on tariff announcement, we are now back to 3170 level again. Howver, for me, moves like these are always good opportunity for retracement. Opening at 3170// first TP at my prev opening then final at 3000 so we can still be in profit and croos out the previous one. setting a long SL on this one just to be sure at 3270. Let's see how this rolls
Day210f100
L:6
W:5

Short Term Retracement - Next Target is 3310🔔🔔🔔 Gold news:
➡️ Gold prices continued to hit fresh record highs during Wednesday’s Asian trading session, approaching the significant $3,300 mark. Persistent concerns over an escalating U.S.-China trade war and fears of a U.S. trade war economic recession amid ongoing tariff turmoil has continued to boost demand for the non-yielding yellow metal.
➡️ Another major factor driving funds into gold is the growing speculation that the Federal Reserve will soon resume its rate-cutting cycle, potentially reducing borrowing costs four times this year. Meanwhile, the prospect of aggressive Fed easing policy has failed to attract buyers to the U.S. dollar or trigger any meaningful rebound from its lowest level since April 2022, which was reached last week. As a result, gold prices remain well-supported and appear largely unaffected by minor overbought conditions on the daily chart.
Personal opinion:
➡️ Gold's RSI enters the extreme overbought zone and will have a short-term correction. Therefore, you can wait for technical recovery zones to buy gold at a good price
➡️ Note: Limit selling gold because currently the Fomo of the buying side is very large, so selling will be very risky
➡️ Analyze based on resistance - support zones and EMA combined with RSI to come up with a suitable strategy
Plan:
🔆Price Zone Setup:
👉Buy Gold 3246 -3248
❌SL: 3240| ✅TP: 3254 - 3259 - 3265
👉Sell Gold 3310 -3312
❌SL: 3317| ✅TP: 3305 – 3300 – 3295
FM wishes you a successful trading day 💰💰💰

Gold reached 3275 and will continue to move towards new highs
📌 Driving Events
Kitco Metals senior analyst Jim Wyckoff pointed out: "The gold market is waiting for new catalysts, but the technical side remains strong and the safe-haven demand remains solid." It is worth noting that the US government has recently launched an investigation into the import of drugs and semiconductors in preparation for the imposition of tariffs. Trump has also made it clear that the details of the semiconductor import tariff will be announced this week.
💢 Investors please pay close attention to the following key events:
Fed Chairman Powell's speech on Wednesday (interest rate policy orientation)
US retail sales data on Wednesday
ECB interest rate decision on Thursday (expected to cut interest rates by 25 basis points)
Specific implementation details of Trump's tariff policy
📊Comment analysis
In my previous post interpretation, I suggested that the gold price should be sideways, waiting for the price to continue to rise to a new high. Today, Wednesday (April 16), the Asian market broke a new high as expected in the early trading. As of now, the gold price is $3275
Now after two days of adjustment, the gold price has broken through again, and the resistance level of 3255 has also turned into support. The next step is 3280 and 3300.
Follow the trend, participate in one direction, and continue to be long today.
💰Strategy Package
Long position:
Actively participate at 3270-3275 points, profit target above 3295 points
Steady participation at 3250-3260 points, profit target above 3280 points
⭐️ Note: Labaron hopes that traders can properly manage their funds
- Choose the number of lots that matches your funds
- Profit is 4-7% of the fund account
- Stop loss is 1-3% of the fund account


XAUUSD: 15/4 Today’s Market Analysis and StrategyGold technical analysis
Daily chart resistance 3300, support below 3176
Four-hour chart resistance 3250, support below 3190-3150
One-hour chart resistance 3250, support below 3210
Gold news analysis: Gold prices remained above 3200 on Monday, indicating that the overall market sentiment is still cautiously optimistic. The main factors driving this round of market conditions include uncertainty in the global trade environment, a weaker dollar, and continued warming of safe-haven demand. During the session, investors' reactions to the latest tariff remarks intensified gold price fluctuations, but fundamental and technical support remained solid, and the strong pattern of gold did not show any significant shakes. The trend of the US dollar played an important role in this round of gold price fluctuations. The US dollar index hit a three-year low, making gold denominated in US dollars more attractive to overseas buyers. Behind the weakness of the US dollar, there are both market concerns about the outlook for the US economy and the drive of diversified reserve needs of global central banks. Analysts from well-known institutions said that the weakening of the US dollar and global economic uncertainty constituted a solid support for gold prices. In addition, the global central bank's demand for gold purchases remains strong. Since the beginning of this year, many central banks have continued to increase their gold reserves to cope with potential currency fluctuations and geopolitical risks.
Gold operation suggestions: Gold opened lower yesterday and touched 3209 and then began to rise. It reached the historical high of 3245 again and then began to adjust and adjust. It retreated slightly in the European session and continued to accelerate in the US session. It bottomed out and began to rise after reaching 3193.
From the current trend analysis, today's upper short-term resistance focuses on the 3250 mark, and the lower support focuses on the one-hour level 3210 and the four-hour level 3190 support. In terms of operation, continue to buy in line with the trend when stepping back to this position. At the same time, gold is currently in a severely overbought state and beware of a sharp correction.
Buy: 3210near SL: 3205
Buy: 3190near SL: 3185

XAUUSD/GOLD Intraday Move 22-04-2025📊 XAUUSD Trade Setup – April 22, 2025
Analysis: Price is currently in a corrective bearish move after a strong bullish rally. We're seeing clear signs of a potential bullish reaction around key support zones. Two major demand zones are identified:
Zone 1: 3430 – 3435
Zone 2: 3405 – 3410
These zones align with previous consolidation areas and coincide with the lower Bollinger Band, increasing the probability of a bounce.
Expected Price Action:
A potential drop into the 3430–3435 zone may trigger a bullish reaction.
If this level fails to hold, the second strong buy zone lies between 3405–3410.
From either zone, a reversal and bullish continuation towards the 3460–3475 region is expected.
📈 Buy Signal:
Buy Entry #1: 3430–3435
SL: 3417
TP: 3460
Buy Entry #2: 3405–3410
SL: 3393
TP: 3460+
🔁 Wait for bullish confirmation (e.g., bullish engulfing or pin bar) before entering.
Kindly hit like, follow, like and comment.

The Gold Will Make a new All Time HighHello Traders
In This Chart GOLD HOURLY Forex Forecast By FOREX PLANET
today Gold analysis 👆
🟢This Chart includes_ (GOLD market update)
🟢What is The Next Opportunity on GOLD Market
🟢how to Enter to the Valid Entry With Assurance Profit
This CHART is For Trader's that Want to Improve Their Technical Analysis Skills and Their Trading By Understanding How To Analyze The Market Using Multiple Timeframes and Understanding The Bigger Picture on the Charts

Gold After chart all target successfully achieve3327 to 3500 All to successfully done
Next gold target don't miss it
Not financial advice trade and menege your owner risk

Will the price of gold collapse today? NoWill the price of gold collapse today? No
When an avalanche occurs, no snowflake is innocent
When gold falls, no long player is innocent
As shown in the four-hour cycle:
In order to make everyone feel the changes in trends and emotions more intuitively,
I have drawn almost all the center dividing lines.
The current gold price is approaching $3,500,
The trend line has changed from 1-6 lines, and the rise has been out of control.
But the more this trend continues in the short term, the more it means that the rise in gold prices has deviated from the fundamentals.
It is more like a product of emotional catalysis.
Everything will reverse when it reaches the extreme.
Such a trend indicates that a wave of selling is coming.
I am not asking you to short,
but reminding you to be alert to the super waterfall callback that may occur at any time.
We have made a profit of nearly 500 points from 3,000 points to now. As a professional trader, I have only made less than 200 points in the past two weeks.
This means that I am always worried about the huge pressure brought by high-level selling.
At present, no matter from the perspective of structure, support level, increase, volume, ratio, angle, channel and other indicators, the price of gold has completely exceeded the expected rise.
Yesterday I expected it to rise to 3450 points, and today it is close to 3500 points.
Next, I think waiting is the wisest choice.
Of course, you can try to short with a light position near 3500. Please keep a light position and set a stop loss.
Current support level: 3400-3440--3470
Old rules:
As long as the price of gold is higher than 3440, there is only one choice: continue to go long, wait for a decent waterfall as much as possible, and then go long at a low price.
If you have a different opinion, you can leave me a message and we will discuss it together

'XAUUSD' This week Overview and Today Forecast Description
According to my this week Gold TA .
As you can see Market is properly respecting a uptrend here which I have marked from 2967 till Now at 3486
We can see How previously it is reacting on trend lines
Most probably here we can see a descent bearish move and I don't wanted to miss it
See you after some hours to get a good position to enter in
Leave your thought in comment section below 👇
See you soon
#XAUUSD #GOLD #FOREX

XAUUSD H4 | Bearish Drop in the short termBased on the H4 chart analysis, we can see that the price is testing our sell entry at 3479, aligning with the 261.8% Fibo extension.
Our take profit will be at 3415.26 , a swing low support.
The stop loss will be placed at 3524.53.
High Risk Investment Warning
Trading Forex/CFDs on margin carries a high level of risk and may not be suitable for all investors. Leverage can work against you.
Stratos Markets Limited (tradu.com):
CFDs are complex instruments and come with a high risk of losing money rapidly due to leverage. 63% of retail investor accounts lose money when trading CFDs with this provider. You should consider whether you understand how CFDs work and whether you can afford to take the high risk of losing your money.
Stratos Europe Ltd (tradu.com):
CFDs are complex instruments and come with a high risk of losing money rapidly due to leverage. 63% of retail investor accounts lose money when trading CFDs with this provider. You should consider whether you understand how CFDs work and whether you can afford to take the high risk of losing your money.
Stratos Global LLC (tradu.com):
Losses can exceed deposits.
Please be advised that the information presented on TradingView is provided to Tradu (‘Company’, ‘we’) by a third-party provider (‘TFA Global Pte Ltd’). Please be reminded that you are solely responsible for the trading decisions on your account. There is a very high degree of risk involved in trading. Any information and/or content is intended entirely for research, educational and informational purposes only and does not constitute investment or consultation advice or investment strategy. The information is not tailored to the investment needs of any specific person and therefore does not involve a consideration of any of the investment objectives, financial situation or needs of any viewer that may receive it. Kindly also note that past performance is not a reliable indicator of future results. Actual results may differ materially from those anticipated in forward-looking or past performance statements. We assume no liability as to the accuracy or completeness of any of the information and/or content provided herein and the Company cannot be held responsible for any omission, mistake nor for any loss or damage including without limitation to any loss of profit which may arise from reliance on any information supplied by TFA Global Pte Ltd.
The speaker(s) is neither an employee, agent nor representative of Tradu and is therefore acting independently. The opinions given are their own, constitute general market commentary, and do not constitute the opinion or advice of Tradu or any form of personal or investment advice. Tradu neither endorses nor guarantees offerings of third-party speakers, nor is Tradu responsible for the content, veracity or opinions of third-party speakers, presenters or participants.

April 22, 2025 - XAUUSD GOLD Analysis and Potential OpportunitySummary:
Bullish momentum remains strong. The strategy for today continues to be: buy on pullbacks to support.
Key Levels to Watch:
3450–3455: Bullish target zone
3436: Support
3431: Support
3425: Support
3419: Support
3413: Support
👉 If my insights have been helpful to you, or if you traded based on my ideas, please consider giving a like — it’s a great encouragement for me! Thanks for your support!
Disclaimer: This is my personal opinion and not financial advice. Please manage your risk accordingly.

XAUUSD Gold has continued its upward trend and is expected to perform bullish since there are no indications ,so far, of its reversal to downtrend.

XAUUSD (Gold) Looks Strong Bullish .Hello Guys Here is My XAUUSD (Gold) Signal Update .
Gold Will Continue Its Bullish Trend Currently Its running at 3425-20 I can expect if its breaks 3452-53 it will Fly to 3480-3485
Gold Can Retrace From Support Area.
Boost And Comments On my ideas And Share your feedback About it.

Gold analysis strategy today- Bullish Channel as an Corrective Pattern in Short Time Frame
- Change of Characteristics
- RSI - Divergence
- Completed " 12345 " Impulsive Waves
- Rising Wedge

XAUUSD bullish wedge This week opened at the 3320's zone followed by a strong bullish wedge. As at the time of this publish, gold is currently at the 3380's zone and we aim to see gold at the 3400's if this bullish momentum holds .Following the analysis also, we still have potential for more bullish pumps as we are yet to hit the 50% trend channel
Further analysis would be given as the market chooses its path

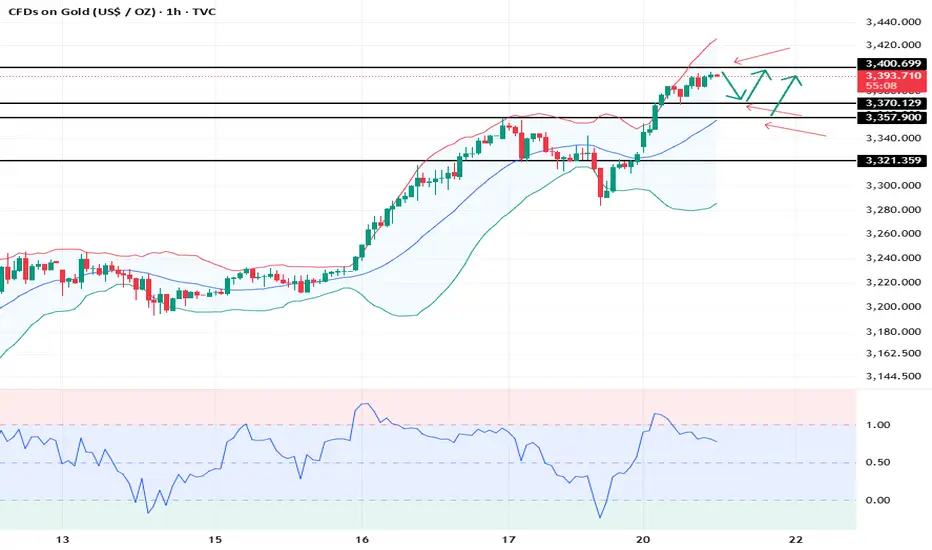
XAUUSD: 21/4 Today’s Market AnalysisGold technical analysis
Daily chart resistance 3400-3450, support 3320
Four-hour chart resistance 3400, support 3358
One-hour chart resistance 3400, support 3370
On the first trading day after the holiday, risk aversion continued to drive gold up, with a daily increase of more than 2%, and is about to reach the bull psychological target of 3400 integer mark. The Stochastic indicator is currently overbought, and if it fails to break through 3400, it may trigger a short-term correction.
If the price quickly falls below 3350, it will turn into a bearish trend. COMEX gold futures positions have reached a new high, and we need to be wary of long profits in the NY market that trigger selling.
Gold touching the 3400~3410 range may trigger a rapid correction. It has risen quickly recently, and it has also fallen quickly, and the amplitude is large. Therefore, it is not recommended to chase the high near 3400, and wait for the correction to stabilize near 3358 before buying.
Xauusd SellsGold has rallied hard on asia open. I'm anticipating a sell if London volume is low.
If 15 min candle closes below 3380 than sell with tp 1 @ 3372
Tp2 @ 3368
Tp3 @ 3356
Sl 2% risk.
