Gold prices fluctuate sharplyAt present, spot gold is crazy, and the craziest period in gold history is still inferior. On January 21, 1980, spot gold soared by more than $160 on the same day, from the lowest peak of $685/ounce to $850, and then plummeted by more than $100, forming a 30-year peak. On April 12, 2013, the highest was 1565 and the lowest was 1480, a single-day drop of $85; on April 15, the highest was 1496 and the lowest fell to 1336, a single-day drop of $160, and a sharp drop of nearly $230. With the further development of the tariff war, it is expected that in the next 1-2 weeks, the rise of spot gold will be even crazier, and the decline will refresh the historical peak again!
XAUUSD.P trade ideas

THE KOG REPORT - UpdateEnd of day update from us here at KOG:
That worked pretty well!
We gave the path yesterday for the potential move up on open and the target level we would be looking for which was 600pips away. Market opened, straight into the target level! It's there we got a small RIP but nothing significant so we decided to wait as Excalibur activated. That gave some traders an opportunity to long again into the target which is where we shared the RIP captured for the short.
We're still not re-testing that level which could mean support below holds at the 3406-10 region and we see a retest of that 3430-35 level during the session to come. It that level again that needs to be watched with the extension of the move into 3450-55 which is now open!
As always, trade safe.
KOG

#XAUUSD: Possible Easy 600+ Pips Buying OpportunityFollowing a substantial decline in gold prices, which dropped more than 1000 pips, there is a possibility that the price may experience a minor correction before resuming its downward trajectory. It is imperative to acknowledge that trading gold in the current market conditions carries significant risks, and there is a substantial likelihood of incurring substantial losses.
Good luck and trade safe!

Gold 2025: The Asset of Last Trust - Deep Research by EXCAVOThe Influences on Gold Prices in 2025
As of 2025, gold continues to assert its status as a safe-haven asset, with prices accelerating dramatically. This surge is driven by economic uncertainties, increased central bank demand, and geopolitical tensions. The analysis focuses on the multifaceted factors influencing gold prices, including inflation fears, a declining U.S. dollar, and recent debates surrounding Fort Knox's transparency.
I've delved a bit into the gold landscape and will provide ideas here aimed at helping investors and analysts navigate the complexities of the gold market.
The Current Economic Climate and Its Impact
Recent developments in global economic conditions have laid the groundwork for significant fluctuations in gold prices in 2025. Economic volatility, primarily driven by fears of inflation and weakening currencies, has led investors and central banks to increasingly view gold as a reliable hedge against financial instability. The aftermath of trade disputes, particularly between major economic powers, has further intensified these economic shifts.
Globally, economic growth forecasts for 2025 have been downgraded significantly. According to Fitch Ratings, the world economy is expected to grow by just 2.3%, down from previous estimates of 2.9%. This deceleration is attributed to extensive tariffs imposed by the United States, leading to broader global economic uncertainty. The United States itself is seeing a contraction in growth expectations, with projections cut to 1.7% amid these tensions. Inflation in the U.S., driven by increased tariff costs, is another immediate concern, marking a sustained presence at around 3%
The U.S. dollar, although currently strong, is predicted to depreciate due to ongoing inflation and economic stagnation, despite current high real trade-weighted indices—the highest since the 1980s. This depreciation trend, anticipated by analysts, could significantly impact currency markets worldwide, putting pressure on countries with high dollar exposure S&P Global.
In this environment of weakening currency strength and persistent inflation, gold serves as the optimal hedge. Although the role of gold isn't directly covered in some of the current economic reports, it remains a traditional safe haven during tumultuous times—a response to the depreciation of currency values and the pervasive fear of inflationary spirals that affect purchasing power and savings CFA Institute.
The global shift away from excessive reliance on the dollar reflects a broader strategy by some nations to safeguard their economies against the capricities of prevailing geopolitical circumstances. This shift may lead to increased gold purchases by central banks, aiming to stabilize financial reserves in light of uncertain future economic policies. As inflation fears continue to wear on investor confidence, gold’s relative safety seems set to keep its allure in the modern financial landscape.
Geopolitical Forces Shaping Gold Prices
Geopolitical tensions in 2025 remain potent catalysts driving the dynamics of gold prices. As international relations remain strained, especially between leading economies, the markets have been exceptionally responsive to developments that unsettle the economic landscape. One critical component in this scenario is the burgeoning U.S.-China trade conflict, which saw tariffs climb to an unprecedented 145% and 125% respectively, spiking gold’s appeal as a safe asset against market turmoil.
This extensive strain on trade and economic relations translates into significant instability across foreign exchange markets. A pronounced example is the substantial 8% decline in the Dollar Index, making gold an attractive alternative as its purchasing power for non-U.S. investors increases . The strategic shift by some nations away from the U.S. dollar is further evidenced by noteworthy purchases of gold by central banks as they seek to diversify their foreign exchange reserves .
Furthermore, the geopolitical climate is marked by a flight to safety among investors, reflected in the significant inflow of gold-backed exchange-traded funds (ETFs), which absorbed 227 tonnes in Q1 of 2025 alone. This highlights how geopolitical strife propels gold as both a buffer against inflation and a refuge amidst escalating equity volatilities.
Amidst these conditions, global policy adjustments also play a role. Central banks have been proactively increasing gold holdings, exemplifying a growing distrust of dollar-denominated assets. For instance, policy shifts seen with the Trump administration's enforcement of new tariffs further exacerbated market fears, as paralleled in previous periods like 2018-2020 where gold gained significant value amidst trade wars.
As geopolitical uncertainty continues to prevail, the inherent security associated with gold, coupled with mounting inflationary pressures from such tensions, suggests that gold prices may well remain heavily influenced by these forces through 2025.
Fort Knox: Transparency and Its Market Implications
Fort Knox, a symbol of American financial might, famously houses a substantial portion of the United States' gold reserves. Recent calls for transparency have surged, fueled by high-profile figures such as Elon Musk and Donald Trump. This movement seeks to address long-standing skepticism surrounding the visibility and security of these reserves. Fort Knox's vaults hold approximately 147 million ounces of gold, valued at over $459 billion at today's market rates. The last independent audit of these reserves dates back several decades, to 1953, prompting increasing demands for accountability .
Elon Musk has proposed a surprising move to audit these reserves, suggesting that the audit be livestreamed. This unprecedented proposal aims to provide public visibility into the wealth residing in the Fort Knox vaults, arguing that the American populace deserves to confirm its existence. However, despite its garnering attention, this idea encounters significant security and logistical obstacles.
While the U.S. Treasury asserts that gold audits occur annually through internal procedures, skepticism remains due to the lack of external verification. Past visits, including former Treasury Secretary Steven Mnuchin's confirmation in 2017 that the reserves appeared intact, have not fully silenced doubts.
Compounding this dialogue, another proposal involves employing blockchain technology to monitor the reserves. Proponents, like NYDIG's Greg Cipolaro, posit that blockchain could enhance audit transparency despite still necessitating trust in the overseeing government entities.
The conversation surrounding Fort Knox's transparency underscores mounting tensions over governmental accountability in financial stewardship. If a comprehensive audit were confirmed, it could significantly bolster public confidence, contributing to more stable gold market conditions. Conversely, revealing discrepancies could heighten market volatility and public distrust. This transparency debate continues amid the broader conversation about economic policy and international financial stability.
Gold Price Predictions for 2025 and Beyond
Gold price predictions for 2025 highlight a growing consensus among major financial institutions that the precious metal is poised to reach new heights. With current prices hovering around $3,223 per ounce, the perspectives of Goldman Sachs, UBS, and the Bank of America offer crucial insights into the potential trajectories of gold's value.
Goldman Sachs has led the charge in bullish projections, recently upgrading their gold price forecast to $3,700 per ounce by the end of 2025. This marks the third upward revision this year due to ongoing recession risks, central bank demand, and inflows into exchange-traded funds (ETFs). The bank envisions a potential rise to $4,500 should extreme economic scenarios unfold . Their analysis highlights a growing reliance on gold as a hedge against global macroeconomic uncertainties, including geopolitical tensions and inflationary pressures .
UBS, another major player, shares this optimistic outlook by projecting gold to reach $3,500 in 2025. UBS's forecast aligns with several macroeconomic indicators, including persistent inflation and central bank demand, which remains robust as an average purchase exceeds previous years. Furthermore, UBS sees structural shifts, with entities such as Chinese insurance funds increasing their gold allocations. This shift underscores gold's strategic role as a portfolio stabilizer in uncertain economic landscapes.
The Bank of America's approach reflects a slightly more conservative position, adjusting their gold price forecast for 2025 to $3,250 per ounce. However, they emphasize significant factors driving their projections, such as central bank accumulation and the political intricacies surrounding U.S. trade measures. The bank's analysis also anticipates gold stabilization in 2025 owing to potential profit-taking, but maintains the broader bullish trajectory through 2026 and beyond .
Overall, these insights paint a vivid picture of an evolving gold market, shaped by multifaceted economic variables and featuring gold as a resilient asset and hedge amid swirling global uncertainties.
Investment Strategies in Today's Gold Market
Amidst the dynamic landscape of 2025, gold continues to offer opportunities for portfolio diversification, driven by economic uncertainty, inflationary pressures, and record-breaking prices. With the gold price surpassing $3,250 per ounce in April 2025, several factors contribute to the increased demand and strategic considerations for gold investment. Trade tensions and proposed tariffs under new U.S. policies have amplified global economic uncertainty, while persistent inflation, hovering at 2.8%, remains above the Federal Reserve's target, delaying expected interest rate cuts. Additionally, stock market volatility has prompted investors to seek diversification amidst equity downturns .
Investment strategies in today's gold market require thoughtful portfolio allocation and diversification. Experts recommend limiting exposure to gold to 7–10% of total assets. This balance ensures investors benefit from gold's non-correlation with stocks and bonds without overexposure to risk . Exchange-traded funds (ETFs) like the SPDR Gold Trust (GLD) or Sprott Gold Miners ETF (SGDM) are favored for their liquidity and ability to provide broad exposure to the gold market .
Tactical investment options also play a critical role in maximizing returns. Fractional gold investments allow access to smaller gold amounts, such as bars or coins under one ounce, making it easier to benefit from price trends without high entry costs . Gold mining stocks present opportunities for those targeting companies with strong margins, especially as costs are significantly below current market prices .
Moreover, strategic fund selection can enhance a portfolio's potential. Funds like the WisdomTree Efficient Gold Plus Gold Miners Strategy Fund (GDMN), which combines physical gold and mining equities, offer a hybrid exposure to gold investments .
The key to navigating 2025's gold market is a disciplined approach to allocation, awareness of market shifts, and strategic use of available investment options. By doing so, investors can hedge against inflation and capitalize on market volatility for potential long-term gains.
Conclusions
The year 2025 has exposed the fragility of the global financial system. Gold isn’t just a haven anymore — it’s a barometer of panic, fear, and institutional failure. When markets shake, inflation becomes chronic, and Fort Knox becomes a meme, gold rises — quietly but relentlessly.
What we’re witnessing is an institutional drift away from the U.S. dollar. Central banks are hoarding metal like they're bracing for something big. The global economy is cracking under tariffs, geopolitical chess moves, and eroding trust in the "reserve currency." At this point, $3,250 per ounce isn’t the top — it’s just another step up the ladder.
The key: gold is no longer just a defensive asset. It has become a strategic tool of sovereignty and power. Nations diversifying into gold are building economic independence. Investors stepping in now aren’t just protecting wealth—they’re gaining leverage.
My advice: keep gold in focus. Physical bullion, ETFs, mining stocks, hybrid funds — each is a puzzle piece. Gold is not hype. It’s the anchor of reason in an era where digital noise drowns out reality.
Watch zones: $3500 — then $3700+. If the global system wobbles harder, $4200 won’t be a forecast — it will be the signal that the fiat era is capitulating.
He who controls gold, controls trust. And he who controls trust… writes the script for the future.
Best regards EXCAVO
— EXCAVO

Hellena | GOLD (4H): SHORT to 38.2%-50% Fibo lvl 3228.Colleagues, last week we got a stoploss, but I still believe that we should expect a correction in wave “2”. We will try to catch this movement this week.
I believe that the price will correct to the area of Fibonacci 38.2% - 50% levels (3228.41).
Perhaps the price will slightly renew the maximum of wave “1”, reaching the level of 3438. In this case I recommend to work with pending limit sell orders.
And some data:
The prevalence of bulls according to CME reports additionally increased by 13%.
The 23% increase in market volume, meanwhile, indicates a likely strong momentum pattern during the trading week.
Despite the 13% increase in buyers, selling patterns towards the balance level of the week (3200.00) are recommended for the current trading week.
Manage your capital correctly and competently! Only enter trades based on reliable patterns!

HelenP. I Gold will make correction movement to support zoneHi folks today I'm prepared for you Gold analytics. After a strong breakout from the ascending structure, price continued its bullish momentum and reached a fresh local high near 3340 points. This impulsive rally was preceded by a steady upward trend inside a rising channel, where the price showed multiple rejections from the lower boundary and the trend line, particularly near the 2970 level, which also matched with the key support zone at 2950 - 2970 points. The upward movement accelerated once Gold broke through the previous resistance zone around 3160 points, which is now acting as support. That level also coincides with the upper edge of the earlier consolidation area, making it a key zone for potential future reactions. At the moment, the Gold is trading far above the trend line and is extended from its last confirmed support structure. Given the sharp vertical impulse and the lack of significant pullbacks, I expect a downward correction toward the 3175 - 3160 support zone, which is my current goal. This area remains critical for evaluating the next buyer reaction and further trend continuation. If you like my analytics you may support me with your like/comment ❤️

Gold Hits New ATH Again: Is the Bull Run Unstoppable?After printing a new All-Time High on April 17, Gold entered a brief correction that ended on April 18 at 3285. However, the daily candle closed strong at 3327, right before the long Easter weekend.
Fast forward to Monday's ASIA session open, Gold showed no hesitation and pushed into yet another ATH at 3384.
The bullish momentum is so aggressive that it feels like nothing can stop this trend. While I do expect heavy volatility going forward, the core strategy remains clear:
👉 Buy the dips.
Key Level to Watch:
📍 First support zone = 3350
At this level, I will actively look for long entries, targeting a potential new ATH later this week.
Disclosure: I am part of Trade Nation's Influencer program and receive a monthly fee for using their TradingView charts in my analyses and educational articles.

Gold Soars: New Record & Lucrative SignalsAs expected, trade tensions continue to stimulate the demand for gold. The price of gold per ounce has just set a new record of $3,340. The US dollar is still under pressure from trade frictions, which have begun to have a real impact on American companies and have intensified domestic concerns about an economic recession in the United States. Trump's frequent changes in tariff announcements have eroded investors' confidence in US policies and reduced their confidence in the US economy.
On the daily chart, starting from the low point of $2,536.68, the price of gold has formed a sustained upward trend. Currently, the price is around $3,300, significantly higher than all major moving averages, indicating that the long-term bullish momentum remains strong. The golden cross pattern of the MACD indicator on the daily chart continues to develop, suggesting that the long-term trend momentum is still upward. The daily RSI reading is 73.45, which has entered the overbought area. It is worth noting that the price recently broke through the resistance level of $3,230.00 and then continued to rise, which further verifies the situation where the bulls are in control.
In the short-term 4-hour cycle, as the price is strongly rising unidirectionally, pay attention to the support of the 5-day moving average. We can continue to be bullish as long as the price stays above $3,310. Judging from the 1-hour chart, the price of gold has maintained a strong upward momentum and is currently around $3,340.
XAUUSD
buy@3310-3330
tp:3340-3360
Investment itself doesn't carry risks; it's only when investment is out of control that risks arise. When trading, always remember not to act on impulse. I will share trading signals every day. All the signals have been accurate without any mistakes for a whole month. No matter what gains or losses you've had in the past, with my help, you have the hope of achieving a breakthrough in your investment.

Gold at PRZ Again – Correction to $3,227 Possible!!!Gold ( OANDA:XAUUSD ) started to rise as I expected in the previous idea and created a new All-Time High(ATH) as usual . How long do you think the upward trend of Gold will continue!? ( Please give your reasons for the rise, I would appreciate it. )
Gold is trading near the Potential Reversal Zone(PRZ) and trying to break the Uptrend line .
In terms of Elliott Wave theory , it appears that Gold has completed another 5-wave impulsive .
Signs of the completion of the main wave 5 can be the presence of Regular Divergence(RD-) between Consecutive Peaks, and the break of the Uptrend line (validly) .
I expect Gold to fall to $3,227 in the coming hours.
Note: If Gold can move above $3,420, we can expect more pumps.
Gold Analyze ( XAUUSD ), 1-hour time frame.
Be sure to follow the updated ideas.
Do not forget to put a Stop loss for your positions (For every position you want to open).
Please follow your strategy; this is just my idea, and I will gladly see your ideas in this post.
Please do not forget the ✅' like '✅ button 🙏😊 & Share it with your friends; thanks, and Trade safe.

Gold - Just Half Way To The Target!Gold ( TVC:GOLD ) still has a lot more upside potential:
Click chart above to see the detailed analysis👆🏻
Over the past couple of months, we saw an almost incredible breakout rally of about +75% on Gold. However, looking at technicals, there is a quite high chance that Gold will actually rally even more and retest the next upper resistance trendline, which would mean another pump of about +75%.
Levels to watch: $4.000
Keep your long term vision,
Philip (BasicTrading)

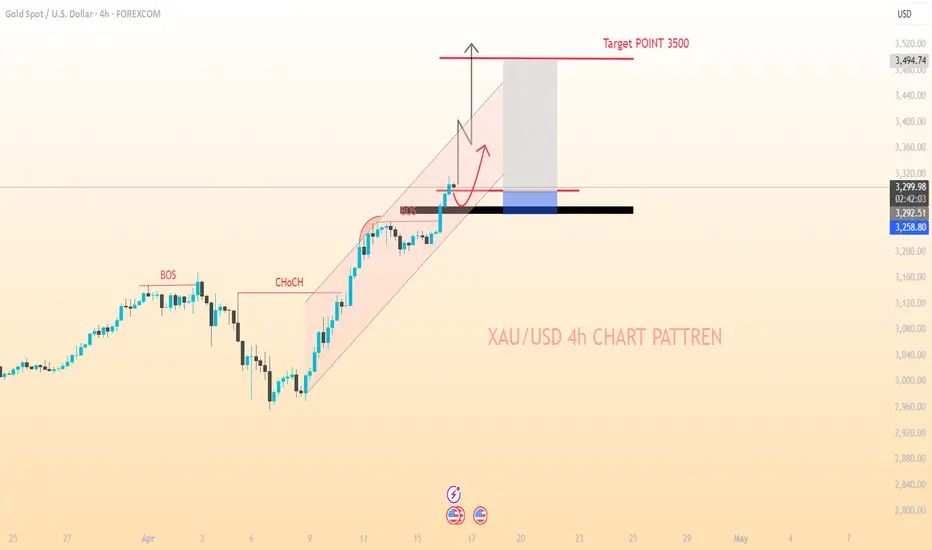
XAU/USD...4h ChartPattrenMY gold trading signal looks clear and concise. Here's a breakdown of the key elements:
*Signal Details*
1. *Entry Price*: 3296
2. *Target Price*: 3500
3. *Stop Loss*: 3250
4. *Sentiment*: Bullish, indicating strong momentum in gold prices.
*Format and Updates*
1. *Text Format*: The current format is straightforward and easy to understand. It's great for quick communication and can be easily shared via text or messaging platforms.
2. *Graphic Version*: Creating a graphic version could enhance visual appeal and make the signal stand out. You could include:
- A chart showing the entry point, target, and stop loss.
- Icons or colors to highlight bullish sentiment.
- Additional information like current price, potential profit/loss, and risk level.
*Considerations for Future Signals*
1. *Consistency*: Keeping a consistent format for your signals can help recipients quickly understand and act on them.
2. *Additional Information*: Consider including more details such as:
- Time frame for the signal (short-term, long-term).
- Rationale behind the signal (technical indicators, news, etc.).
- Risk management tips specific to this trade.
3. *Update Frequency*: Decide how often you'll update the signals. Regular updates can keep recipients informed about market changes.
*Next Steps*
- *Feedback*: Gather feedback from your audience on the preferred format and content of the signals.
- *Automation*: If you're planning to send out signals frequently, consider automating the process using trading software or platforms that can generate and send signals based on predefined criteria.
- *Education*: Provide educational resources or explanations about the signals and trading strategies to help recipients understand and make informed decisions.
Would you like to explore creating a graphic template for your signals or discuss ways to automate signal generation and distribution?
Consolidation Phase in XAU/USD with Bullish PotentialFollowing a period of strong bullish momentum, XAU/USD is currently trading sideways, remaining confined within the price range established between Friday and Monday. This consolidation suggests the market may continue ranging in the short term.
However, if the price dips below the lows of the past two days and breaches the ascending trendline, there is a strong potential for a rebound and continuation to the upside. An alternative scenario could see the formation of a triangle or rising wedge pattern near the current resistance zone.
Despite short-term uncertainty, a key support area around 3170–3180 remains critical. A bounce from this zone could signal the resumption of upward movement. Traders are advised to monitor these key levels closely for confirmation of the next significant directional move. The next target is the resistance zone near 3285

Gold has the strength to keep rising At the end of the week gold confirmed the formation of the trading range, support 3286, resistance 3356. I consider the continuation of realization of potential of false breakout of support as a positive scenario. If gold holds above 3313, the market may continue buying, which will lead to a rise to ATH
Scenario: the price is in a local descending channel, but in a global bullish trend. A bounce to 3313 from the channel resistance may occur, followed by a continuation growth to 3342 or to 3356.

DeGRAM | GOLD Anchored Above the Channel📊 Technical Analysis
GOLD trades within an ascending channel, holding above $3 285 support.
A breakout from a triangle confirms bullish momentum. Key targets are $3 360 - $3 380.
💡 Fundamental Analysis
Demand is rising amid safe-haven flows, Chinese insurer interest, and central bank buying. A weaker USD and US - China tensions support gold.
✨ Summary
Technical breakout and strong fundamentals favor XAUUSD growth. Holding above $3 285 keeps the path open to $3 360.
-------------------
Share your opinion in the comments and support the idea with a like. Thanks for your support!

Gold XAUUSD Possible Intraday Move 16.04.2025🟡 XAUUSD (Gold) Price Action Analysis – April 16, 2025
This setup is based on simple and pure price action—nothing fancy, just clean structure, breakout behavior, and the well-settled $25 range principle when Gold is out of consolidation.
✅ Buy Signal Zones (Based on Pure Price Action)
📍 Buy Zone 1: $3,270 – $3,275
Potential retest of the previous minor structure.
Buy on bullish reaction or rejection.
📍 Buy Zone 2: $3,240 – $3,245
Strong support aligning with 50% Fibonacci.
Previous resistance turned support—perfect for deeper pullbacks.
📍 Buy Scenario 3: No pullback, direct continuation
Buy on strong breakout above $3,299 targeting $3,325.
This aligns with the $25 range principle—a settled rule when Gold breaks out of range.
🎯 Target: $3,325
Pure price action logic: From the current structure, the next clean target lies at $3,325, exactly one $25 block higher.
📝 Summary:
✅ Buy from $3,270–75 or $3,240–45, with confirmation.
✅ Buy on breakout above $3,299 targeting $3,325.
🚫 Avoid shorts—structure favors bulls.
This is simple and pure price action. No indicators, no confusion—just structure, reaction, and levels.
Hit like, follow, comment and share to show support.

"Gold on Fire: Eyeing $3500 After RBR Zone Rebound! "1️⃣ Trend Overview
📈 Strong bullish rally from April 11 to the peak.
📉 Pullback after reaching the recent ATH (All-Time High) zone.
2️⃣ Key Zones
🔵 RBR Zone (Rally-Base-Rally):
Marked support area between $3,271.41 and $3,307.04.
Acts as a buy zone / entry point.
🟣 ATH Zone:
Minor resistance from the recent high.
Price pulled back from here before potentially continuing up.
3️⃣ Entry & Target
✅ Entry Point: Around $3,307.04 (top of RBR zone).
🎯 Target Point: Clearly defined at $3,500.71.
Potential Gain: +188.59 points
ROI: +5.70%
4️⃣ Indicator
📊 EMA (7, close):
Currently at $3,329.09
Price is slightly below EMA = short-term correction or pause.
Strategy Summary
🟢 Buy Setup:
Wait for price to return to RBR zone
Enter long position ✅
Target $3,500 🚀
⚠️ Risk Consideration:
Place stop-loss below RBR zone for safety.

Gold (XAU/USD) Bullish Continuation Setup – Key Support Levels 📊 Chart Context & Setup
Chart Type: Candlestick
Indicators Used:
50 EMA (red): Currently at 3,199.009
200 EMA (blue): Currently at 3,123.168
Support Zone: Around 3,157.786 – 3,123.168
Current Price: Approximately 3,211.90
Focus Point (Target Zone): 3,283.810
🧠 Technical Analysis
🔹 Trend Analysis
Overall Trend: Bullish
Price is trading above both the 50 EMA and 200 EMA.
The EMAs are sloping upward, indicating strong momentum.
Golden Cross previously occurred (50 EMA crossing above 200 EMA).
🔹 Key Support & Resistance
Immediate Resistance Zone: Around 3,240
This area is acting as a potential rejection zone, with minor consolidation.
Support Zone (Highlighted): 3,157 – 3,123
This zone was previously a breakout level and now serves as a retest support.
It coincides with the 200 EMA, adding to its strength.
🔁 Scenarios Presented
Scenario A – Bullish Rejection from Immediate Support (3,199)
Price could hold above or near the 50 EMA.
Break and retest of minor resistance could lead to a push toward 3,283.81 (target).
This is a higher-risk entry as the support is not deeply tested yet.
Scenario B – Deeper Pullback to Major Support (3,157 – 3,123)
A drop below current price into the main demand zone.
Bullish engulfing or strong reaction in this zone would offer a high-probability long setup.
Ideal entry point for swing traders, especially if confirmed by volume or bullish candlestick reversal.
🎯 Trade Strategy Suggestion
✅ Long Setup
Entry Option 1: On bullish rejection above 3,199 with confirmation.
Entry Option 2 (Preferred): At strong support zone 3,157 – 3,123 with bullish reversal signal.
Target: 3,283.81
Stop Loss:
For Entry 1: Below 3,157
For Entry 2: Below 3,100 or 200 EMA, depending on aggressiveness
📌 Conclusion
This chart illustrates a classic bullish continuation setup with two potential entry scenarios:
A minor pullback and bounce from the 50 EMA.
A deeper retracement into a strong support zone aligned with the 200 EMA.
The uptrend remains intact as long as the price holds above the 200 EMA and the major demand zone. A break below 3,100 would invalidate the bullish outlook short-term

XAUUSD trade idea for upcoming week Current Situation:
: Price is around 3326
: There’s a strong previous uptrend, and now price is recovering from a recent dip.
Trade Setup Explanation :
Bullish Phase (Short-Term Buy Idea)
: First Buy Zone: Current price up to the all-time high zone around 3355.
: The chart anticipates a short-term bullish push, likely to retest the ATH area.
: This zone is considered a liquidity grab or “trap” area, where price could reject and reverse.
Main Sell Zone:
> Sell Zone Identified: 3355–3360 area.
> This is a key resistance zone with:
> Previous multiple rejections (marked by red arrows).
> It's also where sellers are expected to be strong.
Sell Target Path:
1: TP1 = 3305 – Minor support, first logical reaction zone.
2: Price is then expected to range around 3305–3295 (highlighted in purple).
3: After consolidation, the expectation is a bearish continuation.
>>Final Target = 3255 – A major support zone and final destination of the swing short.<<

Please be carefulFrom a purely technical point of view, the bulls are in control of the overall situation under the support of the big positive line on the weekly chart. The Asian session has maintained the rule of opening up for more than a month. On the market, the spot gold US session low point 3220-15 area long and short strength dividing line, strong above, weak below; Asian session retracement low 3185-90 long and short watershed, above the long, short or even plummet rapidly. From the upside, it is still a blind spot, pay attention to the 3245 area, then 3265-60 and 3300 mark.There are many news over the weekend, and the opening of next week is crucial. A high opening, a low opening, or a flat opening indicates different risk sentiments. In terms of operation, either watch more and do less, or don't be afraid to follow the market sentiment; however, while maintaining a bullish bullish position in the short term, beware of the sudden change in the tariffs of the country causing a rapid collapse and plunge in the gold market; after a rapid rise in the short term, the fall will be more fierce, and a collapse or rise is a matter of news!

3382 , next ATH number today, GOLD⭐️GOLDEN INFORMATION:
Gold price (XAU/USD) enters a phase of consolidation on Thursday, trading within a narrow range near its all-time high reached during the Asian session, as investors digest conflicting market signals. Stronger-than-expected US Retail Sales figures and hawkish remarks from Federal Reserve (Fed) Chair Jerome Powell have lent support to the US Dollar (USD), curbing some of gold’s upside momentum. Meanwhile, the upbeat sentiment across equity markets and mildly overbought technical conditions are prompting traders to remain cautious, limiting fresh buying interest in the precious metal for now.
⭐️Personal comments NOVA:
Gold price continues to increase today, the fomo still has no end, pay attention to the new ATH price zone 3382
⭐️SET UP GOLD PRICE:
🔥SELL GOLD zone : 3381- 3383 SL 3388
TP1: $3370
TP2: $3355
TP3: $3333
🔥BUY GOLD zone: $3302 - $3300 SL $3295
TP1: $3310
TP2: $3320
TP3: $3330
⭐️Technical analysis:
Based on technical indicators EMA 34, EMA89 and support resistance areas to set up a reasonable BUY order.
⭐️NOTE:
Note: Nova wishes traders to manage their capital well
- take the number of lots that match your capital
- Takeprofit equal to 4-6% of capital account
- Stoplose equal to 2-3% of capital account

XAU/USD: New ATH ~ $3500, What's Next? (READ THE CAPTION)Upon reviewing the 15-minute gold chart, we can see that the price once again reached a new high today, rallying up to the key psychological level of $3500. Following this move, gold has experienced a pullback down to $3423 so far. If the price stabilizes below $3442, we will likely see a further correction toward the next target at $3411. (This analysis will be updated)
Please support me with your likes and comments to motivate me to share more analysis with you and share your opinion about the possible trend of this chart with me !
Best Regards , Arman Shaban

Gold Market Analysis: Key Levels to WatchGold Market Analysis: Key Levels to Watch
Gold is currently in a highly overbought state. Since April 10th, its price has surged past a strong resistance level, climbing up to 3245.
The price could now make a minor correction before continuing its rise, or a deeper pullback before resuming its upward trend. Let's examine two possible scenarios:
Bullish Scenario:
If gold rises above 3245, it could aim for higher targets at 3284 and 3300.
Bearish Scenario:
If gold drops below 3206, a bearish trend may unfold, with potential declines to 3167 and 3128. Both levels should be closely monitored, as a rebound from these areas could lead to a stronger upward wave. In particular, 3167 seems to be a solid support level with a higher chance of reversing the downward trend.
You may find more details in the chart!
Thank you and Good Luck!
❤️PS: Please support with a like or comment if you find this analysis useful for your trading day❤️

XAUUSD SELL SETUP , Sold at $3381XAUUSD SELL SETUP
Currently $3381
Sold at $3381
(Trading plan XAUUSD go up to $3410 we will add more sell)
Expecting target (3362 0R down )
Incase of early exist will update this anaylsis
Its not a Financial Advice
