Gold analysis: 06-Mar-2025Good morning, everyone! Today's Gold analysis is designed to educate and empower. Use these insights to refine your price action trading strategy.
XAUUSD.P trade ideas

xauusdtSupport and press the rocket to cheer me up
Observe the ten percent loss limit
Stay away from Bitcoins
Feel free to buy and sell and post your comments

Gold Extends Three-Day Rally Amid Economic Weakness, Trade UncerGold has posted three consecutive sessions of gains this week as markets react to a combination of weak economic data, prolonged trade tensions, and resurging geopolitical risks.
U.S Economic Data Signals Slowdown
The latest U.S economic reports continue to point toward a weakening outlook. February’s ADP Non-Farm Employment Change came in at just 77,000, significantly below expectations of 141,000 and the prior month’s 186,000. This suggests a cooling labor market, raising concerns about the pace of economic growth. Meanwhile, the S&P Global Services PMI exceeded forecasts but remains insufficient to restore confidence in a sustained economic recovery.
Trade Tensions Remain a Market Headwind
A temporary relief came as President Trump announced a delay in tariffs on imported automobiles from Mexico and Canada. However, this reprieve is short-lived, with tariffs set to be reassessed on April 2, leaving uncertainty in place. Furthermore, unresolved trade tensions with China continue to weigh on market sentiment, keeping investors cautious and supporting safe-haven demand for gold.
Geopolitical Risks Drive Safe-Haven Flows
On the geopolitical front, tensions have escalated following the U.S. decision to halt military aid to Ukraine. At the same time, NATO has reinforced its military presence and reaffirmed support for Ukraine, increasing investor fears of a potential conflict escalation. These developments have further fueled demand for gold as a hedge against geopolitical instability.
Market Focus Shifts to Key Economic Data
As the week progresses, investors will closely monitor upcoming economic reports, particularly the Non-Farm Payrolls (NFP) and unemployment rate. These data releases could have a significant impact on gold’s trajectory and broader financial markets. A weaker-than-expected jobs report may reinforce expectations of economic slowdown, strengthening gold’s bullish momentum, while a robust reading could temper the metal’s gains.
Gold’s recent rally underscores its resilience as a safe-haven asset amid macroeconomic and geopolitical uncertainties. The short-term outlook remains bullish, with market dynamics favoring continued strength unless a significant shift in economic conditions or policy direction emerges.

XAUUSD GOLD Idea H2
Gold has shown a strong bullish reversal after breaking structure and retesting the key demand zone around 2880. The price has now flipped previous resistance into support, confirming bullish momentum. If we see a successful retest of the 2920 zone, we could expect a push towards 2955.
Key Levels:
✅ Support: 2880
✅ Resistance: 2920 → 2955
📈 Bullish bias as long as structure holds. Let’s see if buyers step in!
Trading involve High Risk This Is Not Financial advice trade at your own risk..

Gold (XAU/USD) Price Analysis – March 4, 2025Gold’s Bullish Momentum Aims for a New All-Time High
By Brokerir
Current Market Overview
Gold (XAU/USD) is currently trading around $2,906, showing a slight retracement of -0.18% in today's session. The precious metal has recently rebounded from a significant support level near $2,846, triggering a strong bullish momentum. Given the macroeconomic outlook and technical structure, there is an increasing probability of gold breaking its previous all-time high (ATH) and targeting the $3,020 level in the coming weeks.
Key Technical Analysis
1. Price Structure & Trend
Gold has been in a strong uptrend since early February, characterized by higher highs and higher lows.
Recent buy signals on the chart confirm renewed bullish interest after a corrective phase.
The price has successfully broken above short-term resistance at $2,906, suggesting further upside potential.
If gold maintains momentum, a push toward $3,020 is likely, a level that aligns with historical resistance and Fibonacci extensions.
2. Supertrend Indicator
The Supertrend (10, hl2, 3) flipped bullish again after the price bounced from the $2,846 support.
The latest buy signal further strengthens the case for continued upside.
A sustained hold above $2,905 would solidify the bullish trend.
3. MACD Analysis
The MACD histogram has started printing higher bars, indicating a potential bullish crossover.
The MACD line is turning upward from negative territory, hinting at increasing buying pressure.
This momentum shift supports the idea that gold has room to extend higher.
Fundamental Drivers Supporting Gold’s Upside
Global Economic Uncertainty: Investors are shifting towards gold as a hedge against inflation and economic instability.
Central Bank Policies: The potential for rate cuts in the second half of 2025 could weaken the USD, driving gold prices higher.
Geopolitical Tensions: Any escalation in global tensions typically boosts demand for safe-haven assets like gold.
Outlook & Trading Strategy
With technical indicators aligning for a bullish continuation, gold is likely to break its previous ATH and move towards $3,020. Traders should watch for: ✅ A daily close above $2,906 to confirm bullish strength.
✅ A break above $2,920 for a stronger push toward $3,020.
✅ A potential pullback to $2,880-$2,890 as a re-entry zone before further upside.
Conclusion
Gold remains well-positioned for further gains, with $3,020 as the next major target. The bullish momentum, supported by technical signals and macroeconomic conditions, suggests traders should maintain a long bias while managing risk accordingly.
By Brokerir

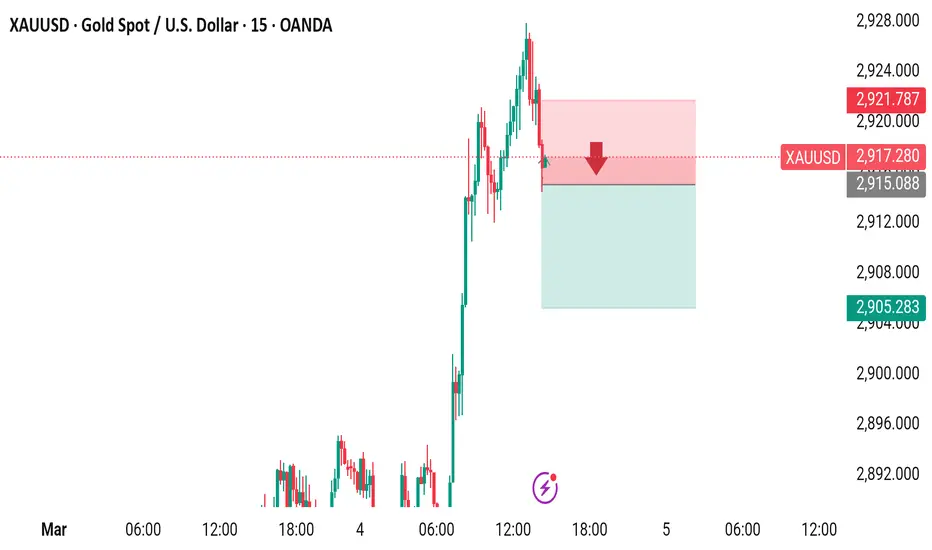
XAUUSD entre 2915 target 2904stop loss 2921Here's your updated XAUUSD (GOLD) trade setup:
Trade Setup
- *Entry:* $2915
- *Target:* $2904
- *Stop Loss:* $2921
Trade Type
- *Short Sell*: You're betting on GOLD's price decreasing.
Risk-Reward Analysis
- *Risk:* $6
- *Reward:* $11
- *Risk-Reward Ratio:* 1:1.83
Monitor market movements closely!
Gold intraday trade idea 04/03/2025Gold remains bullish after rejecting 2834 last week. Asian session saw a retest of 2882, but we've been ranging between 2882-2892. My plan is to buy above 2893 on a break & retest, with targets at 2907 & 2919. If we break back below 2882, we could see a deeper pullback to 2862 or even 2834 before resuming the uptrend. Waiting for confirmation.

GOLD BULLISH CONTINUE 2913Hey there on 4HTF Gold looking for bullish continue from last Friday touch 2833 level and again rise upside 2860 and today also rise upside from 2860 to 2891
So as now we can see possible move upside continue from next supply zone is 2906-2913 level
Now we can see some drop gold but we will confirm see will touch 2900 and 2906 level also
Thanks

XAU/USD LongAs I expected from my previous post, gold is more likely to drop as it fails to make a higher high on the higher timeframe. Based on my chart, there is significant liquidity that needs to be taken out, also known as the support line. I am waiting for the Candle Range Theory to occur before entering a long position, and confirmation is needed to reduce risk.
Alright, that’s it thanks!

Daily Analysis- XAUUSD (Monday, 3rd March 2025)Bias: Bearish
USD News(Red Folder):
-ISM Manufacturing PMI
Analysis:
-Price closed strong bearish on weekly
-Looking for continuation to the downside as no bottom wick on weekly candle
-Potential SELL if there's confirmation on lower timeframe
-Pivot point: 2890
Disclaimer:
This analysis is from a personal point of view, always conduct on your own research before making any trading decisions as the analysis do not guarantee complete accuracy.

XAUUSD MONDAY TARGETGuys, this is our target for Monday. If anyone wants to follow it, they can do so. This is a confirmed target.


GOLD - Still Bullish Indeed!Hello TradingView Family / Fellow Traders. This is Richard, also known as theSignalyst.
📈XAUUSD has been overall bullish, trading within the rising wedge marked in orange.
Moreover, the blue zone is a strong structure and support.
🏹 Thus, the highlighted blue circle is a strong area to look for buy setups as it is the intersection of structure and lower blue trendline acting as a non-horizontal support.
📚 As per my trading style:
As #GOLD is around the the blue circle zone, I will be looking for bullish reversal setups (like a double bottom pattern, trendline break , and so on...)
If the blue zone is broken downward, a deeper bearish movement towards the $2,775 demand zone would be expected.
📚 Always follow your trading plan regarding entry, risk management, and trade management.
Good luck!
All Strategies Are Good; If Managed Properly!
~Rich
Disclosure: I am part of Trade Nation's Influencer program and receive a monthly fee for using their TradingView charts in my analysis.

GOLD → Shaking. Going into flat. What's next?FX:XAUUSD is moving from a local bullish trend to a flat state. Bulls are still protecting strong risk zones. What to expect from the metal next?
Investors are returning to safe-haven assets due to uncertainty over Trump's tariffs and weak U.S. economic data.
Gold pulled back from a record $2,956 on Tuesday on profit taking and due to a drop in Chinese imports. However, a weak U.S. consumer confidence index helped the price recover.
Gold's rise is being held back by a strengthening dollar and bond yields, but trade war fears are supporting demand for the metal
Resistance levels: 2921, 2929, 2942
Support levels: 2905, 2888
Thus, we are forming a flat (sideways range). There is a possibility for a decline, for example, to retest the support 2905 - 2888 before further growth. Or growth and breakdown of resistance.
If the bulls can enter the 2921-2929 zone and keep the defense above this zone, the metal may return to growth.
Regards R. Linda!

Short on XAUUSD (GOLD)Price Action:
Price has failed to break range (2925 - 2891) above for 4 days new ending the week in consolidation even after NFP on Friday with the dollar being weak.
Correlation to DXY:
Last week the dollar was under attack due to fears of trump tariff wars. On DXY chart, the price is approaching the 200 EMA on weekly chart, indicating a potential bull run hence affecting gold’s price inversely.
Short Bias (High Probability):
On higher time frame price action clearly forming a bearish head and shoulder pattern after creating an all time high indicating a bearish move back down to 2840 region. Break of this level price could be potentially continue to drop to the previous all time high at a psychological level of 2780.
Long Bias (Low Probability):
If price breaks above 2950 with a full body candle close above and retesting forming a resistance to support price action then price could be rallying to create new all time highs! If this scenario plays out, we will be approaching uncharted territories forming new resistance aches support so trading with a trailing stop is recommended for capital protection.

XAU possible bullish levelI have started analyzing gold chart when I do with bitcoin as a habit. It moves very well too. It is like bitcoin cousin.

Safe-Haven Demand Lifts Gold Amid US Tariff UncertaintyGold rose above $2,920 per ounce, nearing record highs, as a weaker dollar and trade uncertainty drove safe-haven demand. Trump granted US automakers a one-month exemption from 25% Canada-Mexico tariffs and hinted at more changes. A US official suggested lifting the 10% tariff on Canadian energy if trade conditions are met. Meanwhile, China filed a revised WTO complaint in response to new US tariffs. Investors await the non-farm payrolls report for Fed policy signals.
Key resistance stands at $2,923, with further levels at $2,955 and $3,000. Support is at $2,860, followed by $2,830 and $2,790.

Daily Analysis- XAUUSD (Thursday, 6th March 2025)Bias: No Bias
USD News(Red Folder):
-Unemployment Claims
Analysis:
-Expecting consolidation before NFP news
-Looking for a retest on the key levels
-PotentialBUY/SELL if there's confirmation on lower timeframe
-Pivot point: 2940 , 2900
Disclaimer:
This analysis is from a personal point of view, always conduct on your own research before making any trading decisions as the analysis do not guarantee complete accuracy.

3.3 Analysis of gold trend on Monday3.3 Analysis of gold trend on Monday
Technical analysis of gold
Daily level:
Prices continue to fall after the big negative line, and the weekly closing is likely to continue to fall.
Prices are running near the lower track of the Bollinger Bands, and the short-term moving average constitutes reverse resistance.
The MACD indicator crosses downward and continues to increase, and the RSI indicator shows sufficient downward momentum.
4-hour level:
The continued bearish pattern pushes the short-term moving average to extend downward, and the price runs below the lower track of the Bollinger Bands.
The overall downward trend is expected to continue.
Operational suggestions
High-altitude thinking:
Short-term resistance focuses on the vicinity of 2866, and the bears are expected to explore new lows below.
If the bulls return to 2866 points, it will be regarded as a continuation of the shock, and the focus will be on the 2875 area.
Support focus:
The 2832-2830 area is regarded as the intraday decline limit. If this area is touched, short-term bulls can be tried.
Mid-term long orders will be taken out first at 2843.
Focus on next Monday:
Short-term resistance above: 2875-2880.
Short-term support below: 2832-2837.

GOLD Trend reversal, The Week Ahead 03rd March ’25The GOLD (XAUUSD) index pair price action sentiment appears bearish, supported by the loss of longer-term prevailing uptrend. The recent intraday price action appears to be an overbought consolidation after reaching the all-time high on 20th Feb ‘25.
The key trading level is at the 2896 level, 20-day moving average and the rising support trend line zone. An oversold bounce back from the current levels and a bearish rejection at the 2896 level could target the downside support at 2790 followed by the 2770 (50 DMA) and 2743 levels over the longer timeframe.
Alternatively, a confirmed breakout above the 2896 resistance and a daily above below that level would negate the bearish outlook opening the way for a further rally and a retest of the 2920 level followed by 2950.
This communication is for informational purposes only and should not be viewed as any form of recommendation as to a particular course of action or as investment advice. It is not intended as an offer or solicitation for the purchase or sale of any financial instrument or as an official confirmation of any transaction. Opinions, estimates and assumptions expressed herein are made as of the date of this communication and are subject to change without notice. This communication has been prepared based upon information, including market prices, data and other information, believed to be reliable; however, Trade Nation does not warrant its completeness or accuracy. All market prices and market data contained in or attached to this communication are indicative and subject to change without notice.

Gold (XAU/USD) – 4H TimeframeHello Traders 👋
📉 Sell Signal
🔹 Entry: 2,850 – 2,860
🔹 Target 1: 2,800
🔹 Target 2: 2,750
🔹 Target 3: 2,738
🔹 Stop Loss: 2,883
📌 Analysis:
• Price has broken below the ascending channel, confirming a bearish trend.
• If 2,850 breaks, further downside is expected.
• RSI and volume indicators show bearish pressure.
💡 Risk Management:
• Use leverage cautiously.
• Risk only 1-2% per trade.

Gold Weekly AnalysisAs you See Gold faces rejection from the weekly internal liqidity and it filled 50% of of fvg and after that it faces rejection with strong 4H bullish candle.
which indicates that the trend is going to be bullish next week and the draw on liquidity is near 2920 to 2930 price level.
So, my bias is bullish thi week, i will look for buy trade when market structure shift will be completed and in "LTF" i will displacement and take my entry.
Do follow us, hit like and leave a comment if you find that ideas helpful.

ULTRA AGGRESSIVE OVERCONFIDENCE TRADING PLAN 🔥 ULTRA AGGRESSIVE OVERCONFIDENCE TRADING PLAN 🔥
🚀 WE TRADE TO MILK THE MARKET EVERYDAY! 💰🔥
This is not just trading—this is MILKING THE MARKET with ultra-aggressive, high-probability setups designed for MAXIMUM profitability. We do not play safe—we execute with ruthless precision using deep liquidity manipulation, institutional order flow, and market psychology to stay ahead of the herd.
💎 1️⃣ DOMINATE RISK MANAGEMENT WITH AGGRESSIVE PRECISION 💎
📌 Overleverage but with Control – We maximize margin intelligently, leveraging high-probability setups.
📌 Strategic Stop-Hunt Placement – Stops are set where institutions won't manipulate them—inside liquidity zones.
📌 Massive Risk-Reward Execution – Forget 3:1—we target 5:1, 10:1, or more when volatility allows.
🔥 2️⃣ PSYCHOLOGICAL WARFARE: KILL EMOTIONAL WEAKNESS 🔥
🚀 Eliminate Fear & Greed – The market rewards those who execute with absolute conviction. No hesitation. No panic.
🚀 NEVER Revenge Trade—Instead, Strike with Precision – We don’t chase losses; we trap liquidity and counterstrike.
🚀 Overtrading? NO—We Attack High-Probability Setups Non-Stop – The market moves 24/5, and so do we.
🏆 3️⃣ RUTHLESSLY STRUCTURED STRATEGY WITH NO ROOM FOR WEAKNESS 🏆
✅ We Execute, Not Gamble – Every trade is backed by institutional analysis, order flow, and AI-enhanced decision-making.
✅ Consistency Wins the War – Jumping strategies is for losers. We stick to high-frequency, sniper-level trades.
✅ Market Conditions Don’t Matter—We ADAPT & STRIKE – Trend or range, manipulation or momentum—we profit.
📊 4️⃣ TECHNICAL & FUNDAMENTAL DOMINANCE 📊
📌 Price Action is King – Indicators serve us; they don’t dictate our trades. We read the tape, not just lines on a chart.
📌 Trend is Our Ally, But Smart Money Flow is the Master – We follow deep liquidity pools and institutional footprints.
📌 Fundamentals Confirm, But Liquidity Leads – CPI? FOMC? Geopolitical risks? We’re in BEFORE the herd reacts.
🕰️ 5️⃣ PATIENCE? NO—AGGRESSIVE TIMING & EXECUTION 🕰️
🚀 We Wait for the Kill Shot – Confirmation matters, but we don’t hesitate when it’s time to strike.
🚀 We Milk Every Trade for Maximum Profits – We don’t close winners early. We squeeze every last pip.
🚀 We Trust the System—Because it Works – We don’t fold after a loss. We reload and fire again.
⚠️ 6️⃣ MANIPULATION IS THE GAME—AND WE MASTER IT ⚠️
💥 We Hunt the Hunters – We know how market makers operate, and we capitalize on their deception.
💥 Fake Breakouts? We Profit from Them – We enter where the weak hands exit.
💥 We Avoid Retail Traps Like Sharks Avoid Nets – We trade where the money is, not where the hype is.
🚀 ULTRA-AGGRESSIVE EXECUTION RULES 🚀
✅ Risk per trade? Dynamically adjusted—sometimes we go all in when the opportunity is too good.
✅ 3:1 risk-reward? We don’t settle—we push for 5:1, 10:1, or beyond.
✅ Emotional detachment? No hesitation, no doubt—just strategic aggression.
✅ Technical + Fundamental + Liquidity Flow = Our Triple-Edge Attack Strategy.
🔥 MAHARLIKA TRADER MINDSET: WE DON’T TRADE, WE DOMINATE 🔥
This is not gambling. This is an elite-level strategy designed to milk the market every single day. Those who fear volatility? We exploit it. Those who trade blindly? We take their money.
💰🚀 WE TRADE TO MILK THE MARKET. EVERYDAY. NO EXCEPTIONS. 🚀💰
🔥 We Execute. We Conquer. We Profit. 🔥
