.GOLD NEW D1 UPDATES NEW BEARISH SOON
. 🧠 **Gold Short Trade Idea** – Daily Chart
. 📌 **Market:** Gold (XAU/USD)
. 📆 **Timeframe:** Daily
. 🧭 **Bias:** Bearish (Short)
---
🔹 **Trade Setup**
🔸 Entry Zone:
- Sell Limit Order** around: **$3,250 – $3,274**
- This area shows recent rejection and may act as strong resistance.
🔸 Stop Loss:
- Above upper resistance:** Suggested around **$3,300**
- Gives breathing room in case of a false breakout.
🔸 Target Zone (Take Profit):
- TP1:** $3,145
- TP2 (Extended):** $3,122
- These are support zones based on prior structure.
---
📊 **Risk-Reward Ratio (RRR):**
- Entry:** ~$3,260 (mid of entry zone)
- Stop Loss:** ~$3,300 → Risk = 40
- Take Profit:** ~$3,145 → Reward = 115
- RRR:** **~2.87:1** (great setup)
XAUUSD.P trade ideas

XAU / USD 4 Hour ChartHello traders. Just taking a look at the 4 hour chart and I have marked my areas of interest for potential trade set ups. It is only Monday, so I am in no hurry to force or rush a trade. I am waiting for some lower time frames to line up and for some definitive support and resistance to form as we get closer to the Pre NY volume starting in a few hours or so. Let's see how things play out. Big G gets my thanks. Be well and trade the trend. Happy Monday!!!

GOLD-SELL Strategy 12 hourly chart GANN SQIt feels we are near the end of the run for the short-term and who knows, for the MT as well. It is overextended, even though we had some interim corrections, the overall correction has not taken place as yet.
Strategy SELL @ $ 3,200-3,25o and take profit near $ 3,097 for now.

Gold at the Crossroads: A Smart Market SnapshotGold’s rally is supported by strong fundamentals, including global geopolitical uncertainty, sustained central bank purchasing, and a weakening USD , which reinforce its long-term safe-haven appeal. However, near-record levels suggest that profit-taking could be imminent; technically, the price is testing significant resistance around the 3,230–3,250 zone, and if it fails to break higher, a short-term correction toward the support area between 3,100–3,000 is likely. Conversely, a decisive close above 3,250 would favor the continuation of the uptrend.
Targets: 3176, 3128 , 3290

GOLD → Price is consolidating, but to what end? Growth?FX:XAUUSD continues on its way as part of a strong rally. Price is testing strong resistance and there is a good chance of a new high as the trade war escalation intensifies. Against the backdrop of the bull run, there is no need to think about selling!
Gold is trading near all-time highs above $3,200 on Friday, posting a weekly gain of about 5.5%. Rising prices are fueled by concerns over U.S. financial stability and the possible resignation of the Fed chief, adding to pressure on the dollar. Expectations of recession and Fed rate cuts are increasing amid escalating trade war with China, after the US imposed tariffs of 145% and Beijing retaliated - China raised tariffs to 125%. Inflation in March came in below expectations, reinforcing forecasts for a rate cut. Focus is on further trade talks and China's response
Resistance levels: 3219.5
Support levels: 3197, 3187, 3167
Emphasis on the local range: 3219 - 3187. Breakdown and price consolidation above the resistance will provoke rally continuation. But I do not rule out a correction to accumulate energy before the continuation of growth. In this case gold may test 3197 (0.7f), or support of 3187 range.
But we should be aware of the fact of unpredictability: If the US and China sit down for negotiations, the situation may change dramatically.
Regards R. Linda!

GOLD All Key Levels! Buy!
Hello,Traders!
GOLD is trading in a MASSIVE
Uptrend and the slope of the
Price increase is getting steeper
And steeper which begs a question
Of how sustainable is this growth
In the future, however we are
Still bullish biased as the turmoil
In the markets makes makes Gold
Particularly attractive as a safe
Haven asset and so the next
Target seems to be a strong
Psychological level of 3300$
Buy!
Comment and subscribe to help us grow!
Check out other forecasts below too!
Disclosure: I am part of Trade Nation's Influencer program and receive a monthly fee for using their TradingView charts in my analysis.

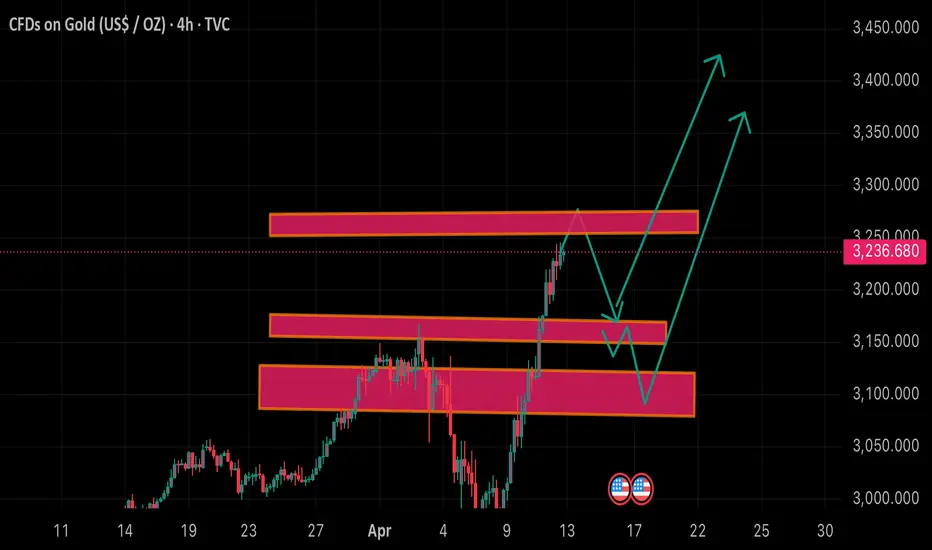
GOLD – Bullish Momentum with Potential Pullback | Key Gold (XAU/USD) has shown strong bullish momentum, recently breaking through key resistance levels. The price is currently approaching a significant supply zone around the 3235–3250 area, where we may see some short-term rejection.
Two possible scenarios are forming:
1. Scenario 1 – Healthy Pullback Before Continuation (Preferred):
A potential pullback towards the 3150–3180 support zone (highlighted) could offer a better risk-reward buying opportunity. If price forms bullish confirmation (e.g., bullish engulfing, pin bar) in that area, we can expect a continuation of the uptrend toward 3350 and potentially 3450.
2. Scenario 2 – Breakout Continuation:
If gold maintains its bullish strength and breaks above the current resistance zone without a pullback, it may push directly toward the 3350–3450 region.
Key Levels:
• Resistance Zone: 3235–3250
• Support Zones: 3180, 3150, and 3100
• Bullish Targets: 3350 and 3450
Bias: Bullish
Strategy: Wait for price reaction in the marked zones. Enter on confirmation with proper risk management.
Gold Closes the Week Strong – Breakout Toward $3300 Coming?📊 XAU/USD Daily Technical Outlook – April 11, 2025
Gold rebounded strongly during Friday’s session, climbing from early lows around $3,177 to reach a high of $3,237. This bounce followed a brief correction the day before, as buyers stepped back in near key psychological levels. The move was partially driven by ongoing geopolitical tensions and renewed demand for safe-haven assets.
At the moment, gold is trading around $3,212, holding its gains firmly into the weekly close. The broader market remains bullish, with the uptrend still intact unless key supports are breached.
📈 Current Market Structure:
After Thursday’s pullback, Friday’s strong bullish candle suggests renewed momentum. Price is still moving within an ascending structure, and the sharp recovery could be an early signal of a continuation toward new highs.
🔹 Key Resistance Levels:
$3,237: Immediate resistance. Friday’s high. A break above this level could trigger further bullish continuation.
$3,280: Potential upside target if momentum continues.
$3,300: Psychological resistance and potential long-term target.
🔸 Key Support Levels:
$3,177: Intraday support. If gold pulls back again, this level may provide a bounce.
$3,150: Near-term support and a key structural level.
$3,095: Deeper support, marking the bottom of the previous breakout area.
📐 Price Action Patterns:
Friday's bullish engulfing candle signals strong buying pressure, especially after Thursday’s correction. If buyers defend current levels early next week, we may see a bullish continuation. However, failure to break $3,237 may trigger another consolidation phase.
🧭 Potential Scenarios:
✅ Bullish Scenario:
If gold breaks and holds above $3,237, this could trigger a move toward $3,280 or even $3,300. Buyers remain in control as long as price stays above $3,177.
❌ Bearish Scenario:
If gold fails to push above resistance and breaks below $3,177, we could see a retest of $3,150, and possibly deeper toward $3,095 if bearish momentum increases.
📌 Conclusion:
Gold showed resilience on April 11, recovering sharply from a brief dip and closing the week on a strong note. The market structure remains bullish, and a sustained break above resistance could lead to fresh all-time highs. Traders should continue to monitor geopolitical news and dollar strength for clues on short-term direction.
💬 What’s your take on gold heading into next week? Will bulls take control again, or are we in for more consolidation? Drop your thoughts below!
Let me know if you want a version ready for TradingView or with hashtags and emojis for social media!

GOLD VERSUS TSX (Toronto Stock Exchange)Gold broke out versus the Canadian stock market.
Expect a recession to be eventually backfilled.

GOLD Gold makes a Record High Above $3,200 fueled by Tariff Tensions and Dovish Fed Outlook by federal reserve
Gold prices rise fueled by rising safe-haven demand as the US-China trade war escalates and expectations continue to grow for a more tariff coming to balance united states trade imbalance with china .
dollar weak appeal is trading below 100 a potential redflag of a weak economy and a boost for EUR,AUD,JPY,CAD,CHF,NZD,GBP
investors and gold traders shares optimism after President Trump paused reciprocal tariffs for 90 days, while China now faces a 145% levy higher than the previously proposed 125%.
The US Dollar continue to sink further after CPI data disappointed,
Core CPI and weekly jobless claims (223K) signaled softer economic momentum, reinforcing bets of dovish stance by Fed and a potential rate cut in the coming months.

Gold Ideas April 11th - Brand new ATH 3220 & PPI✨ MARKET CONTEXT:
Gold is currently testing the 3220 supply ceiling after a massive bullish leg. Liquidity has been swept above March highs, and PA is now in a highly reactive zone. If price rejects here, we look for imbalances to be mitigated below before continuation.
🙌Wait for clear PA confirmation on all entries (5-15m structure shift, engulfing candles, liquidity grabs).
If PPI news hits hard, we might see manipulation — trade after the first 15–30 min.
Don’t overtrade. Let the levels come to you.
Goldie loves the drama. You love the sniper entries. 💅🏽🎯
🎯 Key Reversal Zones for Friday (Potential Pullback if News Hits or Profit Taking Begins):
1. 3190–3195: Minor mitigation zone for continuation longs.
2. 3183–3189: Ideal for sniper entries on a juicy dip.
3. 3170–3175: Key mid-structure retest + liquidity zone.
4. 3148–3155: Full pullback area if market turns bearish post-news.
Keep these levels on your radar, especially if Friday gets volatile. Don’t chase the hype—let price come to you.
🧵 Key Imbalance Refill Zones:
- 3195–3203: First scalp area, high confluence.
- 3178–3184: Strong impulse base.
- 3162–3169: Ideal sniper entry with bullish PA.
- 3148–3154: Big daddy support (but news sensitive!).
📌 Important Notice!!!
The above analysis is for educational purposes only and does not constitute financial advice. Always compare with your plan and wait for confirmation before taking action.
📣 If this strategy sparked clarity, hit that like button and follow our community for more in-depth ideas. 💛

Gold: supported by tariff paradoxTariffs is currently the only word that occupies investors' sentiment. Tariff- induced rhetoric of the US Administration and other world governments is strongly impacting market uncertainty, bringing high volatility to traditional markets. During this period, the price of gold significantly gained in value, strongly supported by tariffs-paradox.
During the previous week, the long term line connecting highs from April and October 2024 was clearly breached. The price of gold reached a fresh, all time highest level at $3.240, reached on Friday's trading session. The price of gold is currently moving in an uncharted territory. The RSI for one more time reached the clear overbought market side, ensign the week at the level of 71. There are no changes with MA 50 and MA200, as they continue to move as two parallel lines with an uptrend.
Gold had always been perceived as a safe-haven for funds, and as a historical holder of the value. This is one of the main reasons why the price of gold strongly gained during the previous period. It is currently driven by fundamentals, and there is a high probability that fundamentals will continue to support the price of gold in the future period. As it is currently moving in an uncharted territory, there is a challenge to predict any level to the upside in the coming period. However, in case of a modest reversal, the price of gold might revert back, until the levels around the $3.170.

TP 3288-3295 Last tp of this cycle As its been long awaited target 🎯 we now approaching this yearly top of trend to complete its wave count my expectations we drop from 3290 plus minus few pips and stabilisation around 3080 plus minus few points then next some up and down momentum then slowly we will complete retrace now question is this end of entire bull cycle of all financial instruments stocks bonds crypto etc possibly yes this will be end of giga bull run of 100 years cycle 🔃

GOLD → Global economic risk indicator consolidates ahead of CPIFX:XAUUSD , rather quickly changes the market structure to bullish and continues its aggressive rally. The economic risk indicator is working perfectly. Technically, the focus is on the range 3135 - 3099
Gold is consolidating around $3,100 in anticipation of US inflation data. The escalating trade war between the US and China keeps demand for defensive assets alive despite the pause in price gains. Trump imposed 125% tariffs on Chinese goods and China retaliated with duties of 84% on U.S. imports. Increased tariff tensions are raising recession expectations and encouraging bets on a Fed interest rate cut, which supports gold. However, a rise in March CPI inflation (expected 2.6% y/y) could trigger a downward correction, although the impact could be short-lived - tariff news remains the main driver
Technically, the price failed to reach the 3135 liquidity zone and reversed, which attracted the crowd willing to sell (deceptive maneuver). But, after correction the price may return to the target quite quickly
Resistance levels: 3135, 3167
Support levels: 3100, 3090, 3077
Emphasis on the range boundaries, possible retest of 3100-3090- 3075 before continuation of growth. On the news or before the opening of the American session there may be a long squeeze before the continuation of growth.
Regards R. Linda!

XAUUSD 1H CHART PATTERN Upon examining the gold price action on the 1-hour chart, it's evident that the market recently achieved a fresh high, reaching up to $3245. This upward move indicated strong bullish momentum at that point. However, shortly after hitting this level, the price experienced a noticeable correction. This retracement not only pulled the price lower but also suggested a potential shift in the market structure, indicating that bullish strength may be weakening.
Currently, all eyes are on the $3214 level, as it appears to be a key support-turned-resistance zone. If the price remains suppressed below this threshold and fails to regain momentum above it, it could confirm a bearish continuation pattern. Should this scenario play out, we can anticipate further downside movement in the short term.
The next possible support levels, or downside targets, to watch for in sequence are $3190, $3178, $3156, and eventually $3140. These levels may act as areas of interest for traders looking for potential bounces or further breakdowns, depending on overall market sentiment and price behaviour near each zone.

Lingrid | GOLD Retracement Likely Before UPWARD Continuation The price perfectly fulfilled my previous idea . It reached the target. OANDA:XAUUSD broke and closed above the swap zone around 3050, which was also Monday's high. The price is now testing the zone above the 3100 level, and I anticipate a potential pullback following the recent bullish extension. Given today's high-impact news, the market may drop from the resistance zone. If the price forms a retracement toward the support level, where we have an upward trendline and swap zone, there is a good chance of the price to rebound. Another scenario could be sideways movement, as we previously observed sideways action at this zone when looking to the left. Overall, I expect a pullback followed by continuation. My goal is resistance zone around 3145
Traders, if you liked this idea or if you have your own opinion about it, write in the comments. I will be glad 👩💻

GOLD ROUTE MAP UPDATEHey Everyone,
Piptastic day on the markets today with our chart idea playing out, as analysed.
After failing to open the swing range yesterday, we stated that the retracement range will continue to provide support back into the Bullish Goldturn targets. The retracement range gave the bounce into 3015, 3034, 3055 just like we said.
The momentum was too strong to get the ema5 lock above 3055 to confirm 3078. However, the candle body close above 3055 gave the confirmation for the 3078 target, which was also hit completing this range
We will now look for a break above 3078 for a continuation above or a rejection here will see the lower Goldturns tested again for the bounces. The market is moving in bigger ranges so candle body close can also give earlier confirmations for the next Goldturn without ema5 lock.
We will keep the above in mind when taking buys from dips. Our updated levels and weighted levels will allow us to track the movement down and then catch bounces up.
We will continue to buy dips using our support levels taking 30 to 40 pips. As stated before each of our level structures give 20 to 40 pip bounces, which is enough for a nice entry and exit. If you back test the levels we shared every week for the past 24 months, you can see how effectively they were used to trade with or against short/mid term swings and trends.
BULLISH TARGET
3055 - DONE
EMA5 CROSS AND LOCK ABOVE 3055 WILL OPEN THE FOLLOWING BULLISH TARGET
3078 - DONE
EMA5 CROSS AND LOCK ABOVE 3078 WILL OPEN THE FOLLOWING BULLISH TARGET
3094
EMA5 CROSS AND LOCK ABOVE 3094 WILL OPEN THE FOLLOWING BULLISH TARGET
3119
EMA5 CROSS AND LOCK ABOVE 3119 WILL OPEN THE FOLLOWING BULLISH TARGET
3148
BEARISH TARGETS
3034 - DONE
EMA5 CROSS AND LOCK BELOW 3034 WILL OPEN THE FOLLOWING BEARISH TARGET
3015 - DONE
EMA5 CROSS AND LOCK BELOW 3015 WILL OPEN THE FOLLOWING BEARISH TARGET
2999 - DONE
EMA5 CROSS AND LOCK BELOW 2999 WILL OPEN THE FOLLOWING BEARISH TARGET
2975 - DONE
EMA5 CROSS AND LOCK BELOW 2975 WILL OPEN THE SWING RANGE
SWING RANGE
2950 - 2922
As always, we will keep you all updated with regular updates throughout the week and how we manage the active ideas and setups. Thank you all for your likes, comments and follows, we really appreciate it!
Mr Gold
GoldViewFX

Gold Technical Outlook: Bounce Likely Before Deeper Drophello guys.
The recent price action on gold suggests a potential short-term upward move, followed by a possible continuation to lower levels based on key technical factors:
🔹 1. Channel Support Touched – Expecting a Bounce
Price has touched the bottom boundary of the ascending channel, which has acted as dynamic support throughout this trend.
This technical level often brings in buyers, suggesting we may see a relief rally or bounce from this area.
🔹 2. Targeting Upper Blue Zones
If this upward correction materializes, price could reach:
The first blue resistance area around 3,090 – 3,100.
Possibly the second zone near 3,120, which aligns with previous structure and minor volume resistance.
These zones offer ideal points for watching price reaction—either rejection for shorts or breakout confirmation.
🔹 3. Potential for Further Downside
If the price gets rejected from one of those resistance areas, we could see a move down to:
The low-volume zone below 3,000, specifically the support at 2,965.
The lack of volume profile in this area (as shown on the left) suggests that once price enters this zone, it can drop quickly due to thin liquidity.
📌 Conclusion
Short-term bullish: bounce from channel support targeting 3,090–3,120.
Mid-term bearish bias: If rejection occurs in resistance zones, anticipate a drop to 2,965 or even lower.
Watch for confirmations on lower timeframes to refine entry and exit points.

GOLD NEXT MOVE (selling continued)(07-04-2025)Go through the analysis carefully and do trade accordingly.
Anup 'BIAS for the day (07-04-2025)
Current price- 3030
"if Price stays below 3058, then next target is 3020, 3000, 2970 and 2950 and above that 3080 ".
Note- if 30 Minutes resistance breaks then keep this structure in your mind
Caution:
keep this structure in your mind
-POSSIBILITY-1
Wait (as geopolitical situation are worsening )
-POSSIBILITY-2
Wait (as geopolitical situation are worsening)
Best of luck
Never risk more than 1% of principal to follow any position.
Support us by liking and sharing the post.

GOLD → Bounce back to accumulate energy before growthFX:XAUUSD confirms interim bottom at 2970 after a false breakdown and as part of the escalating trade war, price is strengthening from support to the important medium-term level of 3054.
Further dynamics will depend on the market reaction to the minutes of the March Fed meeting and the introduction of reciprocal tariffs between the US and China. The introduction of 104% duties on Chinese goods increases trade tensions, reduces investor confidence and supports the price of gold against the background of a weakening dollar. Even with the Fed's cautious rhetoric, gold may keep rising due to the escalating trade war.
The medium-term situation depends on the Fed (namely hints or actions on rate cuts), the trade war and negotiations on the situation in Eastern Europe
Resistance levels: 3054, 3077, 3099
Support levels: 3033, 3013 (0.5f), 2995
Since the opening of the session (the price has passed the daily norm) gold has exhausted the technical potential and the 3054 area may push the price down (false breakout). As part of a technical pullback, gold may test 3033 - 3013 before looking at upside attempts again.
Additional scenario: pullback to the fvg zone (0.7 - 0.79 fibo) before further growth.
Regards R. Linda!

Daily live trade with XAUUSD in 15m/30m/1h 20250411Daily live trade with XAUUSD in 15m/30m/1h 20250411

Silver falling behind.By this measure, silver is falling behind now, as gold (vs cpi) is above its historical breakout line.
Silver has better chances of catching up AFTER stock markets bottom from an important bear market.

"Gold on Fire: Demand Zone Bounce with Bullish Target Ahead! "Key Zones & Levels:
Demand Zone 🔵
Area: 3099.36 – 3110
This is where buyers stepped in strongly before – price bounced up from here twice!
Strong support zone!
Resistance / Mini Consolidation ⚠️
Around 3125 – 3135
Price is hesitating here – needs to break this box for continuation.
Target Point 🎯
Level: 3168.17
Based on previous highs – this is the bullish target zone!
Stop Loss ❌
Level: 3099.36
Placed just below the demand zone to limit losses if price breaks down.
Trade Idea Summary:
Entry Zone: ✍️ 3110–3125
Stop Loss: ❌ 3099.36
Target: 🎯 3168.17
Risk-Reward Ratio: 5:1 ⭐️ (Great setup!)
What to Watch For:
✅ If price holds above demand and breaks the mini consolidation, expect bullish continuation.
❌ If price drops below the demand zone, setup is invalid – risk of further decline.
