XAU/USD SELL SETUP 45_min chart analysisbreakdown of trade setup on XAU/USD (Gold vs. USD) from the visible 45-min timeframe:
---
breakdown of trade setup on XAU/USD (Gold vs. USD) from the visible 45-min timeframe:
---
Trade Setup Summary:
1. Entry Point:
$3,220.175
This is where the short position begins, as shown on the chart.
2. Stop Loss (SL):
$3,228.659
The red zone above the entry, clearly marked.
3. Take Profit 1 (TP1):
$3,118.495
This is the first green target zone. Price aims to react to the demand zone here.
4. Final Target (TP Final):
$3,067.800 - $3,060.000
This lower green zone is your ultimate target, around the extended demand level.
---Please hit the like button and
Leave a comment to support for My Post!
Your likes and comments are incredibly motivating and will encourage me to share more analysis with you.
Best Regards, JAMES_GOLD_MASTER_MQL5
Thank you.
Support & Resistance Zones (as shown):
Resistance:
$3,228 - $3,225 zone (supply zone where SL is placed)
Immediate Support:
$3,218 - $3,210 (minor structure level)
$3,118 - $3,102 (main demand zone, TP1)
$3,068 - $3,060 (final support zone, final TP)
---
Trade Type:
Short/Sell position
You're aiming for a bearish move from the current supply zone down to deeper demand leveal
XAUUSD.P trade ideas

XAUUSD. Weekly trading levels 14 - 18.04.2025During the week you can trade from these price levels. Finding the entry point into a transaction and its support is up to you, depending on your trading style and the development of the situation. Zones show preferred price ranges WHERE to look for an entry point into a trade.
If you expect any medium-term price movements, then most likely they will start from one of the zones.
Levels are valid for a week, the date is in the title. Next week I will adjust the levels based on new data and publish a new post.
! Please note that brokers have a difference in quotes, take this into account when trading.
The history of level development can be seen in my previous posts. They cannot be edited or deleted. Everything is fair. :)
----------------------------------------------
I don’t play guess the direction (that’s why there are no directional arrows), but zones (levels) are used for trading. We wait for the zone to approach, watch the reaction, and enter the trade.
Levels are drawn based on volumes and data from the CME. They are used as areas of interest for trading. Traded as classic support/resistance levels. We see the reaction to the rebound, we trade the rebound. We see a breakout and continue to trade on a rollback to the level. The worst option is if we revolve around the zone in a flat.
Do not reverse the market at every level; if there is a trend movement, consider it as an opportunity to continue the movement. Until the price has drawn a reversal pattern.
More information in my RU profile.
Don't forget to like Rocket and Subscribe!!! Feedback is very important to me!

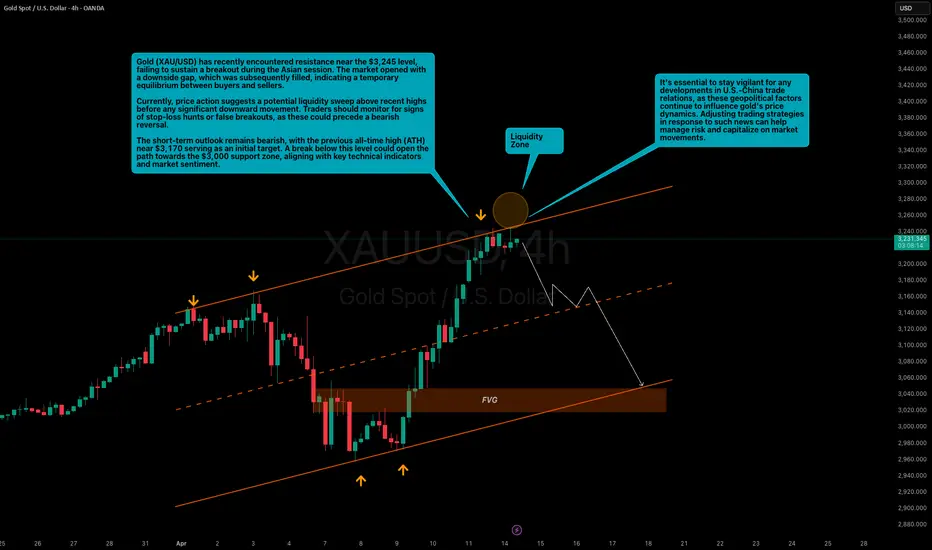
Resistance Holds at $3,245; Bearish Targets in FocusGold (XAU/USD) has recently encountered resistance near the $3,245 level, failing to sustain a breakout during the Asian session. The market opened with a downside gap, which was subsequently filled, indicating a temporary equilibrium between buyers and sellers.
Currently, price action suggests a potential liquidity sweep above recent highs before any significant downward movement. Traders should monitor for signs of stop-loss hunts or false breakouts, as these could precede a bearish reversal.
The short-term outlook remains bearish, with the previous all-time high (ATH) near $3,170 serving as an initial target. A break below this level could open the path towards the $3,000 FVG as well as support zone, aligning with key technical indicators and market sentiment.
It's essential to stay vigilant for any developments in U.S.-China trade relations, as these geopolitical factors continue to influence gold's price dynamics. Adjusting trading strategies in response to such news can help manage risk and capitalize on market movements.
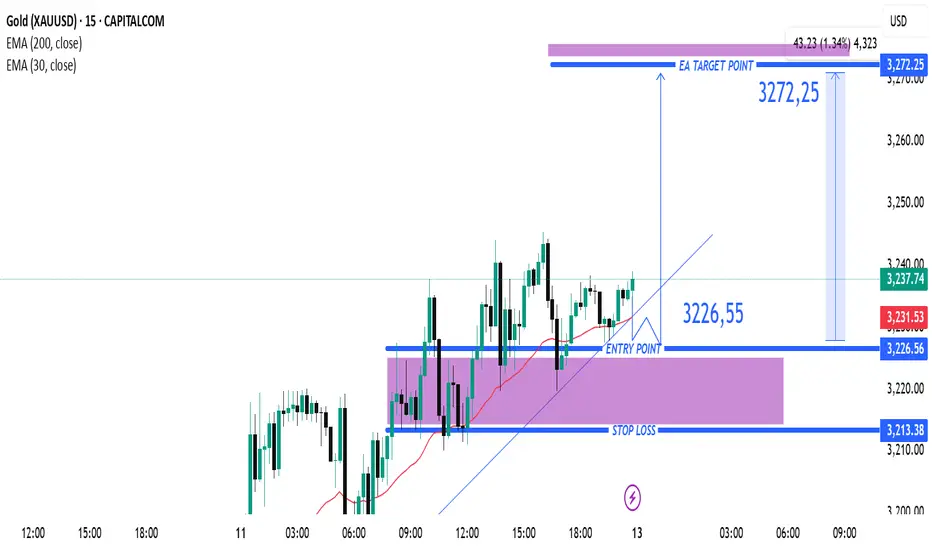
Gold (XAUUSD) 15-Min Buy Setup: Bullish Breakout with High Risk-Instrument: XAUUSD (Gold vs. US Dollar)
Timeframe: 15 minutes
Indicators:
EMA 200 (Blue): 3,170.78 (long-term trend indicator)
EMA 30 (Red): 3,231.53 (short-term trend indicator)
---
Key Levels:
Entry Point: 3,226.55 (highlighted with a blue arrow and line)
Stop Loss: 3,213.38 (purple zone bottom)
Target (Take Profit): 3,272.25
---
Trade Setup:
Type: Long (Buy) Position
Risk-to-Reward Ratio:
Risk: ~13.17 points (from 3,226.55 to 3,213.38)
Reward: ~45.7 points (from 3,226.55 to 3,272.25)
R/R Ratio: Approximately 3.5:1, which is favorable
---
Market Context:
Price is curren
GOLD PRICES SURGED DURING ASIAN SESSIONGold prices rebounded during Wednesday’s Asian session as the demand for safe haven increased in the wake of U.S. tariffs. However, spot prices were resisted around $3,058.
Adding fuel to the rally was a weakening dollar, with the dollar index sliding and further boosting gold’s demand.
Meanwhile, gold spot tested $2,956 level on Monday which happened to be three weeks low, reacting to the tariff announcement by President Trump. Like many other asset classes, the yellow metal came under pressure late last week into Monday as a result of the risk-off environment triggered by the U.S. tariffs, announced on April 2nd.
As nations responded with retaliatory measures, global stock markets tumbled across board. As markets priced in the U.S. tariff, gold on the front radar leads the charge with a 2.35% daily gain as of the time of writing.
UPCOMING CATALYST:
On the radar this week: FOMC is meeting minutes is expected to be on the wire later today Wednesday 9th at 10PM GMT+4, Followed by U.S. annual inflation data and weekly unemployment claims on Thursday at 4:30PM. While on Friday, attention would tilt towards PPI, consumer sentiment and inflation expectation at 4:30PM and 6:00PM respectively.
While these data points could spark market volatility, the U.S. tariffs and retaliatory measures by nations carry even greater significance at this point.
TECHNICAL VIEW
From a technical perspective, gold spot prices rebounded after hitting a three-week low of $2,956 on Monday, April 7th. Prices surged and was resisted around $3,058 zone which is in confluence with the 50-day EMA. The RSI hovers around 53, signaling neutrality and potential for further upside.
With rising demand for safety among investors and traders, analysts expect prices to potentially rally toward $3,130 and beyond in the cause of the week. However, if bearish momentum takes over, prices could tank toward the $3,000 level and possibly test the $2,960 zone later this week, according to technical analysts.

Xau usd Xau reached It's ATH last Week. Today being monday, immediately the market opened It bought up to 'it's ATH which is also the high o fthe previous week/ fri . A down trend was formed On monday which Created a Symmetric Triangle. I expect It to buy after breaking the triangle.. The Target is the ATH

GOLDMASTERS1 | XAUUSD H1
---
GOLD/USD Price Action Update - 1H Chart
The bulls are currently in full control as the price has broken through key resistance levels and is approaching new highs at $3,236.680.
Multiple CHoCH (Change of Character) and BOS (Break of Structure) confirm bullish momentum.
Price previously respected the ORDERBLOCK zones around $2,950 and $3,070 before this strong rally.
Current structure suggests a potential retest of the nearest SUPPORT zone around $3,130, which aligns with a previous order block.
Traders should watch for:
A possible retest at support before continuation.
Confirmation of bullish entries at the order block or trendline support.
Reaction at higher levels for potential profit-taking or reversal signs.
Stay disciplined and follow your risk management!
---
Disclaimer: This post is for educational and informational purposes only and does not constitute financial advice. Trading involves substantial risk and is not suitable for every investor. Please do your own research and consult with a licensed financial advisor before making any trading decisions.
GOLDMASTERS1---

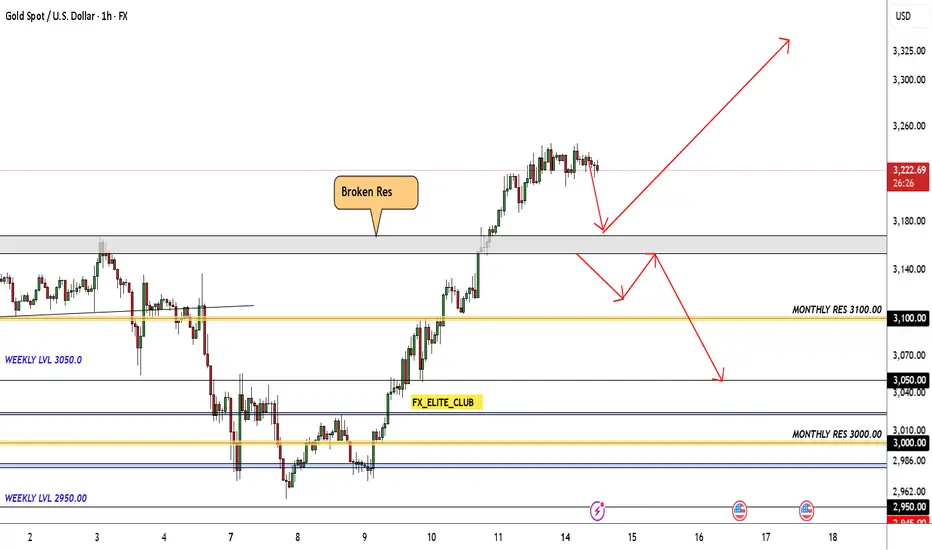
GOLD 2 Excepted Scenarios Very Clear , Which One You Prefer ? Here is my opinion on GOLD Chart , the price broke the highest Res , and continue to upside , so i think we have 2 ways in this pair right now , if the price go back to retest the broken res area and give us a good bullish Price Action we can enter a buy trade with smal lot size cuz the price at very high price , and if we have a clear closure below it , we can enter a sell trade with 500 pips target .
XAU/USD "The Gold" Metal Market Heist Plan (Scalping/Day Trade)🌟Hi! Hola! Ola! Bonjour! Hallo! Marhaba!🌟
Dear Money Makers & Robbers, 🤑💰✈️
Based on 🔥Thief Trading style technical and fundamental analysis🔥, here is our master plan to heist the XAU/USD "The Gold" Metal Market. Please adhere to the strategy I've outlined in the chart, which emphasizes short entry. Our aim is the high-risk Pink MA Zone. Risky level, oversold market, consolidation, trend reversal, trap at the level where traders and bullish robbers are stronger. 🏆💸"Take profit and treat yourself, traders. You deserve it!💪🏆🎉
Entry 📈 : "The heist is on! Wait for the breakout then make your move at (3185) - Bearish profits await!"
however I advise to Place sell stop orders below the Breakout level (or) after the breakout of Support level Place sell limit orders within a 15 or 30 minute timeframe most NEAREST (or) SWING low or high level for Pullback entries.
📌I strongly advise you to set an "alert (Alarm)" on your chart so you can see when the breakout entry occurs.
Stop Loss 🛑: "🔊 Yo, listen up! 🗣️ If you're lookin' to get in on a sell stop order, don't even think about settin' that stop loss till after the breakout 🚀. You feel me? Now, if you're smart, you'll place that stop loss where I told you to 📍, but if you're a rebel, you can put it wherever you like 🤪 - just don't say I didn't warn you ⚠️. You're playin' with fire 🔥, and it's your risk, not mine 👊."
📌Thief SL placed at the nearest/swing High or Low level Using the 30min timeframe (3240) Day/Scalping trade basis.
📌SL is based on your risk of the trade, lot size and how many multiple orders you have to take.
Target 🎯: 3130
💰💵💴💸XAU/USD "The Gold" Metal Market Heist Plan (Day / Scalping Trade) is currently experiencing a Neutral trend (there is a chance to move bearishness).., driven by several key factors.👇👇👇
📰🗞️Get & Read the Fundamental, Macro, COT Report, Quantitative Analysis, Sentimental Outlook, Intermarket Analysis, Future trend targets... go ahead to check 👉👉👉🔗🔗
⚠️Trading Alert : News Releases and Position Management 📰 🗞️ 🚫🚏
As a reminder, news releases can have a significant impact on market prices and volatility. To minimize potential losses and protect your running positions,
we recommend the following:
Avoid taking new trades during news releases
Use trailing stop-loss orders to protect your running positions and lock in profits
💖Supporting our robbery plan 💥Hit the Boost Button💥 will enable us to effortlessly make and steal money 💰💵. Boost the strength of our robbery team. Every day in this market make money with ease by using the Thief Trading Style.🏆💪🤝❤️🎉🚀
I'll see you soon with another heist plan, so stay tuned 🤑🐱👤🤗🤩
2 hours ago

Potential XAUUSD SELL Setup INCOMMING! Take 2Same Idea As My Last.
For my last idea Asian BUYERS held key 4Hr lows and retested the highs.
-Upon retest of highs, SL was hit at the 3228 level
-London tested highs an lows
-27 rejections once again spot on
Closure needed below 3220 and within the daily range levels of (3214-16) 3210 3200 on HTF candles with a solid DAILY closure beneath 3200 level.
-PSA I am a BEAR as long as price remains under the 3230 levels.
This is not financial advice.

Gold bullish trend after breakoutThe price of GOLD violated a intraday resistance level and closed above it.
After retesting this level, the price bounced back and broke above the neckline of an ascending triangle pattern.
This suggests that there is a strong likelihood of the bullish trend continuing.

Gold weakens in the short term, backhand shorts
Gold is still in a strong oscillating trend in the large-scale cycle trend. From the trend, the short-term moving average begins to diverge downward, and the price begins to slowly fall below the previous row support band and gradually weakens in the short-term trend. Pay attention to whether there is a small rebound in the late trading to confirm the secondary decline trend. In the hourly trend, the current small arc top pattern has emerged. The K line begins to slowly stick to the short-term moving average to maintain a good oscillating downward trend. Pay attention to the support band around 3170 in the short term. Pay attention to the adjustment and repair of the short-term trend. For operation, refer to the short-term opportunity near 3215-6, and stop loss at 3221.8.
Hello traders, if you have better ideas and suggestions, welcome to leave a message below, I will be very happy

Gold Buying every dip as expectedTechnical analysis: Gold maintains Buying sentiment (remember the cycle I mentioned regarding #14-day symmetry for aggressive uptrend extension / Traders are witnessing it) from yesterday’s session Hourly 4 chart’s Support break, however the Selling pace has slowed down as Gold is already near #3,227.80 - #3,232.80 former Resistance zone due Hourly 4 chart on critically Overbought condition.
Fundamental analysis: Gold is isolated within Bullish Megaphone bounce formation and if there wasn’t parallel Buying pressure from Fundamental side, Price-action would be significantly Lower (I highlighted that only catalyst which can revive the Price-action and kick-start the relief rally is on Fundamental side). The Hourly 4 chart’s indicators were showcasing that Gold was Overbought and many other were about to make a Bearish roll-over as I believed that I should start preparing ourselves for a slight pullback (Medium-term trend stays Bullish though especially with DX still critically Bearish, taking strong hits and Bond Yields rejected on #3-Week Top zone). Next Resistance is priced at #3,252.80 / break of it might extend the uptrend towards #3,252.80 benchmark configuration.
My position: Gold is soaring as it represents safe-haven asset, I'd prefer to stay with the trend (Bullish). I have attempted to Buy Gold on #3,208.80 and since Price-action tested #3,214.80 I moved my Stop on breakeven and it got triggered moments ahead which left me without order and Gold delivered #3,225.80 extension. However I have managed to re-Sell #3,225.80. I will keep Buying every dip on Gold for maximum Profit optimisation from my calculated re-Buy zones. #3,192.80 is Support for current Bullish motion.

Hanzo | Gold 15 min Breaks – Will Confirm the Next Move🆚 Gold
The Path of Precision – Hanzo’s Market Strike
🔥 Key Levels & Breakout Strategy – 15M TF
🔥 Deep market insight – no random moves, only calculated execution.
☄️ Bearish Setup After Break Out – 3212 Zone
Price must break liquidity with high volume to confirm the move.
🩸 15M Time Frame Confluence
————
CHoCH & Liquidity Grab @ 3245
Key Level / Equal lows Formation - 3212
Strong Rejection from 3100 – The Ultimate Pivot
Strong Rejection from 3240 – The Ultimate Pivot
Strong Rejection from 3200 – The Ultimate Pivot
🔥 1H Time Frame Confirmation
Twin Wicks @ 3212 – Liquidity Engineered
Twin Wicks @ 3168 – Liquidity Engineered
Twin Wicks @ 3135 zone – Liquidity Engineered
☄️ 4H Historical Market Memory
——
💯 3 Apr 2025 – Bullish Retest 3054
💯 27 march 2025 – Bullish Retest / Spike 3054
💯 26 March 2025 – Liquidity Grab Range 3016 : 3010
👌 The Market Has Spoken – Are You Ready to Strike?

Hanzo | Gold 15 min Breaks – Will Confirm the Next Move🆚 Gold
The Path of – Hanzo’s Market Strike
🔥 Key Levels & Breakout Strategy – 15M TF
Deep market insight – no random moves, only calculated execution.
☄️ Bullish After Break Out – 3239 Zone
Price must break liquidity with high volume to confirm the move.
☄️ Bearish After Break Out – 3216 Zone
Price must break liquidity with high volume to confirm the move.
🩸 15M Time Frame Analysis
CHoCH & Liquidity Grab
—
CHoCH & Liquidity Grab @ 3240
CHoCH & Liquidity Grab @ 3185
Strong Rejection from 3100 – The Ultimate Pivot
Strong Rejection from 3240 – The Ultimate Pivot
Strong Rejection from 3200 – The Ultimate Pivot
🔥Key Level / Equal Area
—
Key Level / Equal lows Formation - 3195
Key Level / Equal High Formation - 3245
X6 Retest Valid Key level - 3239
X6 Retest Valid Key level - 3212
👌 The Market Has Spoken – Are You Ready to Strike?

keep aiming for new ATH next week✍️ NOVA hello everyone, Let's comment on gold price next week from 04/14/2025 - 04/18/2025
🔥 World situation:
Gold extended its remarkable rally for a third consecutive session on Friday, surging to a fresh record high of $3,245 amid intensifying US–China trade tensions. The precious metal posted impressive gains of over 2% as fears of a prolonged trade war and its potential fallout on the global economy sent investors flocking to safe-haven assets. At the time of writing, XAU/USD is trading around $3,233.
The North American session saw China retaliate with a 125% tariff on US imports, following President Donald Trump’s move to raise tariffs on Chinese goods to 145%. The heightened geopolitical strain triggered a flight to safety, propelling Gold higher. Further fueling the rally was a sharp decline in the US Dollar, which tumbled to a near three-year low, with the US Dollar Index (DXY) falling to 99.01.
🔥 Identify:
The huge growth shows no signs of stopping, gold prices continue to benefit from tariff policies, continue to find new ATH early next week
🔥 Technically:
Based on the resistance and support areas of the gold price according to the H4 frame, NOVA identifies the important key areas as follows:
Resistance: $3255, $3280
Support : $3157, $3070
🔥 NOTE:
Note: Nova wishes traders to manage their capital well
- take the number of lots that match your capital
- Takeprofit equal to 4-6% of capital account
- Stoplose equal to 2-3% of capital account
- The winner is the one who sticks with the market the longest

XAUUSD: 15/4 Today’s Market Analysis and StrategyGold technical analysis
Daily chart resistance 3300, support below 3176
Four-hour chart resistance 3250, support below 3190-3150
One-hour chart resistance 3250, support below 3210
Gold news analysis: Gold prices remained above 3200 on Monday, indicating that the overall market sentiment is still cautiously optimistic. The main factors driving this round of market conditions include uncertainty in the global trade environment, a weaker dollar, and continued warming of safe-haven demand. During the session, investors' reactions to the latest tariff remarks intensified gold price fluctuations, but fundamental and technical support remained solid, and the strong pattern of gold did not show any significant shakes. The trend of the US dollar played an important role in this round of gold price fluctuations. The US dollar index hit a three-year low, making gold denominated in US dollars more attractive to overseas buyers. Behind the weakness of the US dollar, there are both market concerns about the outlook for the US economy and the drive of diversified reserve needs of global central banks. Analysts from well-known institutions said that the weakening of the US dollar and global economic uncertainty constituted a solid support for gold prices. In addition, the global central bank's demand for gold purchases remains strong. Since the beginning of this year, many central banks have continued to increase their gold reserves to cope with potential currency fluctuations and geopolitical risks.
Gold operation suggestions: Gold opened lower yesterday and touched 3209 and then began to rise. It reached the historical high of 3245 again and then began to adjust and adjust. It retreated slightly in the European session and continued to accelerate in the US session. It bottomed out and began to rise after reaching 3193.
From the current trend analysis, today's upper short-term resistance focuses on the 3250 mark, and the lower support focuses on the one-hour level 3210 and the four-hour level 3190 support. In terms of operation, continue to buy in line with the trend when stepping back to this position. At the same time, gold is currently in a severely overbought state and beware of a sharp correction.
Buy: 3210near SL: 3205
Buy: 3190near SL: 3185

XAUUSDlooking for long positions as shown in analysis. always do proper risk management.
By sharing your ideas in the comment below will help us understand financial markets better..

XAUUSD Has got rejected as expected!XAUUSD 1h price hit key level with more than 1.6ATR which is first sign of false breakdown. Followed by another strong bullish rejection with cross of 20EMA closed as bullish engulfing pattern signaling potential trend continuation to the major direction as long term trend is up.
We are targeting at least 130 pip+ in the first push to the upside!

Gold Breaks Short-Term Trend – Retrace or Reversal Ahead?With all-time highs in play, Gold remains unpredictable. Instead of chasing, we’re looking for a retrace back to the recent consolidation zone before eyeing new highs. A head and shoulders reversal is still on the table, and the H4 uptrend is broken—so short-term bias shifts until a bounce confirms re-entry.


4/15 Gold Trading StrategyYesterday, gold experienced a mild pullback and found support near the 3200 level. As mentioned during intraday updates, as long as 3188 holds, it remains a good opportunity to consider buying. Currently, the price has rebounded above 3220. From the candlestick formation, the trend remains strong, and there is still room for further upside. The previous high near 3245 is likely to be tested again, and there’s potential for a move towards 3260.
However, it’s important to pay close attention to the 3230–3240 zone, which was a key area of trapped long positions from last week. This supply zone hasn’t been fully tested since the last drop, and as prices revisit this area, those looking to break even may create significant selling pressure. If this pressure leads to a rejection, we could see a sharp pullback.
Structurally, a failure to break above this resistance could signal the formation of a short-term top, presenting a tactical opportunity for the bears. Conversely, if gold manages to break and hold above 3245, short-term bullish momentum may continue, though the 3250–3270 region remains a strong resistance zone.
On the downside, if prices retreat again and break below 3188, it will likely confirm a deeper correction. Key support then shifts to the 3158–3147 range, which represents a significant medium-term support zone.
Today’s Trading Recommendations:
Sell Zone: 3250-3270 – A strong resistance area, suitable for initiating short positions for aggressive traders.
Buy Zone: 3158 - 3147 – A technical support region ideal for light long entries if price pulls back.
Range Trading: 3240 -3200 and 3178 -3220 – These zones are suitable for flexible trading strategies based on real-time momentum and price behavior.
Summary:
Gold remains in a short-term bullish trend, but significant resistance lies ahead. Caution is advised when chasing long positions at higher levels. If holding short positions from the 3230+ area, avoid emotional stop-losses—patience could offer better exit opportunities as the market corrects. A bearish setup is brewing, and once a clear direction emerges, volatility may increase rapidly. Be prepared with a solid plan in advance.

GOLD (XAUUSD): The Next Important Resistance Levels
Gold updated the All-Time High yesterday and trades
in the no-man's land again.
Here are the next potentially significant resistances
based on psychological levels.
Resistance 1: 3247 - 3252 area
Resistance 2: 3397 - 3302 area
Important historic supports:
Support 1: 3128 - 3167 area
Support 2: 2953 - 2982 area
Consider these structures for pullback/breakout trading.
❤️Please, support my work with like, thank you!❤️
I am part of Trade Nation's Influencer program and receive a monthly fee for using their TradingView charts in my analysis.
