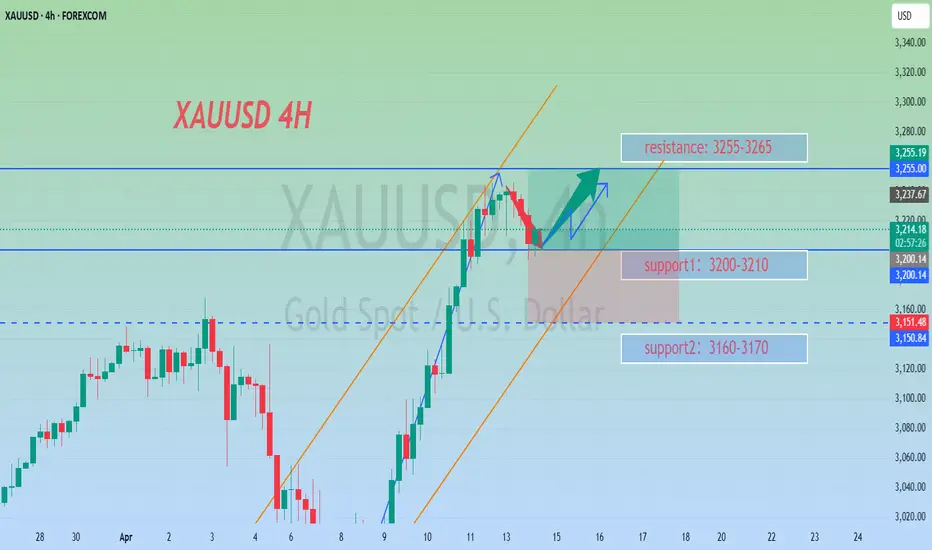
GOLD - single supporting area, holds or not??#GOLD.. now we have 3226 27 as single supporting area and if market hold it in that case we can expect a bounce from here otherwise below that we can expect again range bottom.
Good luck
Trade wisely
XAUUSD.P trade ideas

Daily live trade with XAUUSD in 15m/30m/1h 20250409Daily live trade with XAUUSD in 15m/30m/1h 20250409

XAUUSD 1H Forecast Pridication Hello guys I hope you are well
I'm about to buy gold here. Right now we are touching our support area and heading towards the order block where our target is.

Gold for a possible shortThe metal has meet and ready for another ATH but a retest is likely near b4 the push

Gold's analytical strategy signalsThe 4H Gold/USD chart exhibits a classic Broadening Formation (also known as a Megaphone Pattern), marked by higher highs and lower lows, reflecting increased volatility and market indecision. This pattern is identified with three key swing points on both the upper and lower trendlines:
Point 1 and Point 2 formed the initial boundaries of the pattern.
Point 3, recently touched, completes the structure by testing the upper boundary of the formation near $3,238, suggesting a potential bull trap, as illustrated in the schematic overlay.
The price has sharply rallied to the top of the widening pattern, aligning with the third high, often a strong signal for reversal in this setup.
A rejection from this level is anticipated, supported by the bearish projection arrows targeting multiple demand zones.
Bearish Target Zones:
$3,180 – $3,160: Previous consolidation zone.
$3,140 – $3,120: Mid-pattern volume area with past price sensitivity.
$3,060 – $3,040: Major support zone with a strong volume node and previous reaction area.
The volume profile shows significant activity in the $3,040 zone, reinforcing it as a major demand area where buyers might step in again.

Gold selling plan!- Completed " 12345 " Impulsive Waves
- Break of Structure
- RSI - Divergence
- FVG
- Fibonacci Level - 127.00%

Gold fluctuates at a high level, how to choose the direction?This week, the gold market showed a high range oscillation pattern. After opening at 3210 on Monday, it quickly rose to the historical high of 3245, but the daily line closed with a negative cross needle, indicating that the long-short game intensified. The gold price fluctuated and fell in the Asian and NY periods. Although the NY period showed a short-term illusion of a high rise, it failed to break through 3227 and plunged to 3193 under pressure. The rebound in the late trading recovered some of the lost ground.
The current price of gold is running in the range of 3245-3193, and it continued to consolidate in a narrow range at 3215 today. It is worth noting that the market generally expects the unilateral 100-point market last week to reappear, but ignores the characteristics of this week's oscillation and energy storage. Blindly chasing ups and downs is easy to fall into passivity. From the technical form, the upper 3237-3245 constitutes a strong resistance zone, and the lower 3193-3188 forms a key support. It is recommended that everyone maintain the thinking of range operation, rely on support and resistance to choose the opportunity to buy low and sell high, and wait patiently for the market to clarify the direction before making trend layout.
Operation strategy 1: It is recommended to go short at rebound 3225-3230, SL: 3237, TP: 3200-3190.
Operation strategy 2: It is recommended to go long at callback 3190-3185, SL: 3177, TP: 3210-3220.

XAU/USD "The Gold" Metals Market Heist Plan (Swing/Day Trade)🌟Hi! Hola! Ola! Bonjour! Hallo! Marhaba!🌟
Dear Money Makers & Robbers, 🤑 💰💸✈️
Based on 🔥Thief Trading style technical and fundamental analysis🔥, here is our master plan to heist the XAU/USD "The Gold" Metals Market. Please adhere to the strategy I've outlined in the chart, which emphasizes long entry. Our aim is to escape near the high-risk MA Zone. Risky level, overbought market, consolidation, trend reversal, trap at the level where traders and bearish robbers are stronger. 🏆💸"Take profit and treat yourself, traders. You deserve it!💪🏆🎉
Entry 📈 : "The heist is on! Wait for the MA breakout (3260) then make your move - Bullish profits await!"
however I advise to Place Buy stop orders above the Moving average (or) Place buy limit orders within a 15 or 30 minute timeframe most recent or swing, low or high level for Pullback entries.
📌I strongly advise you to set an "alert (Alarm)" on your chart so you can see when the breakout entry occurs.
Stop Loss 🛑: "🔊 Yo, listen up! 🗣️ If you're lookin' to get in on a buy stop order, don't even think about settin' that stop loss till after the breakout 🚀. You feel me? Now, if you're smart, you'll place that stop loss where I told you to 📍, but if you're a rebel, you can put it wherever you like 🤪 - just don't say I didn't warn you ⚠️. You're playin' with fire 🔥, and it's your risk, not mine 👊."
📍 Thief SL placed at the recent/swing low level Using the 4H timeframe (3150) Swing/Day trade basis.
📍 SL is based on your risk of the trade, lot size and how many multiple orders you have to take.
🏴☠️Target 🎯: 3470 (or) Escape Before the Target
🧲Scalpers, take note 👀 : only scalp on the Long side. If you have a lot of money, you can go straight away; if not, you can join swing traders and carry out the robbery plan. Use trailing SL to safeguard your money 💰.
💰💵💴💸XAU/USD "The Gold" Metals Market Heist Plan (Day / Swing Trade) is currently experiencing a Neutral trend (there is a chance to move bullishness).., driven by several key factors.👇👇👇
📰🗞️Get & Read the Fundamental, Macro, COT Report, Quantitative Analysis, Sentimental Outlook, Intermarket Analysis, Future trend targets... go ahead to check 👉👉👉🔗🔗
⚠️Trading Alert : News Releases and Position Management 📰 🗞️ 🚫🚏
As a reminder, news releases can have a significant impact on market prices and volatility. To minimize potential losses and protect your running positions,
we recommend the following:
Avoid taking new trades during news releases
Use trailing stop-loss orders to protect your running positions and lock in profits
💖Supporting our robbery plan 💥Hit the Boost Button💥 will enable us to effortlessly make and steal money 💰💵. Boost the strength of our robbery team. Every day in this market make money with ease by using the Thief Trading Style.🏆💪🤝❤️🎉🚀
I'll see you soon with another heist plan, so stay tuned 🤑🐱👤🤗🤩

Gold is superb bullishAs we all knows that Chin and US trade war bringing gold to more higher and I still believe that it may not pause. Better to look buying on every dip.

Gold Intraday Trading Plan 4/15/2025Gold is dropping as expected from 3245 to 3195 and closed the day around 3210. Although gold is in undisputed bullish trend. I still expect the correction to continue at least to 3180. If 3180 is broken, further decline will cause gold to drop to 3140. However, if 3180 holds, gold may resume its bullish momentum.
Let's see how the market plays out today.

Strategic Analysis of GoldAlthough Trump has announced the exclusion of smartphones and computers from the list of reciprocal tariffs, which has alleviated some market concerns, due to the uncertainty of the overall tariff policy, the gold price still remains above $3,200 after falling from the intraday all - time high of $3,245 on Monday.
Judging from the current trend of gold, we should still pay attention to the resistance level in the range of 3240 - 3245. In the short term, focus on the support level in the range of 3185 - 3190. Currently, the trend has not reversed. It is likely that the bulls are pulling back to accumulate strength and move in a volatile pattern. In terms of trading operations, it is advisable to mainly go long during pullbacks.
XAUUSD trading strategy
buy @ 3195-3205
sl 3180
tp 3218-3223
If you approve of my analysis, you can give it a thumbs-up as support. If you have different opinions, you can leave your thoughts in the comments.Thank you!
XAU/USD For Bearish as Pull-Backyou can wait for pull-back near by entry point and then go short
general trend is up trend
current phase is pull-back and may be finish near by target 3
have fun :)

XAUUSD 30M CHART PATTERNThis chart shows the price action of XAU/USD (Gold Spot vs. U.S. Dollar) on a 30-minute timeframe. It appears to be a range-bound market setup, and here's a breakdown of what’s going on:
Key Elements:
1. Horizontal Range:
Support Zone: Around the 3,195 area (green highlighted zone).
Resistance Zone: Around the 3,240–3,250 area (purple zone at the top).
2. Repeated Pattern:
The price has bounced several times between support and resistance.
Red arrows mark where the price hits resistance and reverses.
Orange circles mark the bounce from support.
3. Current Trading Idea:
Entry Point: Near current price (around 3,208), just after a bounce from support.
Target (Take Profit): Around 3,245 (upper resistance zone).
Stop Loss: Just below the support zone (~3,195), to limit downside risk.
Trading Strategy:
This is a range trading approach: buy near support, sell near resistance.
The chart suggests entering a long position now, aiming for a take profit at resistance, with a stop loss placed just under support.
Want a deeper analysis or help turning this into a trading plan or alert?

12 April - Still BullishMovement is still very bullish, and there is no reason price will not continue going up. I do see the need for a retracement. This is not a prediction, but technical analysis possibility.

Continue to buy at the lower levels.Today, XAU/USD has been in a sideways consolidation phase😶, oscillating within the narrow range of 3,200 to 3,230. From a technical analysis perspective📊, the price action is currently trapped between these two key levels, with the moving averages showing a lack of clear direction. The Relative Strength Index (RSI) is hovering around the 50 mark, indicating a state of equilibrium between bullish and bearish forces.
In terms of trading strategy🧐, considering the current market dynamics, going long at the lower end of this range presents an opportunity😃. The lower bound of 3,200 has proven to be a relatively strong support level in recent sessions, as evidenced by multiple price bounces from this point. However, it is ill - advised to go short at the higher end😒.
This is because the current international situation is rather gloomy😟, fraught with numerous unstable factors. Geopolitical tensions are on the rise, and economic uncertainties are clouding the outlook. In particular, if the tariff issue escalates once more😡, given the robust safe - haven function of XAU/USD, its price is highly likely to surge again📈. Historically, during times of economic and geopolitical turmoil, gold has consistently attracted investors seeking refuge, leading to significant price appreciations.
💰💰💰 XAUUSD 💰💰💰
🎯 Buy@3200 - 3210
🎯 TP 3230 -3250
Traders, if you're fond of this perspective or have your own insights regarding it, feel free to share in the comments. I'm really looking forward to reading your thoughts! 🤗
👇The accuracy rate of our daily signals has remained above 98% throughout a month 📈! You are warmly welcome to follow us and join in on the success 🌟.👉

Gold Technical Analysis - Potential Trade SetupTime Frame: 15-Minute and 4-Hour
Pattern: Head and Shoulders Formation
---
Overview:
Currently, on the 15-minute time frame, we observe a potential Head and Shoulders pattern forming, which could indicate a bearish reversal. As we analyze further, we identify that the B wave might be completing, setting us up for the upcoming C wave to the downside.
Key Levels:
- Invalidation Level (Head of the Pattern): 3246
- Fibonacci Level (Key Area on 4-Hour Time Frame): 0.618
---
Trade Setup:
Given the formation and confirmations, we suggest considering a sell trade:
1. Entry Point: Monitor for a confirmation of the bearish move below the neckline of the head and shoulders pattern.
2. Stop Loss: Place the stop loss slightly above the invalidation level of 3246 to mitigate risk.
3. Take Profit Targets:
- TP1: 3215
- TP2: 3205
- TP3: 3195
- TP4: 3180
-TP5: 3140
Once the price moves below these levels, consider holding the sell trade down to a potential extreme target of 3140.
If we break 3140, the next support zone between 3040 and 3050 could come into play, where I expect strong buying interest for intra-day trading
---
Risk Management:
Always manage your risk appropriately. Ensure that your position size is in line with your risk tolerance and that your stop loss is strictly adhered to. Monitor the market closely, as patterns can evolve, and be prepared to adjust your strategy as needed.
Conclusion:
With the Head and Shoulders pattern and the identified Fibonacci level providing confluence for a potential downside move, we have a compelling setup for taking a sell position. Keep an eye on the market dynamics and make informed decisions.
---
Stay safe and trade wisely!

GOLD BEARS WILL DOMINATE THE MARKET|SHORT
GOLD SIGNAL
Trade Direction: short
Entry Level: 3,224.05
Target Level: 3,072.86
Stop Loss: 3,325.09
RISK PROFILE
Risk level: medium
Suggested risk: 1%
Timeframe: 6h
Disclosure: I am part of Trade Nation's Influencer program and receive a monthly fee for using their TradingView charts in my analysis.
✅LIKE AND COMMENT MY IDEAS✅

GOLD Trade Plan 14/04/2025Dear Traders,
Gold hit the resistance level of 3230 and I expect it to move back to the resistance area after a correction from the 3140-3160 areas.
If you enjoyed this forecast, please show your support with a like and comment. Your feedback is what drives me to keep creating valuable content."
Regards,
Alireza

Gold can make correction to mirorr line, after upward movementHello traders, I want share with you my opinion about Gold. After a strong breakout from the support area between 2975 - 3000 points, the price continued moving upward, forming an impulsive rally. This movement brought the asset directly into the upper support area, now acting as resistance, between 3195 - 3170 points. Once inside this zone, the bullish momentum began to slow down. This area also aligns with previous local highs and is showing clear signs of selling pressure. The recent reaction from the top of the zone suggests that the market could be preparing for a pullback. If this reaction develops further, I expect the price to head toward the mirror line, which currently acts as a dynamic support level, located around TP1 - 3120 points. This line has historically served as a key structure level - first as resistance, then flipped into support - and now may once again act as a magnet for price. A retest of this level would not break the overall bullish structure but could provide a healthy correction before the next leg. Considering the sharp push into resistance, the potential loss of bullish momentum, and the nearby structural support at 3120 points, I remain bearish in the short term, expecting a local decline. Please share this idea with your friends and click Boost 🚀

Weekly Outlook – XAUUSD Key Levels Map🟩 Weekly Outlook – XAUUSD Key Levels Map
📍 Premium Supply Zone:
‣ 3246 – 3275 → Price currently testing this premium area; potential reaction zone.
📍 Wick High / Liquidity:
‣ 3246.07 → Weekly wick = clear liquidity, useful for sweep/rejection monitoring.
📍 Weekly FVG (Fair Value Gap):
‣ 3085.16 → First key imbalance zone below current price, valid draw for bearish correction.
📍 Equilibrium Zone (Macro Weekly):
‣ ~2800 → Midpoint between recent major swing low and swing high = macro balance area.
📍 Origin of Macro CHoCH:
‣ 2372.54 → Anchored zone for deeper corrections; institutional footprint from structural shift.
Gold Trade Plan 11/04/2025Dear Traders,
Gold, contrary to technical analysis, broke the previous high and is currently within the upper boundary of the ascending channel. I expect gold to start a decline from the 3245–3280 zone, and the correction will likely be deep in terms of time. The initial target is 3100, and the final target is 2900, which is the bottom of the ascending channel.
If the ascending channel is broken, a new analysis will be required.
If you enjoyed this forecast, please show your support with a like and comment. Your feedback is what drives me to keep creating valuable content."
Regards,
Alireza

GOLD MARKERT ANALYSIS AND PRICE PREDICTION Gold is presently consolidating at the overbought position, the decision will favor the Bears and Price will drop to the Bullish Institutional Renegotiation Zone at 78% Discount Price, where it will consolidate again and Give the Bulls a perfect entry. At the moment the Bears will Drive the Price down to 3023.74. Entry is now.
stop loss and Take Profit are clearly marked out on the chat.
GOOD LUCK GUYS!

Gold (XAUUSD) — Technical and Fundamental Analysis 2HTechnical Outlook
On the 4H chart, gold is forming a rising structure and is currently trading near the 3236–3260 resistance zone, aligned with the 1.272 Fibonacci extension. This area is expected to act as a short-term cap, with a potential corrective move ahead.
🔹 Key Levels:
Resistance: 3236, 3260
Support: 3132–3140 (trendline), 3082 (horizontal zone)
🔹 Formations:
Potential retracement setup after an extended impulse
Expected correction toward 3132–3140 (rising trendline)
If support holds, price may resume the uptrend toward 3308 (1.414 Fibonacci extension)
🔹 Indicators:
RSI near overbought zone
MACD shows momentum weakening
EMA 50/200 continue to support the bullish trend
Fundamental Drivers
Inflation concerns and soft landing expectations support safe-haven flows
Market is pricing in potential Fed rate cuts in H2 2025
Central banks continue to accumulate gold reserves
Dollar weakness provides additional support for gold prices
Scenario
Base case:
Rejection at 3236–3260 → pullback to 3132–3140 → continuation toward 3308
Alternative:
Break above 3260 → direct move to 3308.
Break below 3132 → possible slide toward 3082.
