XAUUSD Gold Analysis XAUUSD formed a symmetrical triangle pattern (converging trendlines), followed by a breakdown of the ascending trendline, suggesting bearish momentum.
Price has broken below the ascending support trendline and is currently testing a minor consolidation zone, indicating potential for further downside.
🔻 Bearish Setup:
Entry Point:
Current price around $3,223.36, just below the broken ascending trendline.
Ideal sell entry confirmation has occurred with the break of the ascending trendline support.
🎯 Downside Targets:
Target 1:
$3,194.752
This level aligns with previous structure support and is the first take-profit zone.
Target 2:
$3,176.149
A deeper support zone formed by previous price action. If price continues bearish momentum, it will likely react here.
Target 3:
$3,132.646
This is a major support zone and the final take-profit level based on the chart. Reaching here would confirm a full bearish move.
🛑 Stop Loss Placement:
$3,247.014
Placed above the upper resistance trendline and recent swing high. If price breaks above this level, it invalidates the bearish pattern.
📈 Key Chart Details:
Candlestick Behavior: Multiple rejections at the upper trendline suggest strong resistance.
Volume: Volume spike at the breakdown level would further confirm bearish bias (not visible in the current image, but important to monitor).
Risk-Reward: The setup shows a favorable risk-to-reward ratio, especially if holding till Target 3.
⚠️ Potential Considerations:
Watch for fakeouts or retests of the broken trendline. A retest of $3,230-$3,235 could occur before further decline.
Monitor economic news/events like U.S. inflation, Fed announcements, or geopolitical tensions as they heavily impact gold.
✅ Conclusion:
This is a high-probability short setup for XAUUSD, with confirmation from:
Symmetrical triangle breakdown,
Lower highs,
Clear downside targets,
Well-defined stop-loss.
If bearish momentum continues and fundamentals align, gold could slide toward $3,132, completing the full projected move.
XAUUSD.P trade ideas

Gold Intraday Trading Plan 4/23/2025Gold has been wild yesterday. After hitting ATH of 3500, it went all the way down to 3367. I am expecting the serious correction to take place for a few weeks at least.
Currently it opened a gap. I am expecting the gap to be closed. I will sell from 3375, first target will be 3282.

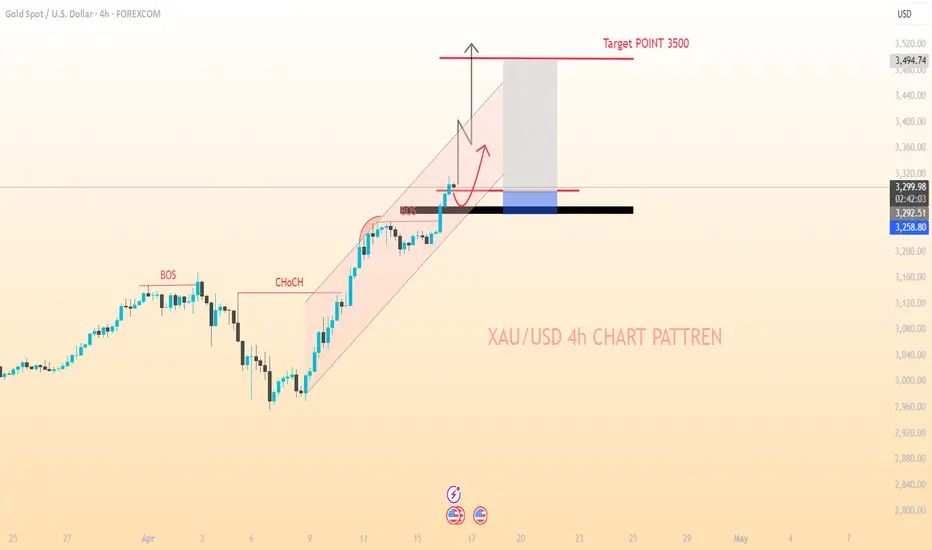
XAU/USD...4h ChartPattrenMY gold trading signal looks clear and concise. Here's a breakdown of the key elements:
*Signal Details*
1. *Entry Price*: 3296
2. *Target Price*: 3500
3. *Stop Loss*: 3250
4. *Sentiment*: Bullish, indicating strong momentum in gold prices.
*Format and Updates*
1. *Text Format*: The current format is straightforward and easy to understand. It's great for quick communication and can be easily shared via text or messaging platforms.
2. *Graphic Version*: Creating a graphic version could enhance visual appeal and make the signal stand out. You could include:
- A chart showing the entry point, target, and stop loss.
- Icons or colors to highlight bullish sentiment.
- Additional information like current price, potential profit/loss, and risk level.
*Considerations for Future Signals*
1. *Consistency*: Keeping a consistent format for your signals can help recipients quickly understand and act on them.
2. *Additional Information*: Consider including more details such as:
- Time frame for the signal (short-term, long-term).
- Rationale behind the signal (technical indicators, news, etc.).
- Risk management tips specific to this trade.
3. *Update Frequency*: Decide how often you'll update the signals. Regular updates can keep recipients informed about market changes.
*Next Steps*
- *Feedback*: Gather feedback from your audience on the preferred format and content of the signals.
- *Automation*: If you're planning to send out signals frequently, consider automating the process using trading software or platforms that can generate and send signals based on predefined criteria.
- *Education*: Provide educational resources or explanations about the signals and trading strategies to help recipients understand and make informed decisions.
Would you like to explore creating a graphic template for your signals or discuss ways to automate signal generation and distribution?
GOLD the retreat after hitting $3,500 is a natural market pause amid strong buying pressure, profit-taking, and technical overextension rather than a reversal of the bullish trend. The overall outlook remains positive, with gold continuing to benefit from safe-haven demand amid geopolitical and economic uncertainties.
Dollar Weakness: The U.S. dollar has weakened amid political and economic uncertainties, making gold more attractive as an alternative store of value.
Trade War Fears: Escalating trade tensions between the U.S. and China have increased economic uncertainty, prompting investors to seek safe-haven assets like gold.
President Trump’s Criticism of the Fed: Trump's attacks on Federal Reserve Chair Jerome Powell and calls for rate cuts have unsettled markets, weakening the dollar and boosting gold demand.
Strong Momentum and Overbought Conditions: Gold’s rapid ascent has pushed technical indicators like the Relative Strength Index (RSI) into overbought territory (around 79), which can lead to minor price pullbacks or consolidation but does not indicate a sustained sell-off.

GOLD BEST PLACE TO SELL FROM|SHORT
GOLD SIGNAL
Trade Direction: short
Entry Level: 3,458.82
Target Level: 3,187.96
Stop Loss: 3,639.42
RISK PROFILE
Risk level: medium
Suggested risk: 1%
Timeframe: 4h
Disclosure: I am part of Trade Nation's Influencer program and receive a monthly fee for using their TradingView charts in my analysis.
✅LIKE AND COMMENT MY IDEAS✅

Gold's Glory Fades: Bearish Setup in MotionHello,
🟥 XAUUSD – Pro Bearish Playbook
Resistance Breached, But the Rally Looks Exhausted
Gold (XAUUSD) has just smashed through the 1M strong resistance at 3272.314, but let’s not kid ourselves — this move is running on fumes. The rally is heavily overbought, and macro sentiment is shifting fast.
🗞 Macro Trigger: Tariff War Cooling
President Trump has thrown a curveball, suggesting the U.S. may hold off on further tariff hikes, citing concerns about the impact on American consumers.
“At a certain point, people aren’t gonna buy,” he said.
He’s not ruling out new tariffs entirely, but the tone has clearly softened. Even China is stepping back, opting not to match U.S. hikes — and now the TikTok deal is on pause until trade talks settle. This reduces geopolitical risk, and that’s a red flag for gold bulls.
📉 Why We're Bearish:
Overbought Conditions: Gold is bloated. RSI, momentum, and fundamentals all scream “top-heavy.”
Safe-Haven Demand Shrinking: With tariffs cooling and equities catching a bid, gold demand is set to fade.
False Breakout Potential: The push above 3272.314 may be a trap if we don’t get follow-through.
🧭 Bearish Strategy – The Breakdown Plan
We’re not just throwing darts — here’s how we map the fall:
🔻 Level 💰 Price 📌 Role
🟧 1D Pivot Point Use live data Key trigger – watch for bearish confirmation below here.
🟨 1M Resistance (Now Suspect Support) 3272.314 Already breached; likely won’t hold on retest.
🟥 1W Pivot Point 3146.658 Next major target if momentum continues.
🚨 Bear Max Target 2466.313 Full breakdown scenario if risk-off vanishes.
🔥 Execution Plan – What to Do
✅ Wait for confirmation below 1D Pivot.
🔻 Short the rejection at 3272.314 if it acts as resistance on retest.
🎯 Target 3146.658, then trail stops toward 2466.313 on continued weakness.
🚫 Avoid blind entries – confirmation only. This isn’t guesswork.
We’re not chasing gold higher at these levels. We’re waiting for the turn, and when it confirms — we strike.
The Support and Resistance outlined in green and red are the respective support/resistance for this pair currently for 1M-1Y timeframes!
No Nonsense. Just Really Good Market Insights. Leave a Boost
TradeWithTheTrend3344

XAU/USD intraday sell (on pullback)XAU/USD is in a strong bullish trend, with price breaking above the bearish order block at 3,450–3,460 after filling the FVG at 3,410–3,420. The break above 3,472 suggests a continuation toward 3,500, where buy-side liquidity may be targeted. A pullback to 3,450 (now support) or 3,410 (bullish OB) is eminent before the next leg up. Watch for confirmation during the London or New York kill zones

Growth potential up to 3400Description of the weekly analysis:
After a good week of trading, we move on to next week.Given the bullish market sentiment, it is not unreasonable to expect the price to rise to 3,400.
I expect the price to be ready to rise to 3400 after a correction towards 3293 or eventually the 3230-3246 support zone.
Note and reminder:
Of course, this analysis is valid as long as the price does not close below 3200.
If the analysis fails, it will be updated immediately and I will share it.
Possible positions this week:
A:Suitable prices for BUY positions
1)3300~3290
2)3230~3246
B:Suitable prices for SELL positions
1)3398~3408
This is just an analysis and everyone is responsible for their own work.
Hoping for a good and profitable week.

Daily Analysis- XAUUSD (Monday, 21st April 2024)Bias: Bullish
USD News(Red Folder):
-None
Analysis:
-Strong bullish momentum on market open
-Looking for pullback for BUY
-Potential BUY if there's confirmation on lower timeframe
-Pivot point: 3300
Disclaimer:
This analysis is from a personal point of view, always conduct on your own research before making any trading decisions as the analysis do not guarantee complete accuracy.

Gold Potential Bullish Breakout (Potential HH formation)With with continued global tariff panic between USA and China, Gold price still seems to exhibit signs of overall Bullish momentum as the price action may form a prominent Higher High on the shorter timeframes with multiple confluences through key Fibonacci and Support levels which presents us with a potential long opportunity.
Trade Plan:
Entry : 3363
Stop Loss : 3278
TP 0.9 - 1 : 3439.5 - 3448

Sell gold, target $3282Hello, traders
Gold has been wild yesterday. After hitting ATH of 3500, it went all the way down to 3367. I am expecting the serious correction to take place for a few weeks at least.
Currently it opened a gap. I am expecting the gap to be closed. I will sell from 3375, first target will be 3282.

Weekly Analysis on Gold Its been a strong bullish movement since from the last 2 weeks so for next week trading session i will focus on looking for buying trade opportunities.

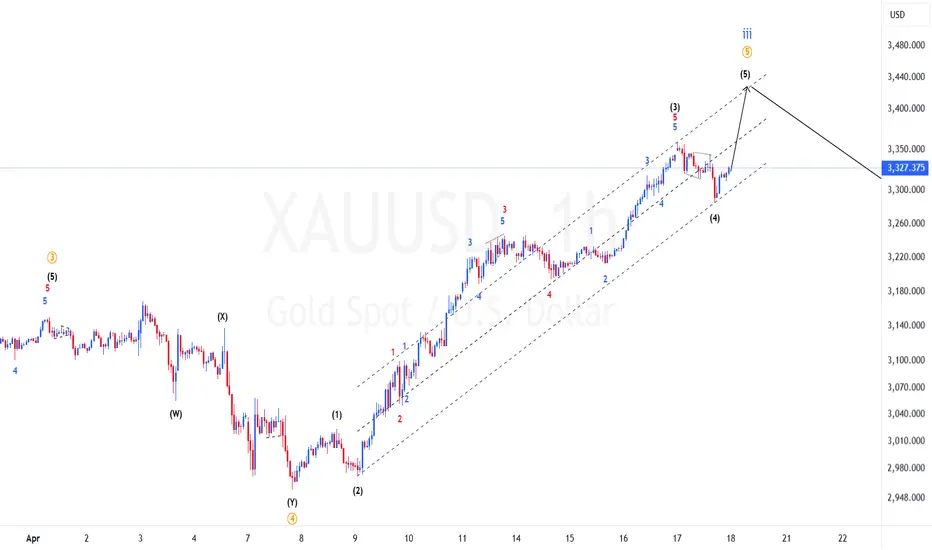
XAUUSD update: Is 4th wave complete?On our previous analysis we were expecting price to start decline to form 4th wave of higher degree but price instead of creating na impulsive down we had a clean zigzag signaling we are not yet done with the 5th wave. Now we have a recount of this 5th wave and we can see we still bullish. If this current count is correct we should expect price to continue up and find resistance at the upper trendline. Lets monitor it for a possibility of taking advantage of the continuation higher.
GOLD-SELL strategy 6 Hourly chart regression channelGOLD has moved up sharply but it is. again above the channel, and this usually will not last. It needs to correct back towards mid-channel over time.
The RSI is very overbought, but other indicators how still some upward pressure, however, I use the channel as my guidance for now.
Strategy SELL or ADD SELL @ $ 3,375-3,415 and take profit near $ 3,257 for now partially and further down rest @ $ 3,079.

Safe-haven frenzy boosts gold pricesGold market analysis and operation suggestions (April 21) - Risk aversion frenzy boosts gold prices, 3400 mark is within reach
📌 Current market dynamics:
Affected by the US tariff policy and the continued rise in geopolitical risk aversion, gold continued its unilateral surge this week. Today, it opened higher again, strongly breaking through the historical high of 3357, and accelerated to above 3380. The bullish momentum is extremely strong. According to the recent trend, gold will either consolidate at a high level, and once it starts to rise, it often presents an explosive market of more than 100 US dollars on one side. Therefore, the psychological barrier of 3400 will most likely be tested today, and may even further challenge around 3430!
📊 Technical analysis:
✅ Daily level:
Moving average system: MA5-MA10 maintains golden cross upward, showing a standard bull market arrangement
Bollinger band: The upper track continues to open, without any signs of closing, and there is still room for growth
K-line structure: Continuous large positive lines with large volume, no peak signal, and going long with the trend is still the main tone
✅ Weekly level:
Three consecutive positive lines are strong upward, MACD red column is enlarged, and bulls are obviously in control
No peak signal, any pullback can be regarded as a new buying opportunity
🎯 Key support and resistance:
Support level: 3370 (today's gap), 3357 (previous high support)
Resistance level: 3400 (psychological barrier), 3430 (next target)
🔥 Today's US trading strategy:
1⃣ Aggressive long orders: Go long directly when the price falls back to around 3370, stop loss at 3360, target 3385-3400 (hold to see 3430 if it breaks)
2⃣ Steady long orders: If it falls back to 3357 (previous high support), you can arrange long orders for the second time, stop loss at 3347, target 3380-3400
3⃣ Be cautious with short orders: The current market sentiment is extremely bullish, and the risk of going against the trend is extremely high. Avoid blindly guessing the top!
💡 Trading reminder:
Gold is currently in an extremely strong market, and any pullback is an opportunity to go long
Pay attention to the breakthrough of 3400. If it stands firm, it may accelerate to hit 3430-3450
Strictly stop loss to avoid the risk of violent fluctuations caused by sudden news
🚀 Conclusion: Trend is king, follow the trend and buy low!

Gold skyrocketing as expectedAs discussed throughout my yesterday's session commentary: "My position: Gold is soaring as it represents safe-haven asset, I'd prefer to stay with the trend (Bullish). I have attempted to Buy Gold on #3,208.80 and since Price-action tested #3,214.80 I moved my Stop on breakeven and it got triggered moments ahead which left me without order and Gold delivered #3,225.80 extension. However I have managed to re-Sell #3,225.80. I will keep Buying every dip on Gold for maximum Profit optimisation from my calculated re-Buy zones. #3,192.80 is Support for current Bullish motion."
Technical analysis: I have announced that Gold might skyrocket as next Resistance zone is priced at #3,322.80 / break of it might extend the uptrend towards #3,352.80 benchmark configuration. Gold has invalidated solid Neutral Rectangle on Hourly 4 chart and if you recall, delivered #2 additional Higher High’s extension (my chart’s explanation that Gold always delivers #3 Higher High's extensions ahead of full scale reversal, so practically I have one more Higher High’s to expect according to the cycle). DX (# -0.63% almost) is again turning the market sentiment to Bullish on Intra-day basis, and according to my estimations, current Buying sequence was due to the Trump's tariff's talks, which is being aggressively Bought due to the remarks.
My position: Congratulations for those who Bought Gold from #3,220's as per my advice.

XAUUSD 1H CHART PATTERN Upon examining the gold price action on the 1-hour chart, it's evident that the market recently achieved a fresh high, reaching up to $3245. This upward move indicated strong bullish momentum at that point. However, shortly after hitting this level, the price experienced a noticeable correction. This retracement not only pulled the price lower but also suggested a potential shift in the market structure, indicating that bullish strength may be weakening.
Currently, all eyes are on the $3214 level, as it appears to be a key support-turned-resistance zone. If the price remains suppressed below this threshold and fails to regain momentum above it, it could confirm a bearish continuation pattern. Should this scenario play out, we can anticipate further downside movement in the short term.
The next possible support levels, or downside targets, to watch for in sequence are $3190, $3178, $3156, and eventually $3140. These levels may act as areas of interest for traders looking for potential bounces or further breakdowns, depending on overall market sentiment and price behaviour near each zone.

Gold Prediction!Current Price: ~$3,326
Trend: Strong bullish breakout of ascending channel
Moving Averages: Price is far above the 50 EMA (white)
Still bullishly distanced from the 200 EMA (orange)
Structure: Clean breakout of rising channel and key horizontal resistance zones
-Strong daily candle closed above trendline resistance → this is a confirmed breakout
-No upper wick rejections or bearish engulfing candles
-Buyers remain in control until signs of exhaustion show
Plan: Only look for a Buy position setup for safer trade.

Gold bull cycle continues, 3390
Hello brothers, let's comment on the gold price next week from April 21, 2025 to April 25, 2025
💥 World Situation:
Gold prices are expected to end the year on a strong note, rising more than 2.79%, with the precious metal surging nearly $90 amid continued weakness in the U.S. dollar (USD) due to ongoing global trade uncertainties. At the time of writing, XAU/USD is trading around $3,326.
Despite hitting an all-time high of $3,358, the rally cooled slightly as both European and U.S. markets were closed as traders locked in profits ahead of the extended Easter weekend. Meanwhile, real yields edged higher, offering mild resistance. On the policy front, San Francisco Fed President Mary Daly noted that the U.S. economy remains resilient, even though some areas are showing signs of slowing. She stressed that monetary policy remains tight enough to keep inflation in check, while also hinting that the neutral rate could rise.
✡Summary:
Gold prices are still in a big uptrend, and short-term corrections will only allow gold prices to accumulate further and continue to hit new highs. Tariff tensions continue to cause gold prices to rise strongly: 3382, 3400
🔥 Technical:
According to the resistance and support levels of gold prices on the 4-hour chart, important key areas can be identified as follows:
Resistance: $3357, $3382, $3390
Support: $3284, $3260, $3155
⭐️ Note: Labaron hopes that traders can properly manage their funds
- Choose a lot size that matches your funds
- Profit is 4-7% of the fund account
- Stop loss is 1-3% of the fund account

GOLD soars over $50, heading for new ATHSpot OANDA:XAUUSD surged, with an intraday gain of more than $50, now trading around $3,281/oz to fresh all-time highs.
OANDA:XAUUSD hit a record high as the Trump administration launched investigations that could widen the trade war, boosting demand for safe-haven assets, Bloomberg reported on Wednesday. U.S. President Donald Trump on Tuesday launched an investigation into the need to impose tariffs on critical minerals, the latest move in the widening trade war.
According to a White House fact sheet, the executive order signed by Trump on Tuesday directs the secretary of commerce to initiate a Section 232 investigation under the Trade Expansion Act of 1962 to “assess the impact of imports of these materials on the security and resilience of the United States.”
On Wednesday, gold traders will focus on U.S. retail sales data for March, as well as speeches from Federal Reserve officials, primarily Chairman Jerome Powell.
Technical Outlook Analysis OANDA:XAUUSD
After gaining support from the 3,200USD price level, which is an important support for readers to pay attention to in the weekly publication, gold has skyrocketed towards the weekly target level of 3,295USD.
Currently, there is no resistance that can prevent the gold price from heading towards 3,295USD, and the uptrend is still absolutely dominant on the technical chart.
In terms of momentum, the Relative Strength Index is just approaching the overbought zone and is not giving any signal of a possible correction in the short term. Therefore, in terms of momentum, gold can still continue to increase in price.
During the day, the upward trend of gold prices will be noticed again at the following positions.
Support: 3,245 – 3,223 – 3,200 USD
Resistance: 3,295 – 3,300 USD
SELL XAUUSD PRICE 3315 - 3313⚡️
↠↠ Stop Loss 3319
→Take Profit 1 3307
↨
→Take Profit 2 3301
BUY XAUUSD PRICE 3223 - 3225⚡️
↠↠ Stop Loss 3219
→Take Profit 1 3231
↨
→Take Profit 2 3237

Is gold currently in a bullish or bearish trend?We’ve seen gold surge significantly during times of uncertainty. The problem is, when we look back at the 2008 financial crisis, we notice a similarly exponential rise, which was followed by a 45% correction after reaching its peak. Based on a current price of $3,400, a correction down to $1,800 is possible. This means it’s very realistic that gold could spike again sharply—especially if Powell ends up being fired—and then, once things start to calm down again, we could see a major correction of at least 45%.

XAUUSD buy opportunity targeting 3400XAUUSD buy opportunity targeting 3400
1. A golden opportunity emerges as XAUUSD eyes a bullish breakout.
2. Current market dynamics strongly favor long positions in gold.
3. Investor sentiment shifts amid global economic uncertainties.
4. Safe-haven demand fuels upward momentum in precious metals.
5. Technical indicators signal strong support and bullish continuation.
6. The 3400 target aligns with historical resistance and Fibonacci extensions.
7. Central bank policies and inflation concerns bolster gold's appeal.
8. Volatility in fiat currencies drives capital toward tangible assets.
9. Momentum traders are positioning early ahead of the breakout.
10. A strategic buy now could yield significant returns as gold ascends.

Gold Market Analysis: Key Levels to WatchGold Market Analysis: Key Levels to Watch
Gold is currently in a highly overbought state. Since April 10th, its price has surged past a strong resistance level, climbing up to 3245.
The price could now make a minor correction before continuing its rise, or a deeper pullback before resuming its upward trend. Let's examine two possible scenarios:
Bullish Scenario:
If gold rises above 3245, it could aim for higher targets at 3284 and 3300.
Bearish Scenario:
If gold drops below 3206, a bearish trend may unfold, with potential declines to 3167 and 3128. Both levels should be closely monitored, as a rebound from these areas could lead to a stronger upward wave. In particular, 3167 seems to be a solid support level with a higher chance of reversing the downward trend.
You may find more details in the chart!
Thank you and Good Luck!
❤️PS: Please support with a like or comment if you find this analysis useful for your trading day❤️
