Market Uncertainty and Gold Volatility: Trump's Fed Comments ShaThis week, the market has been rife with uncertainties. Former President Trump’s repeated criticisms of Fed Chair Powell—particularly regarding the pace of interest rate cuts—even raised speculation about Powell’s potential dismissal, triggering widespread market turbulence. On April 22, Trump clarified that he had no intention of firing Powell while reiterating his call for further rate cuts and praising the stock market's gains. This statement helped alleviate concerns about the stability of the Fed’s leadership.
Gold reacted sharply to these developments, experiencing wild swings on Tuesday that reflected rapidly shifting market sentiment. The precious metal’s movements remain tightly linked to geopolitical and economic headlines, with Trump’s tariff policies and rhetoric fueling safe-haven demand and driving capital into gold. However, caution is warranted—once risk appetite rebounds, prices could face a pullback. Although the daily candle swallowed the previous day’s bullish surge, a unilateral downtrend has yet to form.
Following Tuesday’s steep decline, $3,500 has been confirmed as a short-term peak, with safe-haven demand easing slightly. Gold opened lower on Wednesday at $3,312 before rebounding to $3,386, but failure to sustain upward momentum could invite renewed selling pressure, potentially pushing prices back toward $3,330. Key resistance now stands at $3,400–3,410, with support at $3,310–3,300. Analyst Xu Gucheng recommends a strategy of prioritizing short positions on rallies and considering longs on dips.
Trading Strategy 1: Buy on dips at $3,307–3,300, stop loss at $3,293, target $3,340–3,380.
Trading Strategy 2: Sell on rallies at $3,405–3,410, stop loss at $3,421, target $3,370–3,340.
XAUUSD.P trade ideas

XAUUSD 15mint ForecastHello guys I hop you are well let me tell you that our prize has just been released from our demand zone, so we can buy from here now and our target will remain and the -OB will continue. Next traget next $3408

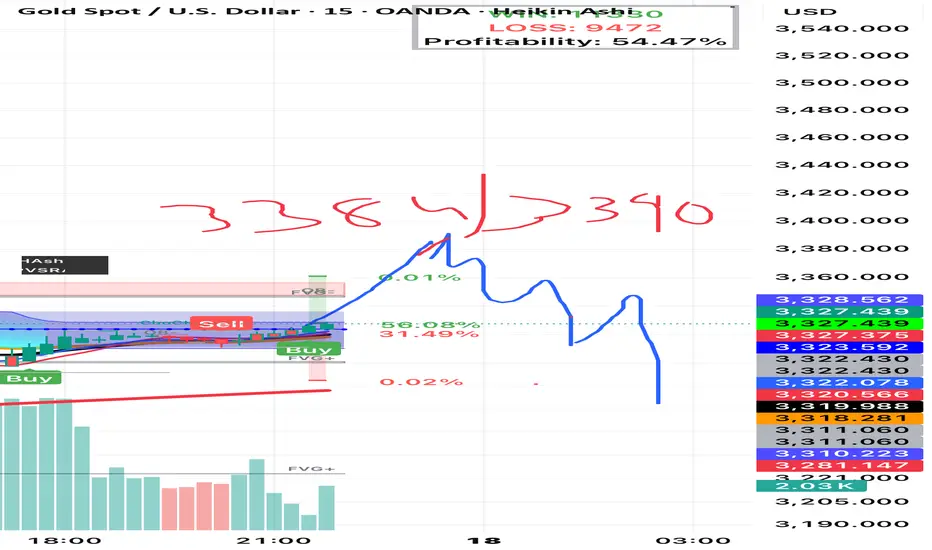
Gold bull cycle continues, 3390
Hello brothers, let's comment on the gold price next week from April 21, 2025 to April 25, 2025
💥 World Situation:
Gold prices are expected to end the year on a strong note, rising more than 2.79%, with the precious metal surging nearly $90 amid continued weakness in the U.S. dollar (USD) due to ongoing global trade uncertainties. At the time of writing, XAU/USD is trading around $3,326.
Despite hitting an all-time high of $3,358, the rally cooled slightly as both European and U.S. markets were closed as traders locked in profits ahead of the extended Easter weekend. Meanwhile, real yields edged higher, offering mild resistance. On the policy front, San Francisco Fed President Mary Daly noted that the U.S. economy remains resilient, even though some areas are showing signs of slowing. She stressed that monetary policy remains tight enough to keep inflation in check, while also hinting that the neutral rate could rise.
✡Summary:
Gold prices are still in a big uptrend, and short-term corrections will only allow gold prices to accumulate further and continue to hit new highs. Tariff tensions continue to cause gold prices to rise strongly: 3382, 3400
🔥 Technical:
According to the resistance and support levels of gold prices on the 4-hour chart, important key areas can be identified as follows:
Resistance: $3357, $3382, $3390
Support: $3284, $3260, $3155
⭐️ Note: Labaron hopes that traders can properly manage their funds
- Choose a lot size that matches your funds
- Profit is 4-7% of the fund account
- Stop loss is 1-3% of the fund account

Is gold currently in a bullish or bearish trend?We’ve seen gold surge significantly during times of uncertainty. The problem is, when we look back at the 2008 financial crisis, we notice a similarly exponential rise, which was followed by a 45% correction after reaching its peak. Based on a current price of $3,400, a correction down to $1,800 is possible. This means it’s very realistic that gold could spike again sharply—especially if Powell ends up being fired—and then, once things start to calm down again, we could see a major correction of at least 45%.

DeGRAM | GOLD Slows Under Resistance📊 Technical Analysis
GOLD failed to break out above the resistance line near $3 400 and is retreating from overbought levels; low volatility signals weakening momentum and a likely pullback toward support around $3 325.
💡 Fundamental Analysis
Short-term macro drivers also tilt bearish. Rising U.S. Treasury yields are making gold less attractive, while hawkish Fed signals fueled by strong U.S. data have strengthened the dollar.
✨ Summary
Technical and fundamental factors point to a short-term bearish correction in XAUUSD.
-------------------
Share your opinion in the comments and support the idea with a like. Thanks for your support!

Long & then short at top Wick of Cleaning 3384/33901st long next week upto 3384/3390 then short
We already formed trend reversal on 4 hour time frames this will be last wick to tick tick account stop loss hunt 3384/3390 area then it will drop continuously upto 3016 1st support area will be buying again zone because it suppose to bounce from this 3016 to go back up
Local Pause in Gold’s UptrendIn recent weeks, we've seen a strong uptrend in gold, which continues without any meaningful pullbacks.
Yes, the general rule is to trade in the direction of the dominant trend — but in this case, I’m strongly hesitant to go long while price is sitting at all-time highs.
At the moment, I would consider short positions only if signs of weakness appear — specifically, if the price starts breaking below recent local lows. As for targets, they are largely abstract, since we can’t accurately predict where a correction might stop if it does occur. Still, for reference, I’d outline three potential downside levels: 3,411, 3,404, and 3,381.
This short scenario would be invalidated if price moves above 3,490. There’s no point placing stop-losses above that level — it makes more sense to position them well below.
Keep in mind: the uptrend is very strong, and price could easily continue to rally sharply — so manage your risk accordingly.
That said, I still lean toward the idea that we may see a downside move.

XAUUSD Sell IdeaGold price have climbed very quickly in the past 72 Trading Hours and has left gaps in the market. This is famously know as "Fair Value Gap". Usually, I would only base my trade on the trend line breakout and head and shoulders pattern, but I read a definition recently, let us see if the dictionary is right.

XAUUSD: Today's trading strategy
Gold continues to rise. Before the upward trend ends, we need to continue to maintain the long strategy. The current account continues to make profits.
All trading signals are accurate. I will keep sending signals. Don't miss them.
Gold trading strategy today:
xauusd buy@3420-3430-3440
tp:3460-3480-3500

DeGRAM | GOLD Preparing to Take $3520📊 Technical Analysis
Gold couldn’t clear $3 500 and is drifting toward $3 430 support.
💡 Fundamental Analysis
Central banks keep buying— 333 t in Q4 ’24 and still rising in April ’25.
The dollar just hit a 3‑yr low on Fed‑credibility fears.
Real yields have slipped, restoring gold’s carry appeal.
IMF warns tariff tensions could chill growth, fuelling hedge demand.
Street targets climb: GS sees $3 700–4 500, JPM $3 000+.
✨ Summary
Technicals flag a pullback, yet fresh central‑bank demand, a weaker USD, lower real yields and escalating trade risks add upside torque—any bounce off $3 430 could retest $3 520.
-------------------
Share your opinion in the comments and support the idea with a like. Thanks for your support!

GOLD Technical Analysis! BUY!
My dear subscribers,
GOLD looks like it will make a good move, and here are the details:
The market is trading on 3457.8 pivot level.
Bias - Bullish
My Stop Loss - 3449.8
Technical Indicators: Both Super Trend & Pivot HL indicate a highly probable Bullish continuation.
Target - 3472.7
About Used Indicators:
The average true range (ATR) plays an important role in 'Supertrend' as the indicator uses ATR to calculate its value. The ATR indicator signals the degree of price volatility.
Disclosure: I am part of Trade Nation's Influencer program and receive a monthly fee for using their TradingView charts in my analysis.
———————————
WISH YOU ALL LUCK

Growth potential up to 3400Description of the weekly analysis:
After a good week of trading, we move on to next week.Given the bullish market sentiment, it is not unreasonable to expect the price to rise to 3,400.
I expect the price to be ready to rise to 3400 after a correction towards 3293 or eventually the 3230-3246 support zone.
Note and reminder:
Of course, this analysis is valid as long as the price does not close below 3200.
If the analysis fails, it will be updated immediately and I will share it.
Possible positions this week:
A:Suitable prices for BUY positions
1)3300~3290
2)3230~3246
B:Suitable prices for SELL positions
1)3398~3408
This is just an analysis and everyone is responsible for their own work.
Hoping for a good and profitable week.

XAUUSDHello Traders! 👋
What are your thoughts on GOLD?
Gold has successfully broken above its resistance zone and the top of the ascending channel, indicating strong bullish momentum.
Two support zones have been identified below the current price. A correction toward one of these levels is expected before the next bullish leg begins.
After a pullback to one of these support areas, we expect gold to resume its uptrend and push toward higher levels and new highs.
Among the two, the second support zone is considered a safer entry point for long positions, as it may offer stronger support and a better risk-reward setup.
💡 Which support zone would you use for your buy entry? Share your thoughts below!
Don’t forget to like and share your thoughts in the comments! ❤️

12 April - Still BullishMovement is still very bullish, and there is no reason price will not continue going up. I do see the need for a retracement. This is not a prediction, but technical analysis possibility.

Gold Prediction!Current Price: ~$3,326
Trend: Strong bullish breakout of ascending channel
Moving Averages: Price is far above the 50 EMA (white)
Still bullishly distanced from the 200 EMA (orange)
Structure: Clean breakout of rising channel and key horizontal resistance zones
-Strong daily candle closed above trendline resistance → this is a confirmed breakout
-No upper wick rejections or bearish engulfing candles
-Buyers remain in control until signs of exhaustion show
Plan: Only look for a Buy position setup for safer trade.

GOLD'S CRITICAL DECISION ZONE: The $100+ Swing Play of the Week!The Golden Opportunity That Elite Traders Are Watching NOW 💰
The 4-hour Gold chart reveals a masterfully developing technical setup that demands immediate attention. This isn't just another gold analysis—it's the precise roadmap for what could be the most significant price swing of April 2025.
🔍 TECHNICAL PRECISION POINTS:
⚜️ Expanding Channel Perfection
- Gold trapped within pristine ascending channel (purple boundaries)
- Current price ($3,320.925) testing first support zone
- Channel width expanding—signaling increased volatility ahead
⚜️ Two Critical Consolidation Zones
* Historical accumulation zone ($3,220-$3,245) provided springboard for recent rally
* Current decision zone ($3,300-$3,330) serving as near-term battleground
* Both zones perfectly align with channel support tests
⚜️ Predictive Blue Path Analysis
* Forecasting tactical pullback to $3,225 (channel support confluence)
* Subsequent powerful reversal targeting $3,320+ retest of highs
* Final move potentially challenging the $3,357.775 all-time high
The STRATEGIC ADVANTAGE Most Traders Will Miss
This pattern isn't just about direction—it's about precision timing. The blue forecast line reveals a classic "shake-and-bake" pattern that institutional traders use to accumulate before significant moves.
🔱 Why This Week Is Different:
* April 21-27 window represents peak volatility zone
* Volume profile showing 40.31K contracts with diverging price action
* Bullish bias maintained despite -0.47% daily change (distribution, not weakness)
🔱 The $100+ Opportunity:
Traders positioned at channel support could capture the entire $100+ swing from lower support (~$3,225) to upper resistance (~$3,330), representing a potential 3% move—extraordinary for gold's typical volatility profile.
The EXECUTION BLUEPRINT For Maximum Gain 📊
1. Primary Entry Zone:$3,225-$3,235 (channel support confluence)
2. Conservative Stop: Below $3,210 (channel break invalidation)
3. First Target:$3,275 (mid-channel equilibrium)
4. Final Target: $3,320-$3,330 (upper resistance retest)
{ Risk:Reward = 1:3.5 at minimum } 🚀
The Hidden Geopolitical Catalyst
The technical setup coincides perfectly with next week's critical economic data releases and geopolitical tensions—creating the perfect storm for gold's next explosive move. FOLLOW ME 🔥

XAUUSD Market Recap – April 21, 2025 | NY Close Review🟨 XAUUSD Market Recap – April 21, 2025 | NY Close Review
🔹 Price Action:
Gold made another aggressive high into ATH 3430, reaching full premium territory with strong upside momentum through London into NY. But the reaction near 3430 was sharp — indicating potential short-term exhaustion.
🔍 What Worked Today
✅ Liquidity sweep complete – Price ran clean through the previous weak high and liquidity above 3425, grabbing the top before rejecting.
✅ Bullish BOS confirmed – Structure remained bullish on all timeframes, with no valid CHoCH break on H1 or H4.
✅ Sniper bias confirmed – Directional buys played perfectly from lower OBs (especially the ones marked pre-Asia and pre-London).
🔍 What Didn’t Happen
❌ No mitigation of lower H1/H4 FVGs – Zones between 3361 and 3387 remain completely untouched.
❌ The 3305–3315 OB area wasn’t retested – Meaning any breakout traders looking for retests were left hanging.
❌ No real signs of reversal structure – Despite the reaction off ATH, we’ve yet to see a proper CHoCH + BOS sequence on H1 or H4.
⚠️ Unmitigated Key Zones
🟦 H1 FVG – 3361
🟦 H4 FVG – 3285.00–3300.00
🟧 H4 OB block – 3224 (untouched, still a strong magnet if sell momentum kicks in)
These levels remain high interest for any future discount buy setups if price starts pulling back.
📉 What Was Rejected Today
🔼 3430 – New ATH. Price wicked into this level and rejected instantly with visible CHoCH on M15 and M5, leaving a clear bearish reaction.
🔼 M15 OB – The supply zone around 3425–3430 acted as short-term resistance with an intraday bearish sequence into NY close.
🧠 Market Sentiment
🔸 Still bullish on HTF, but intraday shows clear profit-taking behavior.
🔸 Dollar weakness and geopolitical premium still holding gold up — but overextension risk is real above 3425.
📍 Summary
Gold remains in a strong uptrend but may be showing short-term exhaustion after hitting ATH 3430. With unmitigated OBs and FVGs below, any deeper pullback will be liquidity-driven, not structural bearishness… yet.
We'll prep the sniper plan separately soon — stay ready. 🧠⚔️

Analysis and layout of the latest gold market ?Analysis of gold market trend next Monday:
Gold technical analysis: Stimulated by the news, gold prices have continuously refreshed historical highs this year. As of the close of this week, gold prices have reached a high of 3357. There was a slight retracement signal after setting a historical high on Thursday, but the closing price was still above 3320. The weekly line closed with a real body longer than the upper and lower shadows, suggesting that there is a possibility of further upward movement next week. That is to say, while we are optimistic that overbought will trigger selling at the end of the week, there are also investors who continue to be optimistic about the pullback and buy into the market. So Thursday's trend is to dive from the high to 3284 and then rebound to 3327 to close. The closing price reflects that the gold price is still in a state of continued rise in the general trend.
In the short-term trend, Thursday's callback stopped at 3284, and did not reach the previous high conversion support of 3245, which we predicted. Then the support level can be moved up to 3285; as for the upper resistance, we need to pay attention to the suppression of the historical high of 3357. If the news over the weekend, especially the trade conflict and Trump's remarks, continue to stimulate the Fed to cut interest rates, then the probability of gold rising will be greatly increased. So for next week's operation, it is recommended to focus on long positions on pullbacks. As for the entry point, the first one is 3310. This is a step support level for high-level pullbacks and a retracement point during the rebound, so it can be used as an entry point to look bullish. The upper side mainly focuses on the high point suppression of 3357. If it continues to break, the upper side can continue to see the position of 3409. On the whole, it is recommended to focus on pullbacks and short positions on rebounds for the short-term operation of gold next Monday. The upper short-term focus is on the resistance line of 3357-3360, and the lower short-term focus is on the support line of 3285-3310. Friends must keep up with the rhythm.
Reference for gold operation strategy next Monday:
Strategy 1: Short gold rebounds near 3350-3360, target near 3335-3320, and look at the 3310 line after breaking.
Strategy 2: Go long on gold when it pulls back to around 3305-3310, target around 3325-3345, and look at the 3360 line if it breaks.

XAUUSD (Gold) Looks Strong Bullish .Hello Guys Here is My XAUUSD (Gold) Signal Update .
Gold Will Continue Its Bullish Trend Currently Its running at 3425-20 I can expect if its breaks 3452-53 it will Fly to 3480-3485
Gold Can Retrace From Support Area.
Boost And Comments On my ideas And Share your feedback About it.

XAUUSD 15mint ForecatHello guys, I hope you are well here let me tell you that the bearish order block has been touched, it is heading towards gold sale, our target will continue till FVG.

XAUUSD ProjectionUsing my GC strategy I have forecasted the Open and potentially the Sell zone for the week ahead

Gold Trading Strategy, April 21-22✅At present, the continuous strong rise of gold is mainly driven by Trump's tariff policy, and the technical aspect has no substantial reference value in the current market. As long as there is no sign of easing of the tariff issue, it is difficult for gold to have a substantial correction.
✅Driven by market sentiment, it is not advisable to blindly guess the top. Even if there is a rough prediction of the pressure level, it can only be used as a reference, and no one can accurately judge the real high point. Therefore, in trading, it is necessary to flexibly adjust the strategy according to the actual market trend.
✅From a short-term perspective, the gold price has risen three times in a row during the day, and it is not advisable to continue to chase more at the current position. If the market continues to rise, it is necessary to wait for a more ideal retracement opportunity before making a layout. In terms of the hourly chart, you can pay attention to the support of the MA10 and MA20 moving averages as a potential entry point for short-term long orders.
✅It should be emphasized that "too much rise" itself is not a reason for a decline, but the higher the price goes, the more important risk control is. Short-term bullishness is still possible, but defensive awareness must be improved. In terms of medium-term target positions, the next important level may point to $3,500

XAUUSD Gold Bearish Setup for upcoming week.XAUUSD Sell Setup – Short from Resistance at 3350
Gold (XAUUSD) has approached a key resistance level around 3350, where previous price action suggests potential for bearish reversal. With the current momentum showing signs of exhaustion, we’re looking for a short opportunity from this zone.
Trade Idea:
Sell Entry: 3350 (resistance level)
Target 1: 3310 – Minor support / first reaction zone
Target 2: 3290 – Key support area
Target 3: 3250 – Major support & potential full TP zone
Stop Loss: Above recent swing high (suggested: 3360–3370)
Analysis:
Price has formed a potential double top / rejection wicks near 3350, signaling possible downside. A break below 3310 will likely accelerate bearish momentum.
Risk Management:
Use proper lot sizing and move SL to breakeven after TP1 for a safe ride to lower targets.
