XAUUSD needs correction then dropAs Market is on selling pressure
Bearish scanario :
-if market give closing below 3190-3180 then ready for the next Drop towards 3145then 3130.
Bullish scanario :
-if candles remains above( close with body of candle)3190-3200 then owards targets will be 3335 then 3350 target .
Expecting the rise again to 3235 then Drop.
-On WEEKLY AND MONTHLY IM ON BEARISH SIDE TILL $2980!
Read the commentary carefully and understand the Dynamics.
XAUUSD.P trade ideas

Gold------short near 3320, target 3310-3280Gold market analysis:
Gold has started to fluctuate and hover in the short term. There are opportunities for buying and selling in short-term operations. Yesterday, we also arranged 3 buy orders at low levels. Today, we have to consider changing our thinking and sell it at a suppressed position. The reason is that the weekly line is a big tombstone, which means that the weekly line still has room to fall. This week is basically halfway through. The first half of the week is volatile, and the second half of the week will begin to follow the weekly line to decline. The direction of the daily line is currently vague, but the trend of the weekly line is relatively clear. It has risen and fallen sharply. The data did not support the technical decline of gold. Later, we need to pay attention to the impact of holidays on it. Today, friends who are short-term gold can still intercept in the range. If you want to make a big profit, sell at a high position and hold it. I estimate that it will waterfall. The horizontal time is too long, and the time to fall later will be longer.
Look for opportunities to go short near 3320 in the Asian session. The suppression position is 3329. The current support is near 3300. From the perspective of form, this position still has support in the Asian session, but it is not sure whether it can continue to support gold in the European session. The current idea is to predict that if it breaks 3329, it is necessary to adjust the thinking to be bullish. In addition, the daily moving average is also beginning to turn up and suppress, and selling is beginning to move.
Support 3300, pressure 3320 and 3329, the watershed of strength and weakness in the market is 3300.
Fundamental analysis:
Today, we will start to pay attention to the situation of ADP data, and there is also PCE data. Gold in the European and American sessions will definitely move greatly.
Operation suggestions:
Gold------short near 3320, target 3310-3280

XAUUSD Potential Demand zone Long playIdeas on this one? potential long play off the demand zone marked in the chart
A Clear Bearish Structure (READ CAPTION)1. Overall Trend: The chart shows a clear bearish structure for XAU/USD (Gold vs. US Dollar) on the 1-hour timeframe. Price is making lower lows and lower highs, suggesting strong downward momentum.
2. Key Zones:
• Support Area (Blue Zone around 2321): Price is reacting to this level with a potential bounce forming an ‘M’ structure (double bottom). This could indicate a short-term support or potential reversal area.
• Resistance Area (Pink Zone): Marked as a critical zone. The note “IF GOLD BREAKS THIS AREA WE CAN CLOSE OUR BEARISH TRADES” implies this is a key invalidation level for bearish bias.
• Target Point (Below 3190): Indicates a bearish target if price breaks the support and continues downward.
3. Trade Setup:
• It looks like a continuation short trade is being considered with the expectation that price will break the support zone.
• Good risk management is shown with a clear stop-loss area (above the pink zone) and target level.
4. Additional Thoughts:
• Watch how price reacts at the support zone. If it shows bullish momentum or fails to break strongly, the setup might become invalid.
• Confirmation with a bearish candlestick pattern at the support break could add confluence.

XAUUSD NFP spike coming!Hello traders, this is a complete multiple timeframe analysis of this pair. We see could find significant trading opportunities as per analysis upon price action confirmation we may take this trade. Smash the like button if you find value in this analysis and drop a comment if you have any questions or let me know which pair to cover in my next analysis.

Gold and Chart Patterns I’m dropping this XAU/USD M30 insight because my system’s a damn executioner, and you need to see how I hunt the market. This chart is a textbook of bearish patterns—first a bearish three drives showing smart money exhausting buyers with three weakening upward pushes, then a head and shoulders with the neckline break confirming the reversal, and now a bearish shark forming to seal the deal, all playing out within my descending trendlines. Smart money’s been in control from the start, distributing at the peaks, grabbing liquidity, and dumping price to hunt stop-losses below key levels. Supply and demand zones are my edge—supply at the right shoulder of the head and shoulders where sellers stacked orders before the break, demand near the lower trendline where buyers might step in, my target for this bearish move. My checklist operations are a predator’s playbook. I start with harmonic patterns, hunting XABCD structures like the bearish shark I’m seeing now, signaling smart money’s reversal zones. I confirm market structure, looking for breaks of structure to show trend shifts—here, the neckline break confirms bearish continuation. I identify order blocks, those consolidation zones where smart money stacks orders, like the bearish order block at the right shoulder where sellers distributed. Volume profile is key—I check for high volume nodes where price stalls, like the neckline where sellers defended, and low volume nodes that act as magnets, like gaps below the neckline. Top-down analysis keeps me sharp—four-hour timeframe sets the bearish trend, one-hour confirms the break, thirty-minute narrows the setup, fifteen-minute is my strike zone, waiting for a neckline retest. I use Heikin Ashi for confirmation—red candles mean sell, waiting for red on the fifteen-minute at the retest. Fibonacci levels mark my targets—I focus on key extensions to set exits, like targeting the lower trendline of the channel. Gann theory adds confluence—I look for angles or retracements to align with my setups, like a Gann angle pointing to the lower trendline. MACD and RSI measure momentum—MACD’s bearish crossover and negative histogram confirm the downtrend, RSI below fifty with bearish divergence at the right shoulder seals it. Risk management is my law—I risk small to win big, stop-loss above the right shoulder, take-profit at the lower trendline, aiming for a high reward ratio. I monitor news and liquidity traps—fake spikes above the neckline are smart money’s tricks, so I stay sharp. I wait for confirmation—every piece aligns, or I walk, then I document to keep my edge razor-sharp. I’m rating this system a ten out of ten—harmonic patterns, Smart Money Concepts, volume profile, top-down analysis, and now MACD and RSI for momentum make it untouchable. I’ve fine-tuned this over six months, backtesting until it’s a weapon. I need two of you to join me at Academia—let’s hunt together.DYOR
Shieldsmine Diaries

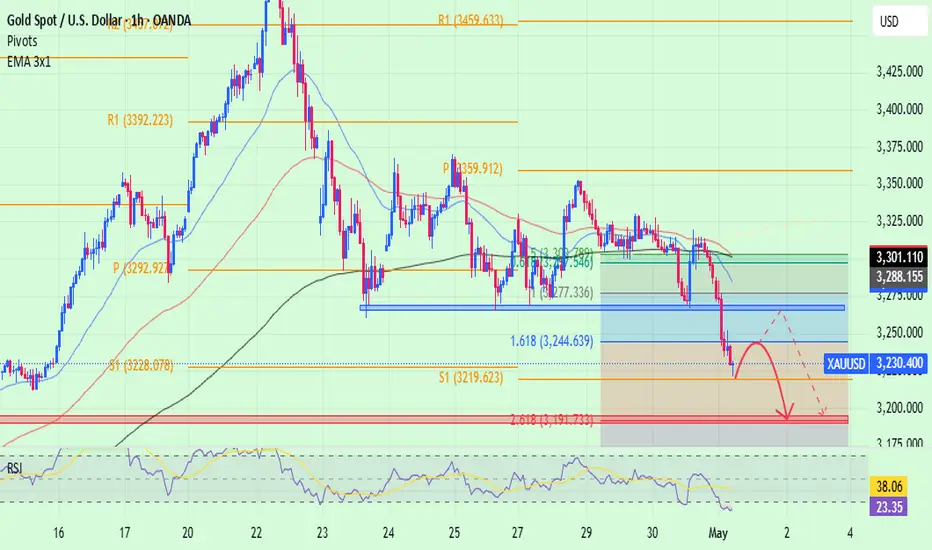
Next Gold Support at $3,226 - Major Breakout Incoming?!🧠 GoldThesis
Gold is coiling into a textbook symmetrical triangle — right on the 0.5 Fib retracement level (~$3,226) from its $3,496 top. Price action is compressing fast, and a major breakout looks imminent within days. The RSI is hovering in the low 30s, signaling that the downside may be reaching exhaustion.
🔍 Technical Breakdown
Pattern: Symmetrical triangle forming, squeezing toward apex (end of April).
Fib Levels:
0.618 = $3,289 (rejection confirmed)
0.5 = $3,226 (current support zone)
0.382 = $3,162 (next support if breakdown confirms)
Volume: Decreasing — classic compression before expansion.
RSI (14): 33 — near oversold territory. Could be setting up a bullish divergence if price sweeps lows.
Volatility: Dangerously quiet... for now.
🟩 Bullish Case
If price holds $3,226 and breaks triangle resistance around ~$3,300, we could see fast movement to retest $3,380 (Fib 0.786) and eventually $3,496 ATH.
RSI reversal + volume surge = likely breakout trigger.
🟥 Bearish Case
Failure to hold $3,226 or $3,162 sends price to $3,083 (Fib 0.236) or lower.
Bear trap possible near ~$3,150 if liquidity is swept.
🚨 My Plan
Waiting for triangle resolution.
Long above $3,300 breakout retest with SL below $3,226.
Short below $3,162 confirmation with tight invalidation.
⚔️ Final Word
The triangle is almost full — this is the calm before the storm. Whether gold rallies back to ATH or dumps to shakeout late longs depends on how this coil resolves. Get ready, the move will be violent.

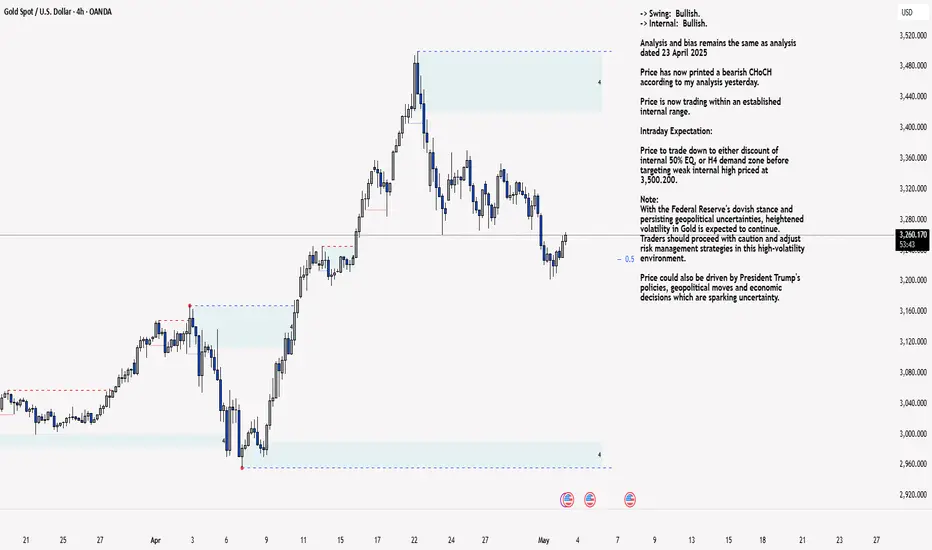
XAU/USD 02 May 2025 Intraday AnalysisH4 Analysis:
-> Swing: Bullish.
-> Internal: Bullish.
Analysis and bias remains the same as analysis dated 23 April 2025
Price has now printed a bearish CHoCH according to my analysis yesterday.
Price is now trading within an established internal range.
Intraday Expectation:
Price to trade down to either discount of internal 50% EQ, or H4 demand zone before targeting weak internal high priced at 3,500.200.
Note:
With the Federal Reserve's dovish stance and persisting geopolitical uncertainties, heightened volatility in Gold is expected to continue. Traders should proceed with caution and adjust risk management strategies in this high-volatility environment.
Price could also be driven by President Trump's policies, geopolitical moves and economic decisions which are sparking uncertainty.
H4 Chart:
M15 Analysis:
-> Swing: Bullish.
-> Internal: Bearish.
As mentioned in yesterday's analysis dated 01 May 2025 whereby I mentioned that I would continue to monitor price and depth of bullish pullback following the printing of a bearish iBOS followed by a bullish CHoCH.
Price did not pullback significantly enough to warrant a further bearish iBOS, therefore, I will apply discretion and not classify this as such, I have however marked in red.
Price has since continued bearish, subsequently printing a bullish CHoCH.
Internal structure is now established, however, I will continue to monitor price regarding depth of pullback as previous.
Intraday Expectation:
Price to trade up to either premium of internal 50% EQ, or M15 supply zone before targeting weak internal low priced at 3,201.955
Note:
With the Federal Reserve maintaining a dovish stance and ongoing geopolitical tensions, volatility in Gold prices is expected to remain elevated. Traders should exercise caution, adjust risk management strategies, and stay prepared for potential price whipsaws in this high-volatility environment.
Trump's tariff announcement will most likely cause considerably increased volatility and whipsaws.
M15 Chart:
How to layout gold before non-agricultural data🗞News side:
1. Progress in Sino-US tariff negotiations: The United States has recently contacted China through multiple channels, releasing signals that a trade agreement may be reached. Market concerns about trade friction have significantly cooled down, weakening the safe-haven appeal of gold.
2. The U.S. non-farm payrolls report for April will be released today (expected to add 130,000 new jobs). If the data is weak, it may strengthen expectations for an interest rate cut. On the contrary, if it is stronger than expected, the interest rate cut schedule may be further delayed.
📈Technical aspects:
Gold bottomed out yesterday and has now rebounded to around 3250. For the current market situation, the previous low of 3260-3270 has become an important resistance level above the gold price after the top-to-bottom conversion. In addition, non-agricultural data will be released in the U.S. market today. Therefore, if gold wants to reverse upward, the first resistance will be in the 3260-3270 range. If the counter pull from the bottom fails to stabilize at 3270, then there will be a downward trend. If it breaks through this resistance range, it may test the 3286 line. Before the release of non-agricultural data, the European market can be shorted when encountering resistance at 3260-3270. Everyone is waiting patiently for the opportunity to enter. The following focuses on the important support of 3200.
If you agree with this point of view, or you have a better idea, please leave a message in the comment area. I look forward to hearing different voices.
change the trendIt is expected that the upward trend will end in the current resistance area and we will see the beginning of an downward trend. Otherwise, the upward trend will continue to the 78.6% level and then a trend change will be expected.

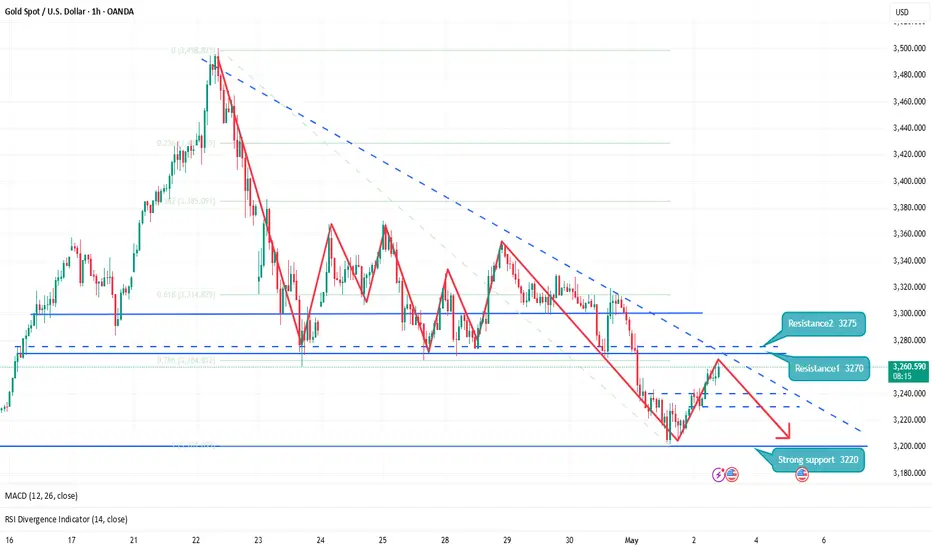
Short-term downtrend has formed 🔔🔔🔔 Gold news:
➡️ The US dollar continues to rebound following recent remarks from President Donald Trump, who stated that he has "potential" trade agreements with India, South Korea, and Japan, and expressed high confidence in reaching a deal with China.
➡️ Meanwhile, gold prices have been declining for the third consecutive day as of early Thursday, nearing a two-week low. Trade-related headlines have once again overshadowed US economic data, significantly impacting the traditional safe-haven appeal of gold.
Personal opinion:
➡️ Negative US fundamentals cannot help gold rise after positive signals from the trade war are still the decisive factor. Gold has broken the 3265 zone and turned into a short-term downtrend.
➡️ Analysis based on important resistance - support and Fibonacci levels combined with RSI to come up with a suitable strategy
Personal plan:
🔆Price Zone Setup:
👉Buy Gold 3191 - 3194
❌SL: 3186 | ✅TP: 3199 - 3205 – 3210
👉Sell Gold 3262 - 3265
❌SL: 3270 | ✅TP: 3257 - 3251 – 3245
FM wishes you a successful trading day 💰💰💰
Gold tests resistance: Will the correction continue?Gold is currently retesting a former support level, which has now turned into a significant resistance zone.
I expect a continuation of the decline. It looks like the commodity market may face a broad-based pullback, partly due to the strengthening DXY.
I don’t see this correction as a trend reversal — rather, it’s a natural move after a strong rally.
So, if you're considering short positions, caution is advised.
I'm expecting the price to move toward the area of 3100-3125.

XAUUSD (LONG)
Day Trade
Had ABC move price has to come back to retest the breakout of consolidation.

XAUUSD: Massive Volatility, Weak Support at 3270!Last week was extremely volatile for Gold, with incredible swings that caught many traders off-guard. After reaching a new all-time high at 3500, the price dropped by more than 2000 pips in less than 24 hours!
After this crash, the market settled somewhat, and towards the end of the week, Gold established a strong ceiling around 3370 – exactly as we discussed in last week's analysis.
The key question now: Is the correction over or is there more downside coming?
At the same time, we can clearly observe a floor around 3270, a level that Gold is testing again at the time of writing.
Here’s why I believe the correction is not over yet:
- Price action remains vulnerable below 3370 resistance.
- The support at 3270 looks fragile, with pressure building for a break.
- Market volatility is still extremely high, favoring continuation moves.
Trading Plan:
I am looking to sell rallies above 3300, aiming for a target around 3200.
Due to the recent wild volatility, I will adjust my stop losses accordingly, allowing enough room for noise without exposing the position to unnecessary risk.
Disclosure: I am part of Trade Nation's Influencer program and receive a monthly fee for using their TradingView charts in my analyses and educational articles.

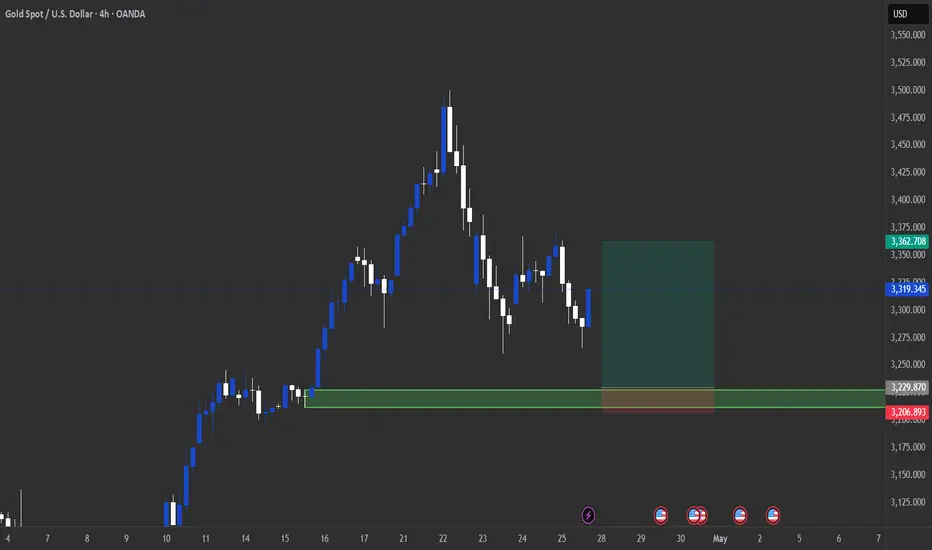
4-hour chart for XAUUSD (Gold Spot vs US Dollar)This is a 4-hour chart for XAUUSD (Gold Spot vs US Dollar) showing a technical analysis setup:
1. Current Price:
Sell: 3,238.70
Buy: 3,239.00
2. Marked Levels:
There's a red shaded area labeled "ENTRY ZONE" between 3,272.81 and 3,273.79.
This zone likely acts as a resistance or pullback area where a sell entry is being considered.
3. Market Structure:
Price previously moved up strongly (bullish), but now it’s forming lower highs and lower lows, indicating a bearish trend.
A projected path is drawn showing that price might go back up into the entry zone and then drop further — with a potential target near 3,009.75.
4. Bias:
The overall bias shown in the chart is bearish.
It suggests a sell opportunity in the entry zone, expecting price to fall after a short-term pullback.
If you want, I can help you build a full trade plan (entry, stop loss, and take profit) based on this chart too. Just let me know!

GOLD Gold (XAU/USD) May 2025 Outlook: Dollar Dynamics and Directional Bias
Optimism about potential tariff reductions and trade agreements has reduced safe-haven demand for gold, pressuring prices to two-week lows near $3,200-3204
A finalized deal could further strengthen the US Dollar (DXY), exacerbating gold’s decline.
US Dollar Strength:
The DXY has rallied on trade relief and mixed Fed rate expectations, making gold more expensive for foreign buyers.
Interest Rate Differential: While futures price in Fed cuts starting June (four total in 2025), the dollar’s near-term resilience limits gold’s upside.
Technical Breakdown:
Gold broke below a multi-week symmetrical triangle, signaling a bearish wave which will be targeting $3,100–$3,000
Immediate resistance sits at $3,3287–$3,2780; a break above this zone is needed to invalidate the bearish structure.this level represent a broken demand floor and calls for retest.
US Jobs Data (May 2): Weak Non-Farm Payrolls (<130K) could revive rate-cut bets, supporting gold. Strong data (>150K) may extend dollar gains.
Fed Policy (May 7 Meeting): No rate changes expected, but hints of June cuts could trigger volatility.
May Directional Bias
Factor Impact on Gold (XAU/USD)
Trade Deal Progress Bearish (dollar strength, risk-on sentiment)
DXY Rally Bearish (inverse correlation reasserted)
Weak US Data Bullish (safe-haven flows, rate-cut speculation)
Geopolitical Shock Bullish (flight to safety)
Gold faces downside pressure in May, targeting $3,100-3000 driven by dollar strength and fading safe-haven demand. A close below $3,200 would confirm the bearish trend.
Upside Risks:
Escalation in Middle East tensions or renewed US-China tariff threats.
Disappointing US economic data (e.g., jobs, CPI) reviving aggressive Fed cut bets
Conclusion
The dollar’s strength and trade optimism dominate gold’s near-term trajectory, favoring a bearish bias in May. However, gold remains a critical hedge against unexpected geopolitical shocks or dovish Fed pivots. Traders should monitor the May 2 NFP report and Fed rhetoric for directional cues.

XAUUSD BUY SETUP ,Bought at $3352XAUUSD BUY SETUP
Currently $3355
Bought at $3352
(Trading plan XAUUSD down up to $3330 we will add more buy)
Expecting target ($3376 0R UP )
Incase of early exist will update this anaylsis
Its not a Financial Advice

How should gold be positioned after the ADP data is released?Although the current ADP data is positive, and the US GDP in the first quarter is sluggish, the risk of US recession has increased, but gold has not risen sharply, and the 1H moving average is still radiating downward. At present, it can only be regarded as a short-term correction to the oversold area. If the upper 3300-3310 does not break, you can go short. Brothers who have made profits now can exit the transaction in time. We are patiently waiting for entry opportunities.
If you agree with this point of view, or you have a better idea, please leave a message in the comment area. I look forward to hearing different voices.
TVC:GOLD FXOPEN:XAUUSD FOREXCOM:XAUUSD FX:XAUUSD OANDA:XAUUSD

Gold 4H – Big vs Little: The Conflict That Created ClarityJust price, structure, and volume — tracked in real time.
🧠 Chart Breakdown:
✅ Trend Reclaim (Early March) — Entered just after price bounced from the 200 EMA. Both systems aligned: Big Brother reversal and Little Brother trend crossover. I trusted the signal and it ran clean.
⛔ False Top (Late March) — Big Brother printed a red arrow under resistance. Little Brother still looked bullish, but I paused. That caution kept me out of the trap.
✅ Re-entry Confirmation (Early April) — Green triangle fired again after a textbook pullback. Bullish volume returned, and Little Brother confirmed. I re-entered long.
⛔ True Top (Mid-April) — Volume faded. Big Brother gave a second red warning. I exited longs here — structure rolled over fast after that.
🚨 Breakdown Confirmed (May 1–2) — The flush sealed it. Both systems aligned bearish. Structure broke. No more guessing — this trend has shifted.
This is how I trade with conviction. Tools don’t replace decisions — they sharpen them.

It's time to short gold
All reluctance to change comes from fear of the unknown. Many times, we can't do something, not because we can't do it, but because we don't dare. If you don't have the courage to face the strange world, don't complain that you can't find opportunities. Let go of the burden in your heart, everyone can be excellent!
Gold, yesterday's US market was directly pulled up by the news, and it started to fall after reaching a high of around 3319. It continued to fall during the day and fell sharply after opening. The current low reached around 3221, and the decline was nearly 100 points. The daily line closed in the form of a medium-yin line, and continued to be suppressed by the short-term moving average.
Today's sharp decline also directly broke through the previous bottom position of around 3265. This position is likely to form a top-bottom conversion pattern in the short term, and the key support below will likely be maintained at the 3200 line. Since this week is a non-agricultural week, the rapid decline in the morning is also beyond our expectations.
Today's retracement and breakout also gave the market new expectations for the shorts. Therefore, the European session needs certain support for the shorts, and the key pressure above is maintained near 3265. This position is also an ideal point for continuing to arrange shorts in the short term. Once it breaks through again, the energy of the shorts may be exhausted in advance. Therefore, our overall thinking during the day is still around the shorts, but we need to wait patiently for it to rebound and continue to arrange. If gold rebounds near 3260-62 during the day, short it, the target is around 3230-10, and the loss is 3271. If the European session continues to fall and break, try to go long near 3190-88 in the US session, and the loss is 3280.
Today's operation: Gold rebounds near 3260-62 during the day and shorts it, the target is around 3230-10, and the loss is 3270.
Thank you for the support of all traders. If you have any suggestions, please let me know

HelenP. I Gold will continue to decline, breaking support levelHi folks today I'm prepared for you Gold analytics. After an extended bullish phase that pushed the price higher within an upward channel, the market has started to show signs of weakness. Initially, gold moved steadily from the lower support zone, climbing through the channel and forming higher highs. Each pullback was supported by the rising trend line, reinforcing the bullish sentiment throughout the move. However, after reaching the peak near 3570, the price sharply reversed, breaking the trend line and shifting the overall structure. Sellers took control, leading to a breakdown below the channel, and now the price is consolidating near the 3260 - 3285 support zone. Recently, Gold tested the trend line from below but failed to reclaim it, which signals strong resistance overhead. Currently, gold is trading around 3319, just above the lower boundary of the broken channel and inside the support zone. I expect a small upward correction, breaking the trend line, and then followed by a continuation of the downward movement. So that's why I set goal is 3200 points. If you like my analytics you may support me with your like/comment ❤️

Gold in Daily viewIn Daily Time Frame Gold is in Uptrend way.
First Support has shown on the chart.
Chart will be updated....

Gold is ready to push againNo comment needed. All information is in the chart analysis.
Steps to follow:
Analyze yourself.
Take the position with SL and Take Profits.
Wait, it may take a couple of days, so take a break and step away from the screen from time to time, just like I do :)
Get the result.
I will update the trade every day.
Like, comment with your good mood or viewpoint, share with your circle. It’s together that we get stronger!
Good trades, Traders!
The golden bear
