GOLD: Long Trading Opportunity
GOLD
- Classic bullish formation
- Our team expects growth
SUGGESTED TRADE:
Swing Trade
Buy GOLD
Entry Level - 3225.9
Sl - 3218.11
Tp - 3240.8
Our Risk - 1%
Start protection of your profits from lower levels
Disclosure: I am part of Trade Nation's Influencer program and receive a monthly fee for using their TradingView charts in my analysis.
❤️ Please, support our work with like & comment! ❤️
XAUUSD.P trade ideas

THE KOG REPORT - UpdateEnd of day update from us here at KOG:
An extremely decent day on Gold with price doing what we wanted in the KOG Report. We tested the low, got the RIP, tested the high, got the RIP and then continued with the move point to point, level to level to completed the path and most of our bearish and bias target levels.
We're now in with runners protected with the immediate resistance level above at the 3220-25 region which will need to hold for price continue with the move downside. Based on a clean rejection, we should continue first into the 3195 level.
KOG’s bias of the week:
Bearish below 3265 with targets below 3220✅, 3210✅. 3197✅, 3190 and below that 3170
Bullish on break of 3265 with targets above 3276, 3280, 3285 and above that 3292
RED BOXES:
Break above 3250 for 3255, 3261, 3269, 3275 and 3290 in extension of the move
Break below 3230 for 3220✅, 3210✅, 3206✅, 3195✅ and 3180 in extension of the move
Please do support us by hitting the like button, leaving a comment, and giving us a follow. We’ve been doing this for a long time now providing traders with in-depth free analysis on Gold, so your likes and comments are very much appreciated.
As always, trade safe.
KOG

Gold has the strength to keep rising At the end of the week gold confirmed the formation of the trading range, support 3286, resistance 3356. I consider the continuation of realization of potential of false breakout of support as a positive scenario. If gold holds above 3313, the market may continue buying, which will lead to a rise to ATH
Scenario: the price is in a local descending channel, but in a global bullish trend. A bounce to 3313 from the channel resistance may occur, followed by a continuation growth to 3342 or to 3356.

GOLD ROUTE MAP UPDATEHey Everyone,
Great start to the week with our chart idea playing out, as analysed.
We started of with our bearish target hit at 3230 followed with ema5 cross and lock below 3230 opening 3201, which was hit perfectly and followed with the weighted bounce of over 40 pips inline with our plans to buy dips.
We will now either look for support above this Goldturn level for a continuation above or a cross and lock below 3201 will open the Goldturn level below.
We will see levels tested side by side until one of the weighted levels break and lock to confirm direction for the next range.
We will keep the above in mind when taking buys from dips. Our updated levels and weighted levels will allow us to track the movement down and then catch bounces up.
We will continue to buy dips using our support levels taking 30 to 40 pips. As stated before each of our level structures give 20 to 40 pip bounces, which is enough for a nice entry and exit. If you back test the levels we shared every week for the past 24 months, you can see how effectively they were used to trade with or against short/mid term swings and trends.
The swing range give bigger bounces then our weighted levels that's the difference between weighted levels and swing ranges.
BULLISH TARGET
3261
EMA5 CROSS AND LOCK ABOVE 3261 WILL OPEN THE FOLLOWING BULLISH TARGET
3292
EMA5 CROSS AND LOCK ABOVE 3292 WILL OPEN THE FOLLOWING BULLISH TARGET
3324
EMA5 CROSS AND LOCK ABOVE 3324 WILL OPEN THE FOLLOWING BULLISH TARGET
3352
BEARISH TARGETS
3230 - DONE
EMA5 CROSS AND LOCK BELOW 3230 WILL OPEN THE FOLLOWING BEARISH TARGET
3201 - DONE
EMA5 CROSS AND LOCK BELOW 3021 WILL OPEN THE RETRACEMENT RANGE
3179
3152
EMA5 CROSS AND LOCK BELOW 3167 WILL OPEN THE SWING RNGE
3120
3094
EMA5 CROSS AND LOCK BELOW 2975 WILL OPEN THE SECONDARY SWING RANGE
SECONDARY SWING RANGE
3069 - 3038
As always, we will keep you all updated with regular updates throughout the week and how we manage the active ideas and setups. Thank you all for your likes, comments and follows, we really appreciate it!
Mr Gold
GoldViewFX

Hellena | GOLD (4H): SHORT to 38.2% Fibo lvl 3143.50.Dear colleagues, I expect a correction in the coming week. Wave “V” has started its development and now I think that wave ‘1’ of medium order is completing its development and I think that the correction in wave “2” will last until the area of 38.2% Fibonacci level 3143.50.
There are two possible ways to enter the position:
1) Market entry
2) Pending limit orders.
Manage your capital correctly and competently! Only enter trades based on reliable patterns!

#XAUUSD: Last Four Analysis Helped US Gain Over 4000+ Pips!Next?Our previous four analysis has yielded a substantial gain of over 4,000 pips. Analysing the current market situation, we anticipate that the price may either experience a significant drop or continue its upward trajectory.
Should a resolution be achieved between the trade tariffs imposed by China and the United States, we anticipate a substantial decline in gold prices. Conversely, if the situation remains unchanged, which is the more probable outcome at present, we will have two potential trading opportunities.
The first entry involves the assumption that the price will remain unchanged and continue its upward trend. The second entry is contingent upon a correction in the price.
We extend our best wishes and express our gratitude for your unwavering support throughout our endeavours. We sincerely hope that this analysis will serve as a valuable guide for your own trading endeavours.
Much Love
Team Setupsfx_

XAUUSD Possible Move 21-04-2025XAU/USD Technical Analysis — April 21, 2025
The Gold shows a bullish trend continuation pattern, with price currently testing a key resistance area. Three key levels have been identified for potential buy entries depending on how price reacts:
🔴 1st Buying Level: $3,396 - Breakout and Retest Zone
Entry Strategy: Buy only if price breaks above this level and successfully retests it.
Condition for Buying: A clear breakout followed by a minor retest confirming support.
Condition for Selling: If price gets rejected at this level and shows weakness on a minor retest, a short position could be considered.
⚫ 2nd Buying Level: Around $3,370
Entry Strategy: Buy if price pulls back to this level and it holds as support.
Note: This is a more conservative buy zone, ideal if the breakout fails and price retraces.
Confirmation Needed: Look for bullish price action like a pin bar or bullish engulfing candle at this level.
⚫ 3rd Buying Level: Around $3,355 (Ideal Entry)
Entry Strategy: This is considered the “perfect” buying level.
Reason: It aligns with previous structure and demand zone.
Best For: Traders looking for a deep pullback with optimal risk-reward potential.
🎯 Bullish Target: $3,425
If price breaks and sustains above the $3,396 level, the next potential upside target is $3,425.
Kindly, follow, comment, and like.

Gold fluctuates at high levels and is under pressure to adjust!Gold's 1-hour moving average has begun to turn gradually, and the bullish force has begun to weaken. It may continue to adjust in the short term. The 1-hour short-term double top structure, the rebound did not continue to set a new high, and the rebound began to fall under the pressure of 3232. The trend of the small-level cycle maintains a slightly stronger trend along the short-term moving average. Pay attention to the short-term adjustment. It is still mainly short-selling on the rebound, and it is still maintained near 3227-30 to participate in short orders. It is expected that gold will continue to adjust in the future, and 3200 is likely to be broken. On the whole, it is recommended to mainly short-sell on the rebound, and to buy on the callback as a supplement. The short-term focus on the upper side is 3230-3232. The short-term focus on the lower side is 3200-3210. Gold operation strategy reference: Strategy 1: Short (buy short) two-tenths of the position in batches near 3227-3230 of gold rebound, stop loss 6 points, target near 3215-3210, break to see 3200 line;

How to grasp the high-level fluctuations of gold?The gold market is still maintaining a strong trend. From the current technical point of view, the daily line closed with a negative line, and the small negative line after three consecutive positive lines is still bullish. If the daily line does not break the new high of 3245, we should pay attention to the possibility of adjustment, and after the daily line closes with a negative line, the top is determined, and there is a possibility of a sharp drop in the future. Therefore, although it is a bullish trend for the time being, we should pay attention to the possibility of adjustment in gold and the changes in the daily line cycle. Reference for gold operation strategy: When gold pulls back to around 3213-3215, go long (buy up) in batches with 20% of the position, stop loss 6 points, target around 3230-3240, and look at the 3250 line if it breaks;

Gold Hits New ATH Again: Is the Bull Run Unstoppable?After printing a new All-Time High on April 17, Gold entered a brief correction that ended on April 18 at 3285. However, the daily candle closed strong at 3327, right before the long Easter weekend.
Fast forward to Monday's ASIA session open, Gold showed no hesitation and pushed into yet another ATH at 3384.
The bullish momentum is so aggressive that it feels like nothing can stop this trend. While I do expect heavy volatility going forward, the core strategy remains clear:
👉 Buy the dips.
Key Level to Watch:
📍 First support zone = 3350
At this level, I will actively look for long entries, targeting a potential new ATH later this week.
Disclosure: I am part of Trade Nation's Influencer program and receive a monthly fee for using their TradingView charts in my analyses and educational articles.

Gold Third Scenario , Depend On Breakout , What`s Your Opinion ?Here is the update for the last idea i post for Gold , if we take a look now we will see that he price moving in sideway and still not touch my support , so do yo uthink the price will go up without retest it ? or should we keep the first analysis ?

Gold XAUUSD Possible Setup 15/04/2025🧠 Technical Analysis:
Trend Structure:
The price was following a short-term ascending channel (bullish structure).
Recently, price broke below the lower trendline, indicating a potential bearish shift.
Support Zones:
First support zone: 3210–3214
This is a minor support and could serve as the first potential bounce area.
Second support zone: 3189–3194
This is a stronger historical demand zone. Stronger bounce expected from here if the price continues falling.
Resistance Zone:
Around 3241–3245, which is the recent high and also aligns with prior resistance.
Price Action:
Bearish engulfing candles and a break below the trendline indicate bearish momentum in the short term.
Current price: ~3219. If selling pressure continues, price might retest 3210 or even 3190.
📉 Trading Signal:
✅ Buy Signal 1 – Aggressive Entry
Entry Zone: 3210–3214
SL: Below 3203
TP1: 3235
TP2: 3245
RR: ~1:2+
✅ Buy Signal 2 – Conservative Entry
Entry Zone: 3189–3194
SL: Below 3182
TP1: 3210
TP2: 3235
RR: ~1:3+
📌 Note: Wait for bullish confirmation (e.g., bullish engulfing or pin bar) near either support zone before entering.
🔄 Summary:
Price broke ascending structure = short-term bearish
Look to buy from 3210–3214 (aggressive) or 3189–3194 (conservative) on bullish confirmation.
Hit follow, like and comment.

Gold Trade Plan 15/04/2025Dear Traders,
i believe wave 3/5 Completed , and we will have some correction to 0.38 Wave 3 approximately ( 3140-3155)
trend Still up , and looking for buy opportunity
If you enjoyed this forecast, please show your support with a like and comment. Your feedback is what drives me to keep creating valuable content."
Regards,
Alireza

Waiting for the gold price to test 3300Waiting for the gold price to test 3300
At present, the gold price has accelerated to a new high of 3300 points.
As shown in the figure.
Through the four-hour cycle, the following conclusions can be drawn:
1: The gold price has completely lost control and is in an accelerated rise stage.
2: The next target is 3400 points.
Since the V-shaped reversal has been formed, we will position 3400 points as the next trend target.
If the target is broken directly, 3400 is a normal rise expectation, and 3300 as the middle area will definitely form a blocking effect.
3: Don't blindly guess the so-called top. This is not a guess. All we can do is follow the trend.
4: Next we have only one strategy, that is, to go long at a low price.
5: We must wait for a new top structure and see an obvious big waterfall market.
Only in this way can we execute the long strategy more safely.
6: Current support level: 3250---3280
So the next step is to wait, wait for the pressure level near 3300 to be fully tested, and wait for the formation of a local top structure.
Whenever a big waterfall appears, it is an opportunity to enter the market.

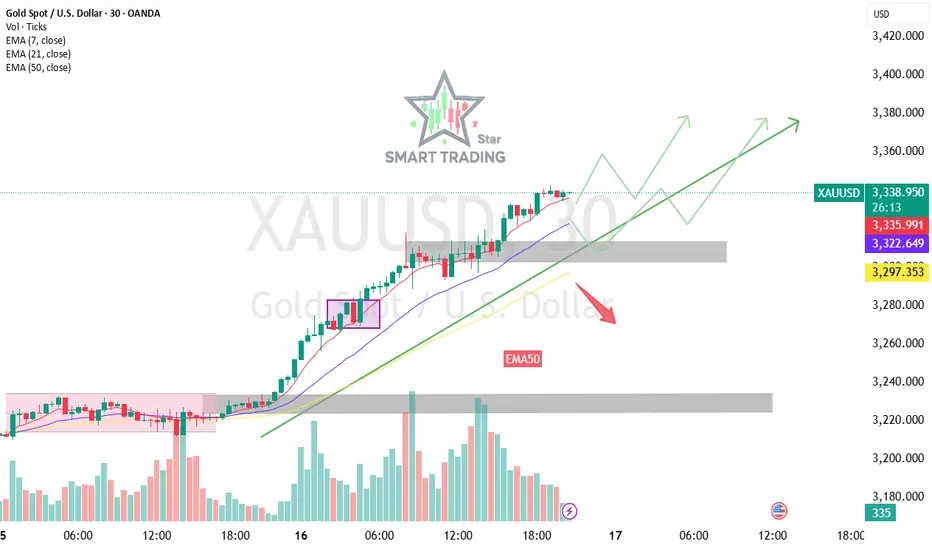
Bullish Momentum Intact (XAUUSD) LongTrend Overview: Bullish Momentum Intact
- **Current Price:** $3,336
- **Trend Direction:** Strong uptrend – higher highs and higher lows
- **Key Moving Averages:**
- EMA 7: $3,334.49 (price above – short-term momentum bullish)
- EMA 21: $3,320.83 (supportive base)
- EMA 50: $3,295.57 (strong trend support)
Bullish Scenario (Green Arrows)
- Price remains above EMAs and the rising trendline.
- Potential pullbacks may test the **support zone** near $3,320–$3,295 (gray area).
- If buyers defend the support, price could aim for **$3,360–$3,380** and beyond.
- Breakouts above local highs can signal continuation of the uptrend.
Bearish Risk (Red Arrow)
- A breakdown below **$3,295 (EMA50)** and the gray support zone could signal a trend shift.
- Downside targets could be **$3,260–$3,240** in case of heavy selling pressure.
- Watch for volume spikes on bearish candles.
Conclusion
As long as price stays above the trendline and 50 EMA, bulls remain in control. Any dips into the gray zone could present **buy-the-dip** opportunities. But a break below $3,295 flips the bias to short-term bearish.
XAUUSD profit analysisGold has been breaking new highs recently. Don't chase the short position blindly. Gold is still strong. Although there is a need for a correction on the technical level, gold has not fallen sharply. It is still mainly long, but don't be blindly long at high levels. It is recommended to wait for a short-term correction before continuing to go long. In the short term, you can pay attention to the 3320-3325 range. You can enter long orders in this area, but you must pay attention to risk management when trading. If there is a loss, you must stop loss in time. Stop loss is also one of the trading techniques. Many people who shorted gold have been trapped or even cleared because they did not set a stop loss account. Don't insist meaninglessly!
I share my market analysis and trading strategies every day. If you are confused about trading, you can take a look. I think it will be helpful to you.

Gold Market Outlook: Key Risks and Opportunities Ahead 📌 Gold Market Outlook: Key Risks and Opportunities Ahead 💰📉
🔍 Current Trend and Short-Term Risk
Gold continues to exhibit strong bullish momentum, although minor corrections remain possible in the short term. A key driver for sustaining the uptrend will be the strength of buyers at support zones like 3196 and 3204.
However, if the market fails to hold above 3135, we could see a deeper retracement. In such a case, a drop toward the 311x region could offer an attractive buying opportunity — particularly if bullish price reactions are confirmed near that level.
🧭 Key Levels to Watch
3135 Support: A break below this zone with strong momentum could signal potential bearish continuation. Any move toward 311x should be closely monitored for a bullish reversal setup.
311x Zone: If price pulls back to this range and we observe reaction or rejection, it could present a high-probability buy opportunity to rejoin the broader uptrend.
🌍 Impact of a Quiet News Week
With no major economic releases on the calendar, market direction will likely be determined by volume flows and price action near key technical zones. Areas such as 3195, 3204, and 3245 will be pivotal in shaping short-term sentiment.
Traders should remain attentive to how price behaves around these levels, especially during London and New York sessions where most volume is concentrated.
🛠️ Tactical Plan for the Week
Asian & European Sessions Focus: Look for momentum plays or reaction signals at key intraday support levels (e.g. 3196). Sharp pullbacks may offer buy setups with solid risk/reward ratios.
Sell Scenarios at Resistance: If price breaks above 3245 with weak follow-through and fails to hold, that could provide an opportunity for tactical short entries — but only with confirmation via volume or rejection patterns.
Stick to Your Plan: Despite the current volatility, it’s critical to adhere to your strategy. Avoid emotional trades, always manage risk, and respect your TP/SL levels.
💡 Conclusion
Gold remains in a strong upward trend with active buyers around key support zones. While short-term pullbacks are expected, they could offer new opportunities to scale in.
Stay patient, trade with discipline, and let the market offer confirmation before committing to a position. Even in a quiet news environment, well-prepared traders can take advantage of high-quality setups by focusing on structure and risk management.

Lingrid | GOLD Weekly ANALYSIS: UNPRECEDENTED Rally ContinuesOANDA:XAUUSD market continues pushing to higher and higher levels. The market went up approximately 7% in a single week. This was a big upward move, if not the biggest upward move in one week this year. As the market approaches the 3250 level, we can see some price deceleration. This may lead to a corrective move. After such an impulse move, the market usually consolidates. Therefore Monday and Tuesday might be sideways move days.
On the daily timeframe, the price is creating an ABC move which potentially completes around the 3300 level. If Monday's candle opens with a gap up, this suggests the price may surge again. However, if we get a pullback, then we can look for buying opportunities below the 3200 support level or the previous day's low.
Traders, if you liked this idea or if you have your own opinion about it, write in the comments. I will be glad 👩💻

#XAUUSD #ForexThis chart shows the price action of Gold Spot against the U.S. Dollar (XAU/USD) on the 1-hour timeframe. Here's a quick breakdown:
- **Price Channel**: The price has been moving within an ascending channel (blue lines), indicating a strong uptrend.
- **Breakout**: The current price ($3,343.10) has broken above the upper boundary of the channel with strong momentum.
- **Bullish Bias**: A bullish
continuation is anticipated, as shown by the large blue arrow pointing upward.
- **Target & Stop-Loss**:
- **Target**: Around $3,401.25 (marked in green).
- **Stop-Loss**: Around $3,302.95 (marked in red).
- **Risk-Reward**: The setup appears to offer a favorable risk-reward ratio for a long position.
Do you want an analysis of potential reversal points or a deeper dive into entry/exit strategies?

Gold continues to surge to new highs!After the sharp rise in gold prices, the trend of the European session is crucial. If the European session maintains a sideways trend with slight fluctuations, then the US session will most likely launch an upward attack again. What needs to be focused on at the moment is the extent of the bulls' pullback repair. In view of the current volatile market, a drop of dozens of dollars may just be a normal adjustment for the bulls, not a trend reversal. The current support below can refer to the afternoon low of 3280, which can also be used as an important reference for operations in the European session. The key watershed below may be at the previous top and bottom conversion level of 3245, while the key pressure above is focused on the 3330-3350 line. On the whole, today's short-term operation strategy for gold recommends that the main pullback is long, supplemented by rebound shorting. The short-term focus on the upper side is the 3330-3350 line of resistance, and the short-term focus on the lower side is the 3275-3280 line of support.

Gold Breaks Out to New Highs: Bullish Momentum Signals Further 1. Price Action
The current price is around $3,303.51, showing a strong uptrend.
There’s been a significant breakout above a previous resistance level, marked with the label “True Breakout”, which appears to have validated the bullish continuation.
2. Chart Patterns
A rounded bottom or cup-like formation is visible in early April, suggesting accumulation and a bullish reversal pattern.
Post breakout, price has moved sharply higher, confirming the strength of buyers.
3. Support & Resistance Zones
Resistance turned support around the $3,269 level—this was previously a consolidation zone and now may act as a floor.
Key resistance zones are shown in red (previous highs): around $3,050.10, $3,019.80, and $2,949.91.
Price has broken far above these levels, indicating strong momentum.
4. Projection
The arrow and zig-zag lines indicate a potential bullish continuation pattern after a brief pullback or consolidation, suggesting another leg up.
5. Indicators
A channel or support/resistance band (possibly a Keltner Channel or Donchian Channel) is visible, confirming breakouts and volatility.
Summary:
This chart signals a bullish trend continuation for gold, backed by a successful breakout, strong price action, and clear support levels. A pullback to the $3,269 area could offer a buying opportunity before further upside, as projected.

Today’s gold operation ideas are back to bullish【Gold Trend Analysis】
Fundamentally, the Trump administration's tariff policy is still uncertain, and market concerns about the trade war support the safe-haven demand for gold; the recent weakness of the US dollar index (close to the 99.0 mark), the decline in US Treasury yields (10-year yields fell to 4.368%), further benefiting gold; Goldman Sachs raised its year-end gold price forecast to $3,700, while UBS is bullish to $3,500, believing that central bank gold purchases and safe-haven demand will continue to support gold prices. Technically, gold opened higher today, rising to 3,233 as high as possible. From the technical indicators, gold is still in a bullish trend, with a 3-hour moving average golden cross. Today, gold fell back to rely on the moving average support. At the same time, the gold price is running above the Bollinger middle track. Pay attention to the middle track support. Today, we are still mainly low-long operations.
【Operational suggestions】
Buy at 3217-20, stop loss at 3207, target at 3230-45.

Gold sell setup Why We Would Sell (Short) XAUUSD in This Setup:
Strong Resistance Zone:
Price is approaching a clear resistance level around 3,250, marked by multiple rejections in the past.
This zone acted as a ceiling for the bulls — each time price reached this level, it got pushed back down, showing strong selling pressure.
Double Top Formation (Potential Reversal Pattern):
The price formed a potential double top near 3,250.
This pattern often signals a shift from bullish to bearish momentum.
Bearish Rejection Wicks:
Candlesticks near the resistance show long upper wicks, indicating that buyers are getting weak and sellers are stepping in.
Lower High Forming:
After the second peak, price failed to make a new high, suggesting buying momentum is weakening.
The current price action is forming a lower high, which is a bearish signal.
Bearish Price Projection (Arrow Path):
The blue arrow suggests a retest of the resistance zone followed by a strong drop down to the support zone at 3,187.
This offers a good risk-to-reward ratio for a short trade setup.
Trade Parameters:
Stop Loss above resistance (around 3,250).
Take Profit around 3,187 (previous support).
This setup offers a clear invalidation point if the price breaks above resistance.
