Hanzo | Gold 15 min bearish Breaks 3442 – Confirm the Next Move🆚 Gold – Hanzo’s Strike Setup
🔥 Timeframe: 15-Minute (15M)
———————
💯 Main Focus: Bearish Breakout at 3442
We are watching this zone closely.
📌 If price breaks with high volume, it confirms Smart Money is in control, and a strong move may follow.
———
🩸 15M Time Frame Analysis
CHoCH & Liquidity Grab
—
CHoCH & Liquidity Grab @ 3440
CHoCH & Liquidity Grab @ 3470
Strong Rejection from 3100 – The Ultimate Pivot
Strong Rejection from 3240 – The Ultimate Pivot
Strong Rejection from 3200 – The Ultimate Pivot
🔥Key Level / Equal Area
—
Key Level / Equal lows Formation - 3195
Key Level / Equal High Formation - 3245
X6 Retest Valid Key level - 3239
X6 Retest Valid Key level - 3212
👌 The Market Has Spoken – Are You Ready to Strike?
Hanzo | Gold 15 min Breaks – Will Confirm the Next Move
🔻 Every warrior needs a tribe.
Follow Hanzo. Support the path.
XAUUSD.P trade ideas

Sorry, I want to buy gold, it's falling.First of all, I never claimed that all my analyses were 100% successful. But you only need to look at the last 20 to 50 of the 2200+ analyses to see that the success rate of these analyses is above 88%, sometimes even up to 95%!
The only exception in yesterday's analysis was that gold failed to continue to fall and failed to break the low of $3187 or lower. Instead, we witnessed the continuation of the bullish trend and set a new high of $3319.
I know many people are burning their accounts because of the surge in gold. Or have already burned. Join me. I will give you free professional advice

GOLD → Countertrend correction. What to do in this case?FX:XAUUSD , after a bull run, bumps into strong limit resistance at 3244 and enters a correction phase, which is generally a logical maneuver amid strong gains.
Gold corrects from Friday's record $3,245 and moves back to $3,200 amid improving market sentiment and progress in trade talks. The price pared gains after a strong weekly rally, reacting to U.S. concessions on tariffs on Chinese electronics and China's pledges to boost economic stimulus. Additional influences come from the dialog between the US and Iran, as well as the anticipation of China's GDP and trade data for March. Despite the pullback, downside may be limited due to ongoing uncertainty.
Technically, it is worth looking at the 3187 - 3167 conglomerate of support, which can stop (temporarily or even turn the price upward) a strong and sharp decline, as the fundamental backdrop within the tariff war is still tense.
Resistance levels: 3244, 3270
Support levels: 3187, 3174, 3167
The rally is temporarily halted, but there is no talk of a trend reversal, as the tariff war fire is still burning, Trump or Xi Jinping may add to the fire....
Within the framework of counter-trend correction, the emphasis is on the support of 3187, 3174, 3167 from which we can trade a false breakdown and catch the price rebound.
Regards R. Linda!

GOLD Took Third Scenario , New Entry Valid To Get 500 Pips !Here is my second place we can buy gold from it after the first entry that gave us more than 700 pips from last analysis please check it to know all scenarios for the next days , now i`m looking to buy gold again after retest the previous high that already broke , and with any bullish P.A , We can enter a new entry with 500 pips target .
This Is An Educational + Analytic Content That Will Teach Why And How To Enter A Trade
Make Sure You Watch The Price Action Closely In Each Analysis As This Is A Very Important Part Of Our Method
Disclaimer : This Analysis Can Change At Anytime Without Notice And It Is Only For The Purpose Of Assisting Traders To Make Independent Investments Decisions.
Best Technical Indicator to Identify Order Block & Imbalance
Your ability to correctly identify Order Blocks on a price chart is essential for profitable trading Smart Money Concept.
In this article, I will show you a great technical indicator that will help you to spot Order Blocks on any financial market.
First, in brief, let me give you my definition of Order Block.
The problem is that in SMC trading there is no one single definition of that and many traders interpret it differently.
To me, an Order Block is a specific zone on a chart from where a strong price movement initiates and where a significant imbalance between supply and demand occurs .
This imbalance should strictly originate from a liquidity zone.
That definition implies that in order to identify an Order Block zone, one should learn to properly identify the imbalance and liquidity zones.
And again, there is no precise definition of an imbalance on a price chart. To me, a bullish imbalance is a formation of a bullish engulfing candle - the one that engulfs a range of previous bearish candle with its body.
Above is the example of a valid Order Block on GBPUSD.
A bearish imbalance is a formation of a bearish engulfing candle - the one that engulfs a range of a previous bullish candle with its body.
Above, you can see the example of an Order Block on USDCAD, based on a bearish imbalance.
There is one technical indicator that will help you to recognize such Order Blocks. It is called " All Candlestick Patterns" on TradingView.
Open settings of the indicator and make it show ONLY Engulfing Candles and choose "No Detection" in "Detect Trends Based on".
After that, hide the indicator and first, Identify the liquidity zones on a chart and wait for a test of one of these zones.
Here is a test of a liquidity zone on NZDUSD on an hourly time frame.
After that, turn on the indicator, and wait for its signal.
You can see that after some time, the price formed a bullish imbalance with a bullish engulfing candle. The indicator highlight that candle.
The Order Block zone will be based on the lowest low of 2 candles and the high of a bearish candle preceding the imbalance.
One more example. We see a test of a significant liquidity zone on EURAUD on a 4H time frame.
We turn on the indicator and look for a signal.
A bearish imbalance is formed and the indicator immediately notifies us.
An Order Block Zone in that case will be the area based on the highest high of 2 candles and the low of a bullish candle preceding the imbalance .
Of course, there will be the rare cases when the indicator will miss the imbalances. But while you are learning to recognize Order Blocks, this indicator will definitely help you a lot!
Thank you for reading!
❤️Please, support my work with like, thank you!❤️
I am part of Trade Nation's Influencer program and receive a monthly fee for using their TradingView charts in my analysis.

Gold Strategy: False Alarm, Bottom BounceOn Thursday, after hitting a record high of $3,357.66, the spot gold price pulled back, and the bulls and bears are engaged in a fierce battle. The pressure of short - term profit - taking is emerging, but the fundamental support still exists, and the key support level will determine the future trend. The intensifying trade tensions between the United States and China have increased the demand for safety, keeping the gold price near its record high, and the upward trend is far from over.
In the short term, gold is likely to start a large - range oscillation again. It has begun a reverse - V trend in one hour. Gold will either start a large - range oscillation or make an adjustment. In the short term, without the support of bullish news, the short - term gold bulls may be under pressure. Since the international gold market is closed tomorrow, there is not much point in participating at present. Overall, for the current short - term operation of gold, it is recommended to focus on selling on rallies and supplement with buying on dips. In the short term, pay close attention to the resistance level of $3,315 - $3,320 above, and the support level of $3,285 - $3,270 below.
Investment itself doesn't carry risks; it's only when investment is out of control that risks arise. When trading, always remember not to act on impulse. I will share trading signals every day. All the signals have been accurate without any mistakes for a whole month. No matter what gains or losses you've had in the past, with my help, you have the hope of achieving a breakthrough in your investment.

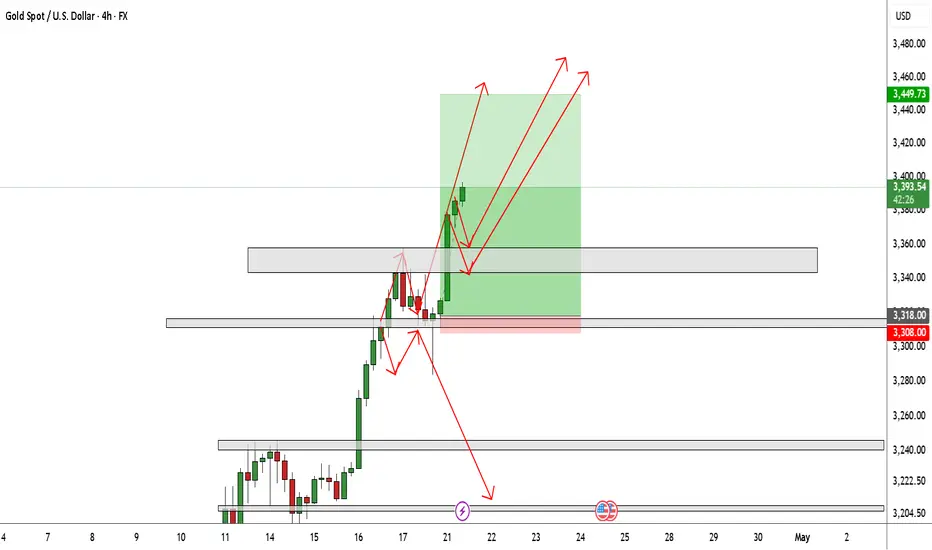
Gold Spot (XAU/USD) 15-Minute Chart Analysis – April 18, 2025This 15-minute chart for Gold Spot against the U.S. Dollar (XAU/USD) shows a bullish ascending trendline forming after a significant prior downtrend. The price is currently consolidating along this trendline, targeting the resistance zone around 3340. The chart suggests two possible movements: a breakout above 3340 resistance or a pullback to retest the trendline before potentially moving higher.
Explanation:
Trend: The chart shows a recent recovery after a sharp drop, marked by a strong ascending black trendline.
Resistance Zone: The grey-shaded area around 3340 acts as a significant resistance where price may face selling pressure.
Projection:
First possibility: A slight retracement to the trendline (support) followed by a bounce upward towards 3340.
Second possibility: If momentum is strong, a direct breakout above the 3340 level.
Indicators:
Red and green cloud-like bands indicate previous bullish and bearish trends (probably a Keltner Channel or Donchian Channel).
The lightning bolt icon hints that a strong move or breakout is expected soon.
This setup suggests traders might be looking for a buying opportunity on a pullback or a breakout above 3340 for continuation higher.

Feeling the Gold Fomo?Feeling the Gold Fomo?
Yes, those on the sidelines are late in this cycle!
Before the longer term "good above this" line fails, you can spot the possible start of the correction with a steeper shorter line.
You can clearly see the last low risk entry was almost 2 years ago.

Weekly Analysis on Gold Its been a strong bullish movement since from the last 2 weeks so for next week trading session i will focus on looking for buying trade opportunities.

4/22 Gold Trading StrategyGold continued its upward movement yesterday. Short positions around 3380 yielded limited gains, while those near 3410 are currently underwater. Many traders may be in a similar position, and I want to emphasize: there’s no need to panic—today offers a strong opportunity for the bears.
Technically, gold is now in the final stage of a five-wave upward structure . The bullish momentum is fading. The remaining upside is likely limited to within $50 , while the downside potential could exceed $80. In short, there’s an 80%+ chance of a pullback or consolidation today, offering a solid exit or profit opportunity for short positions.
The price is expected to retrace below 3360, and once profit-taking begins, the decline may accelerate.
Trading Strategy for Today:
Sell between 3450–3480
Buy between 3330–3310
Trade flexibly within 3440–3400 / 3410–3355

#XAUUSD: $3400 On The Way! Get Ready For Record High! Gold has rebounded to previous highs, maintaining a bullish trend. We expect it to continue this momentum, potentially reaching $3400 in the long term. To set take profit, consider $3250, $3300, and $3400. Use accurate risk management and conduct your own research before trading gold.
Please support us by liking and commenting on this idea.
Team Setupsfx_

The correction appears to prepare for a stronger uptrend.🔔🔔🔔 Gold news:
➡️ Spot gold traded as high as $3,430.36 on Monday, gaining strength as the US Dollar (USD) continued to weaken. Market participants remain increasingly distrustful of the greenback amid ongoing decisions by US President Donald Trump.
➡️ After launching trade wars with nearly all of America's major trading partners, Trump has turned his attention to a new target: Federal Reserve Chair Jerome Powell. Last Thursday, the President voiced frustration over Powell’s slow approach to cutting interest rates and even called for his dismissal, stating that “firing Powell couldn’t come soon enough.”
Personal opinion:
➡️ The current main trend still maintains strong upward momentum for gold.
➡️ However, RSI is showing signs of divergence after entering the overbought zone. Therefore, there will be a phase of decline to gain stronger momentum
➡️ Analysis based on resistance - support levels and Volume profile combined with trend lines to come up with a suitable strategy
Plan:
🔆Price Zone Setup:
👉Buy XAU/USD 3392 - 3394 (Scalping)
❌SL: 3388 | ✅TP: 3398 - 3405- 3412
👉Buy XAU/USD 3360 - 3363
❌SL: 3355| ✅TP: 3370 - 3380 - 3390
👉Sell XAU/USD 3428 - 3430
❌SL: 3435| ✅TP: 3423 – 3418 - 3410
FM wishes you a successful trading day 💰💰💰

XAUUSD 1H FORRCASTHello guys happy weekend here weekly outlook let me tell you that the price is currently in a downtrend. Our trade line is in the downtrend. Our start will be from there. Our target will be our bullish order .

XAUUSD NEXT MOVE POSSIBLE XAUUSD NEXT MOVE POSSIBLE
according to H1 analysis market continuously in buying pressure now market will be falling and touch support level so we have to great opportunity to go long from support level be careful use money management TRADE AT YOUR OWN RISK
REGARD ALBERT

XAUUSD - 15m Sell SetupXAUUSD - Daily Sell Setup 🔻
After a strong and extended rally, Gold (XAUUSD) has reached an overheated level and is now showing signs of short-term exhaustion.
We’re eyeing a $30 correction, which translates to nearly 300 pips of opportunity for short sellers.
📉 Current Price: ~$3,307
🎯 Target: ~$3,277
With momentum slowing and candles printing hesitation, this could be a great time to catch a quick pullback. Ideal for short-term traders who thrive in volatility.
💡 Manage your risk, don’t chase — wait for confirmation before entry.
💸 Ready for 300 pips? Follow us and ride the wave with precision! 🚀

Gold consolidates ahead of the run Consolidation not because the market is exhausted, but consolidation before Wednesday - a rather rich news day.
A triangle is forming locally, but it doesn't mean anything, the more important figure is flat 3193.46 - 3245.40.
Most likely, in order to accumulate liquidity, gold will make a correction to the support in the Asian session and only then will consider the growth.
Scenario: Gold is in consolidation (boundaries are indicated on the chart). We have neither support nor resistance tested. I am waiting for a false breakdown of 3193 before rising. (or a false breakdown of 3167 (retest and confirmation of the strong zone) before the rise)

GOLD Bullish Bias! Buy!
Hello,Traders!
GOLD is trading in a strong
Uptrend and the price is
Making a local bearish correction
So after it retests the horizontal
Support level below around 3344$
We will be expecting a rebound
And a further bullish move up
Buy!
Comment and subscribe to help us grow!
Check out other forecasts below too!
Disclosure: I am part of Trade Nation's Influencer program and receive a monthly fee for using their TradingView charts in my analysis.

XAU/USD... 4H CHART PETTERN..IM looking at a XAU/USD (gold) trade setup with the following parameters:
Sell Entry: 3300
Resistance (Stop Loss): 3340
Target (Take Profit): 3205
Here’s a quick breakdown of the risk-reward ratio and setup summary:
Trade Summary
Sell Entry: 3300
Stop Loss: 3340 (40 pips risk)
Take Profit: 3205 (95 pips reward)
Risk-Reward Ratio:
95 / 40 = 2.38:1 — which is a solid R:R ratio.
If you're already in the trade or planning to enter, it's a good setup technically — assuming price has shown rejection near 3300 and the trend or momentum supports downside.
Want a chart analysis or to set alerts for key price levels?

Gold is Powering Through the Termination ChannelGold is right now in a very strong extended 5th wave.
It has finished what I believe to be the third wave of that 5th wave, so now we are entering the 4th wave of the 5th wave.
I believe it will be a very shallow 4th wave, and considering the speed of things, it will not retrace further than around the 3,000 level. and here on after continue up with the 5th wave.
Normally we would anticipate retracement back to the 38.6% fib level, which is at the 2,766 level, but gold is storming and not looking back right now.
When Gold has retraced a little, I would not be surprised if it is heading for the 4,000 level.

ANALYSE GOLD SHORT POSSITIONscalping possition now on gold short posiition
like and follow our profile for more analyse crypto forex stocks future for free

"Gold Demand Zone Bounce – High R:R Long Setup!"📈 This is a bullish setup using a demand zone bounce strategy on the 15-minute timeframe.
Key Zones & Levels
🔵 Demand Zone:
The blue box is where price previously bounced strongly.
Buyers are likely to step in again here.
✳️ Entry Point:
3,292.38
Just above the demand zone – a safe place to catch the next bounce.
⛔ Stop Loss:
3,280.93
Below the demand zone to protect against a breakdown.
🎯 Target Point:
3,345.09
Near a previous resistance area.
Potential gain: +51.94 pts / 1.58%
Indicators
🟡 EMA (7):
Current value: 3,303.63
Price hovering around EMA = consolidation or setup for a bounce.
Risk-Reward Calculation
⚠️ Risk: 11.45 points
✅ Reward: 52.71 points
⭐ Risk-Reward Ratio: ~4.6:1
Very favorable!
Price Action Summary
📊 Strong uptrend into demand zone
🔁 Minor pullback = potential setup
✅ Ideal entry after bullish confirmation (e.g., bullish candle pattern)
Conclusion
This setup looks solid:
✅ Clear demand zone support
✅ High R:R ratio
✅ Clean target above
Just wait for a bullish signal inside the zone and ride it up!

Gold All time high looking Bullish target 3405$? Gold Spot / U.S. Dollar (XAU/USD)
Timeframe: 15 minutes
Current Price: 3,394.00 USD
Trend: Clearly bullish (price is in an upward channel, marked by blue shaded zones).
Key Observations:
1. Uptrend Channel:
Price is moving inside an ascending channel (parallel blue regions).
Higher highs and higher lows are being formed.
2. Trendline Support:
A black upward trendline is drawn, and price action has been respecting it well.
3. Resistance Zone:
A red resistance zone is marked just above 3,400 USD.
This is where sellers may step in, making it a critical decision area.
4. Projection/Plan:
The black arrows show two possible paths:

Growth potential up to 3400Description of the weekly analysis:
After a good week of trading, we move on to next week.Given the bullish market sentiment, it is not unreasonable to expect the price to rise to 3,400.
I expect the price to be ready to rise to 3400 after a correction towards 3293 or eventually the 3230-3246 support zone.
Note and reminder:
Of course, this analysis is valid as long as the price does not close below 3200.
If the analysis fails, it will be updated immediately and I will share it.
Possible positions this week:
A:Suitable prices for BUY positions
1)3300~3290
2)3230~3246
B:Suitable prices for SELL positions
1)3398~3408
This is just an analysis and everyone is responsible for their own work.
Hoping for a good and profitable week.
