Gold New Week Trade PlanMy New Week Analysis Don't Miss this Gold Opportunity In Gold Market It will be Open Soon And This is My advance Analysis Trade Type Buy Gold and Support Area at 3270 Still Gold Can go some dow at 3315/3310 But Gold Still Bullish and Buyers are Too Powerful it can cross to 3325/3330/3340/3350/3360
XAUUSD.P trade ideas

Gold and Chart Patterns I’m dropping this XAU/USD M30 insight because my system’s a damn executioner, and you need to see how I hunt the market. This chart is a textbook of bearish patterns—first a bearish three drives showing smart money exhausting buyers with three weakening upward pushes, then a head and shoulders with the neckline break confirming the reversal, and now a bearish shark forming to seal the deal, all playing out within my descending trendlines. Smart money’s been in control from the start, distributing at the peaks, grabbing liquidity, and dumping price to hunt stop-losses below key levels. Supply and demand zones are my edge—supply at the right shoulder of the head and shoulders where sellers stacked orders before the break, demand near the lower trendline where buyers might step in, my target for this bearish move. My checklist operations are a predator’s playbook. I start with harmonic patterns, hunting XABCD structures like the bearish shark I’m seeing now, signaling smart money’s reversal zones. I confirm market structure, looking for breaks of structure to show trend shifts—here, the neckline break confirms bearish continuation. I identify order blocks, those consolidation zones where smart money stacks orders, like the bearish order block at the right shoulder where sellers distributed. Volume profile is key—I check for high volume nodes where price stalls, like the neckline where sellers defended, and low volume nodes that act as magnets, like gaps below the neckline. Top-down analysis keeps me sharp—four-hour timeframe sets the bearish trend, one-hour confirms the break, thirty-minute narrows the setup, fifteen-minute is my strike zone, waiting for a neckline retest. I use Heikin Ashi for confirmation—red candles mean sell, waiting for red on the fifteen-minute at the retest. Fibonacci levels mark my targets—I focus on key extensions to set exits, like targeting the lower trendline of the channel. Gann theory adds confluence—I look for angles or retracements to align with my setups, like a Gann angle pointing to the lower trendline. MACD and RSI measure momentum—MACD’s bearish crossover and negative histogram confirm the downtrend, RSI below fifty with bearish divergence at the right shoulder seals it. Risk management is my law—I risk small to win big, stop-loss above the right shoulder, take-profit at the lower trendline, aiming for a high reward ratio. I monitor news and liquidity traps—fake spikes above the neckline are smart money’s tricks, so I stay sharp. I wait for confirmation—every piece aligns, or I walk, then I document to keep my edge razor-sharp. I’m rating this system a ten out of ten—harmonic patterns, Smart Money Concepts, volume profile, top-down analysis, and now MACD and RSI for momentum make it untouchable. I’ve fine-tuned this over six months, backtesting until it’s a weapon. I need two of you to join me at Academia—let’s hunt together.DYOR
Shieldsmine Diaries


How to break through the heavy pressure from above?From the analysis of the 4-hour line, today's support is around 3300-3310. If it falls back during the day, you can buy more once before rebounding. The upper short-term resistance is around 3340-3356, and the focus is on the suppression of 3380-90. The overall support is to maintain a wide range of long and short fluctuations in this range. In the middle position, watch more and move less, and follow orders cautiously, and wait patiently for key points to enter the market.
Gold operation strategy:
Gold rebounds at 3340 and goes short, rebounds at 3360 and covers short positions, stops at 3367, targets 3300-3310, and continues to hold if the position is broken;

Shieldsmine Vlog Alright, mate, let’s break down this EUR/USD H4 setup across these platforms—TradingView and MetaTrader—like we’re sittin’ at the desk, charts up, coffee in hand. We’ve got a solid uptrend from early April, but the pair’s hittin’ a wall around that 1.14200–1.14290 zone as of April 16-18, 2025. Let’s dive in.
Price action’s been clean on both charts. We’ve rallied hard from 1.09480 on April 4, smashed through resistance levels like a hot knife through butter, and now we’re at 1.14039 on TradingView with a tight 0.03 pip spread—sell at 1.14039, buy at 1.14172. MetaTrader’s showin’ a similar story, sell at 1.14039, buy at 1.14204. That 1.14200 area’s a proper battleground—price peaked at 1.14216 on TradingView and 1.14204 on MetaTrader, but the bulls couldn’t hold it. Now we’re consolidating with those tight, choppy candles. Classic indecision.
Lookin’ at the levels, that 1.14290 on TradingView and 1.14204 on MetaTrader is the key resistance to watch. MetaTrader’s got some extra juice with those 30-minute order blocks marked—there’s a supply zone right at that 1.14204 high, where sellers are likely steppin’ in, and a demand zone down at 1.13800–1.13900 where buyers might pile in if we drop. They’re also flaggin’ a 65% probability on a move—could be a breakout or a reversal, but the market’s coiled up tight for somethin’ big.
Trend-wise, we’re still bullish overall, but this consolidation’s got me on edge. If we break above 1.14290, I’m lookin’ at 1.14660 as the next target—plenty of room to run. But if we get rejected here, I wouldn’t be surprised to see a pullback to that 1.13800 demand zone, maybe even 1.13550 if things get ugly. MetaTrader’s showin’ a small open position on EUR/USD, up 0.175 pips—nice little profit, but it’s a tiny lot size, so not much conviction there yet.
Bottom line: we’re at a proper inflection point. I’d be watchin’ for a clean break above 1.14290 with volume to confirm the bulls are back in control, or a hard rejection with a bearish candle to signal a drop. Either way, keep your stops tight—this market’s about to make a move, and I don’t wanna be caught on the wrong side of it. What’s your next play?

Gold market trend analysisTechnically, the gold 1-hour moving average dead cross pattern has not been reversed, and the bearish momentum has not been exhausted; but the 4-hour KDJ indicator has shown signs of oversold repair, which may trigger a technical rebound. The upper resistance is currently at 3365-3370, and the lower support is at 3306-3300. In terms of operation, it is recommended to rebound high and go long as the main, and pullback as the auxiliary.

Gold Trades I'm Taking Today 2
Last week was a success. This week, this is my vibe (don't take my trades without proper research) I'm still going for buys at least till a much stronger resistance. Gold has been breaking levels and i don't think she's stopping anytime soon.
In situations like this, we BUY!!!!..
Let me know what you think.


Gold price has stopped falling, can we buy higher?The short-term 4-hour middle track 3380 has been lost and has become a key counter-pressure point. As long as it does not stand above it again, it will maintain a downward correction. After breaking 3292 below, it will be the 66-day moving average of 3260. The 1-hour K-line is under pressure, After last night's consolidation and pull-up,plus MACD has a golden cross below the zero axis. This wave of $200 rapid decline has almost corrected most of it. If it continues downward for another wave, or with the help of bottom divergence, it will slowly brew a short-term bottom; today's gold rebound focuses on the resistance below 3340, below the extreme middle track 3356, it is still bearish if it cannot withstand the pressure, and it will start to consider bottom-fishing if the strong support 3260 or 3245 is stable;

Growth potential up to 3400Description of the weekly analysis:
After a good week of trading, we move on to next week.Given the bullish market sentiment, it is not unreasonable to expect the price to rise to 3,400.
I expect the price to be ready to rise to 3400 after a correction towards 3293 or eventually the 3230-3246 support zone.
Note and reminder:
Of course, this analysis is valid as long as the price does not close below 3200.
If the analysis fails, it will be updated immediately and I will share it.
Possible positions this week:
A:Suitable prices for BUY positions
1)3300~3290
2)3230~3246
B:Suitable prices for SELL positions
1)3398~3408
This is just an analysis and everyone is responsible for their own work.
Hoping for a good and profitable week.

XAUUSD is in buy zone!After a short break on daily timeframe XAUUSD managed to breakout in the major direction of the trend with strong momentum with multiple liquidity grab from the support level. 5min shows a break of structure and drop to 3254.00 followed by strong rejection to the upside showing a high probability of trend continuation to the upside.
Is the price reaching to 3300?

GOLD Next Movement Very Clear , Are You Ready To Got This ?Here is my new place if i will sell gold after daily closure below 3400.00 m it will be a great chance to sell it with the retest if we have a good daily closure , gold gave me today more than 1000 pips if you checked my last updates , just wait for closure and then we can sell it again .

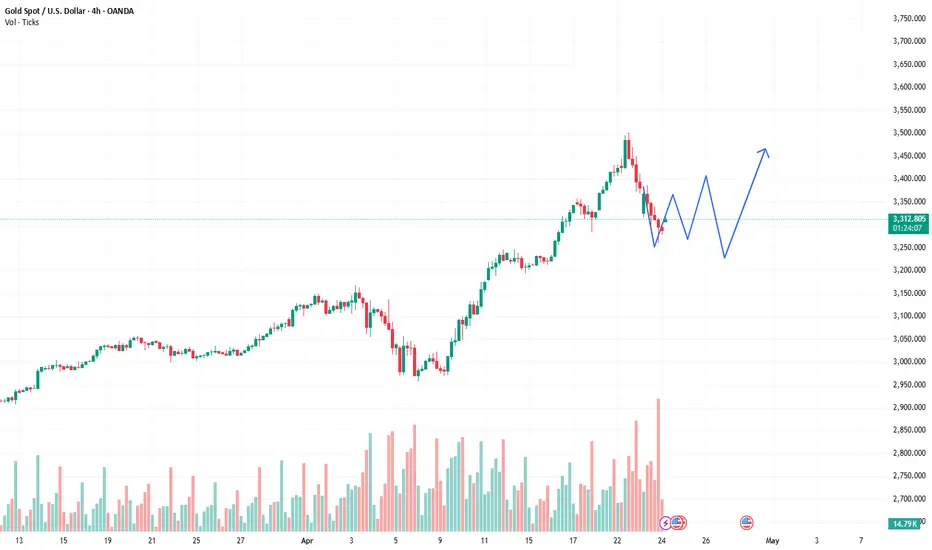
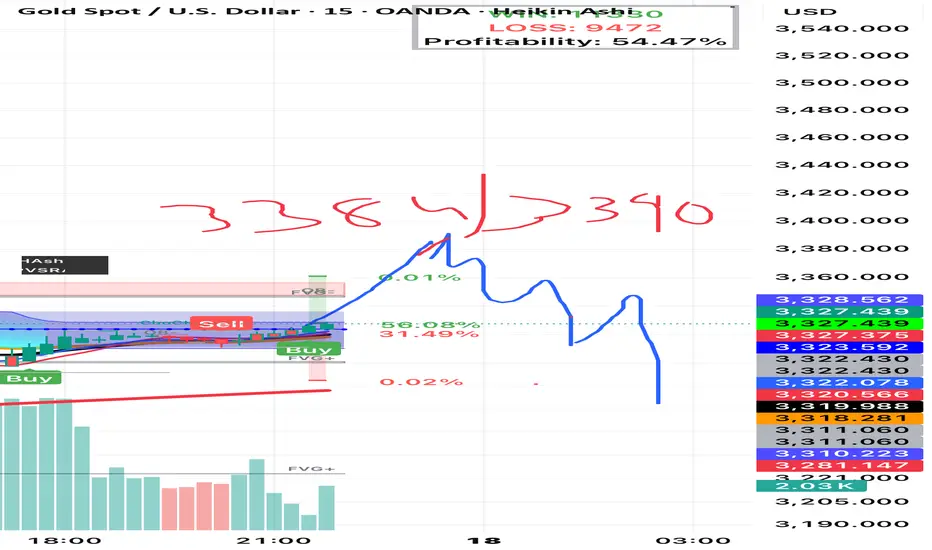
Long & then short at top Wick of Cleaning 3384/33901st long next week upto 3384/3390 then short
We already formed trend reversal on 4 hour time frames this will be last wick to tick tick account stop loss hunt 3384/3390 area then it will drop continuously upto 3016 1st support area will be buying again zone because it suppose to bounce from this 3016 to go back up

GOLD Moving Perfectly , The Same Res Can Give Extra 500 Pips !Here is the gold chart and the price follow my analysis 100% and moving very good, the new entry +200 pips now , and the same entry point valid for re enter again tomorrow , if the price go back to retest the same place around 3400.00 it will be a good chance to re sell and targeting 500 pips .

DeGRAM | GOLD Slows Under Resistance📊 Technical Analysis
GOLD failed to break out above the resistance line near $3 400 and is retreating from overbought levels; low volatility signals weakening momentum and a likely pullback toward support around $3 325.
💡 Fundamental Analysis
Short-term macro drivers also tilt bearish. Rising U.S. Treasury yields are making gold less attractive, while hawkish Fed signals fueled by strong U.S. data have strengthened the dollar.
✨ Summary
Technical and fundamental factors point to a short-term bearish correction in XAUUSD.
-------------------
Share your opinion in the comments and support the idea with a like. Thanks for your support!

Gold's Glory Fades: Bearish Setup in MotionHello,
🟥 XAUUSD – Pro Bearish Playbook
Resistance Breached, But the Rally Looks Exhausted
Gold (XAUUSD) has just smashed through the 1M strong resistance at 3272.314, but let’s not kid ourselves — this move is running on fumes. The rally is heavily overbought, and macro sentiment is shifting fast.
🗞 Macro Trigger: Tariff War Cooling
President Trump has thrown a curveball, suggesting the U.S. may hold off on further tariff hikes, citing concerns about the impact on American consumers.
“At a certain point, people aren’t gonna buy,” he said.
He’s not ruling out new tariffs entirely, but the tone has clearly softened. Even China is stepping back, opting not to match U.S. hikes — and now the TikTok deal is on pause until trade talks settle. This reduces geopolitical risk, and that’s a red flag for gold bulls.
📉 Why We're Bearish:
Overbought Conditions: Gold is bloated. RSI, momentum, and fundamentals all scream “top-heavy.”
Safe-Haven Demand Shrinking: With tariffs cooling and equities catching a bid, gold demand is set to fade.
False Breakout Potential: The push above 3272.314 may be a trap if we don’t get follow-through.
🧭 Bearish Strategy – The Breakdown Plan
We’re not just throwing darts — here’s how we map the fall:
🔻 Level 💰 Price 📌 Role
🟧 1D Pivot Point Use live data Key trigger – watch for bearish confirmation below here.
🟨 1M Resistance (Now Suspect Support) 3272.314 Already breached; likely won’t hold on retest.
🟥 1W Pivot Point 3146.658 Next major target if momentum continues.
🚨 Bear Max Target 2466.313 Full breakdown scenario if risk-off vanishes.
🔥 Execution Plan – What to Do
✅ Wait for confirmation below 1D Pivot.
🔻 Short the rejection at 3272.314 if it acts as resistance on retest.
🎯 Target 3146.658, then trail stops toward 2466.313 on continued weakness.
🚫 Avoid blind entries – confirmation only. This isn’t guesswork.
We’re not chasing gold higher at these levels. We’re waiting for the turn, and when it confirms — we strike.
The Support and Resistance outlined in green and red are the respective support/resistance for this pair currently for 1M-1Y timeframes!
No Nonsense. Just Really Good Market Insights. Leave a Boost
TradeWithTheTrend3344

4/23 Gold Trading StrategyGold saw a sharp decline from 3500 to around 3360 yesterday, and our selling strategy delivered significant returns.
Over the weekend, Trump stated he has no intention to fire Powell and hinted at easing trade tensions. This quickly dampened market risk aversion, causing gold to plunge at the open today to near 3320. The downward momentum remains strong.
In this kind of market, flexibility is key. A sharp drop is usually followed by a rebound, but the strength of that rebound is what matters. Technically, the potential bounce is estimated at around $50, but whether the price continues to rise or resumes its decline will depend on how the market digests the news.
Technical levels (excluding news impact):
Key resistance: 3410–3440
Key support: 3328–3303
Considering the news:
Key resistance: 3346-3372
Key support: 3298–3268
Trading Strategy for Today:
Sell between 3410–3440
Buy between 3297–3267
Trade flexibly within 3386–3332 / 3296–3328

Gold’s Next Trap? Don't Blink“Gold’s Next Trap? Don't Blink. 👀💣”
📅 Daily XAUUSD Sniper Plan – April 25, 2025
Clean structure. No noise. Just logic.
🧭 MARKET CONTEXT
• Macro: No major USD catalyst. Yesterday's Unemployment Claims were neutral → price action driven by structure & liquidity.
• Sentiment: Gold remains in premium territory but failed to hold above 3355 in NY → suggesting smart money profit-taking.
• HTF Bias: Bullish (D1 trend intact, HLs hold)
• LTF Flow: Bearish intraday – CHoCH & BOS on M30-H1
• Key Event Backdrop: Powell not speaking today, but market still reflects uncertainty from recent Trump vs. Powell tensions.
📐 STRUCTURE & SMC FLOW
• M30–H1: Internal CHoCH formed after price failed to break above 3355
• Liquidity: Sweeps above 3353 and below 3312 → now hovering around internal equilibrium
• SMC Confluence: OBs, FVGs, and EMA alignment used for all entries
• FIB Zones: Discount for buys (3280–3310), Premium for sells (3385+)
🔻 SELL SCENARIOS
Sell #1 – 3385–3392
🧨 Premium retest zone + H1 OB + Gap mitigation
• SL: 3401
• TP1: 3355
• TP2: 3333
• TP3: 3306
🎯 Confluence: H1 OB, NY liquidity above, internal CHoCH
Sell #2 – 3411–3422
💣 Extended premium fill – final imbalance trap
• SL: 3432
• TP1: 3372
• TP2: 3333
• TP3: 3306
🎯 Confluence: Unmitigated FVG + fib extension 1.272 + clean wick rejection zone
🟢 BUY SCENARIOS
Buy #1 – 3333–3338
🔋 HTF OB + H4 structure demand
• SL: 3322
• TP1: 3360
• TP2: 3385
• TP3: 3410
🎯 Confluence: HTF FVG, historical bounce zone, EMA100 support
Buy #2 – 3284–3288
🧱 Sniper reentry zone from structure base
• SL: 3270
• TP1: 3312
• TP2: 3340
• TP3: 3372
🎯 Confluence: Previous sniper entry, structure HL, strong OB zone
📊 TREND RECAP
• HTF Trend: Bullish
• LTF Structure: Currently in retracement mode
• Bias: Neutral to bearish for early London, bullish only on clean 3333 reaction or deeper dip to 3284
🫂 COMMUNITY CALL
"Gold’s Next Trap? Don't Blink. 👀💣"
Will 3450 Hold? Or is Gold Just Getting Started? 🔄🧠
Which setup are you watching tomorrow? Let’s catch these sniper entries together – drop your bias in the comments 💬👇
TradingView's been too quiet lately – if this helped, hit that ❤️ and show some love.
Let’s grow this smart gold tribe together!
Smart plans, no hype. If you’re riding gold with logic, drop a 💡 below and let's connect!

Gold could give a new bull run Gold is making a counter-trend correction in the early European session, most likely to confirm support or reach liquidity areas.
A false break of support is a good signal for the continuation of growth
Strategy: The correction is forming against the main bullish trend. The only correct decision is to look for support with the purpose of buying.
False breakdown of 3320 or 3313 may resume further growth to a new high.

Gold - Just Half Way To The Target!Gold ( TVC:GOLD ) still has a lot more upside potential:
Click chart above to see the detailed analysis👆🏻
Over the past couple of months, we saw an almost incredible breakout rally of about +75% on Gold. However, looking at technicals, there is a quite high chance that Gold will actually rally even more and retest the next upper resistance trendline, which would mean another pump of about +75%.
Levels to watch: $4.000
Keep your long term vision,
Philip (BasicTrading)

#XAUUSD:From Our Last Analysis 534+ Pips What Next?We published our analysis on gold on April 24th, highlighting the bullish market presence. The price indeed reversed from our zone, enabling us to make a significant move of over 234 pips. We anticipate a continuous price increase from our entry zone, potentially reaching 3500$. There are several reasons behind this belief. Firstly, the escalating war-like tension between India and Pakistan could lead to a surge in gold prices, potentially surpassing the previous high. Secondly, the heightened tensions among global investors are expected to result in an extreme bullish movement in gold prices.
Given the volatility of gold, we recommend trading cautiously and taking extra precautions while trading gold.
Wishing you good luck and safe trading!
Thank you for your support! 😊
If you’d like to contribute, here are a few ways you can help us:
- Like our ideas
- Comment on our ideas
- Share our ideas
Team Setupsfx_
❤️🚀

XAUUSD Gold Is Surging: Technical / Macro Analysis & Trade IdeaHey traders! Let’s break down the current price action on Gold (XAUUSD) using both Wyckoff and ICT concepts, and tie it all together with the latest macroeconomic context. 🚀✨
Wyckoff Methodology:
Looking at the 4H chart, we see a classic accumulation phase that transitioned into a strong markup. The recent price action shows a clear spring (liquidity sweep) below previous lows, followed by a sharp bullish move—this is textbook Wyckoff manipulation, where smart money grabs liquidity before driving price higher. The current rally suggests we’re in the markup phase, with demand overwhelming supply.
ICT Concepts:
Liquidity Zones: The chart shows a sweep of liquidity below the recent consolidation, trapping late sellers before a powerful bullish displacement. This is a classic ICT move—liquidity engineered and then swept.
Displacement: The large bullish candle breaking above the previous range signals a market structure shift (MSS) to the upside. This is a strong sign of bullish intent.
Fair Value Gaps (FVG): The impulsive move up has likely left a fair value gap (imbalance) between 3335 and 3385.50. Price may retrace to fill this gap before continuing higher.
Market Structure: The break above the previous swing high confirms a bullish market structure. As long as price holds above the 3335-3340 zone (50% retracement), the bullish bias remains intact.
Technical Trade Setups:
Bullish Scenario: Look for a retracement into the 50-61.8% Fibonacci zone (3335-3323) for potential long entries. If price forms a bullish rejection or bullish engulfing pattern here, it could be a high-probability setup targeting the recent high (3385.50) and the next extension at 3436.
Bearish Scenario: If price fails to hold above 3335 and closes below 3320, we could see a deeper retracement toward 3284 (100% retracement) or even lower, but this is less likely given the current momentum.
Market Sentiment:
Bullish 🟢 – The strong displacement, liquidity sweep, and market structure shift all point to bullish sentiment. Buyers are in control, and any pullbacks into the FVG or key fib levels are likely to be bought up.
Macroeconomic & Fundamental Drivers:
Gold’s rally is being fueled by several key factors:
CPI & Inflation: Recent CPI data shows persistent inflation, increasing demand for gold as an inflation hedge.
Interest Rate Expectations: The market is pricing in potential rate cuts by the Fed later this year, weakening the USD and supporting gold.
Geopolitical Tensions: Ongoing global tensions (e.g., Middle East, Ukraine) are driving safe-haven flows into gold.
USD Strength: Any signs of USD weakness further boost gold’s appeal.
Summary & Trade Plan:
Gold is in a strong bullish phase after a classic liquidity sweep and market structure shift. Watch for retracements into the 3335-3320 zone for potential long setups, with targets at 3385 and 3436. Stay alert for any macro news that could impact sentiment, but for now, the bulls are in control! 🏆📈
Disclaimer:
This is not financial advice. Always do your own research before trading.
