Global Geopolitical Risks Soar: Gold to Hit $3400 TomorrowGlobal Geopolitical Risks Soar: Gold to Hit $3,400 Tomorrow 👉
The Russia-Ukraine Conflict 😖: Putin announced that the Russian military would observe a 30-hour ceasefire during the Orthodox Easter period ⏰. Zelensky said that the duration was insufficient and demanded a comprehensive 30-day ceasefire ⏳, and also pointed out that the Russian military still had 26 assault actions and other offensive operations 💥. The Russian Ministry of Defense stated that the Ukrainian military launched 444 shelling attacks and 900 drone strikes 🚀, resulting in civilian casualties 😭. The two sides stick to their respective positions, and the situation remains tense 🤕.
The South China Sea Situation 🚢: On April 20th, the Philippine Patrol Vessel No. 36 illegally entered China's Huangyan Island territorial sea 🛳️. The Navy of the Southern Theater Command of the Chinese People's Liberation Army drove it away in accordance with the law 🛡️. Its behavior seriously violated China's sovereignty ❗, and China firmly defends its territorial integrity 🇨🇳.
China-US Relations: The US labels China as its top strategic rival, rolling out trade protectionist moves like “301 investigations” on China’s maritime and shipbuilding sectors 🚢 and semiconductor sanctions ⚙️. This stokes global trade friction risks and market uncertainty, driving funds into the gold market for safety 💰.
Situations in the United States 📰:
Economic Game 💸: Trump criticized Federal Reserve Chairman Jerome Powell for being slow in decision-making and called for interest rate cuts 📉. Powell emphasized that the Federal Reserve is not subject to political interference 🙅♂️. The two sides are at loggerheads, triggering heated discussions in the economic field 💬.
Protests in Multiple Places 🤜🤛: On the 19th, there were more than 700 protest activities in cities such as New York and Washington, D.C. 🏃♂️🏃♀️. The public opposed the Trump administration's actions that violated civil rights, such as deporting immigrants and downsizing the federal government 🚫, and the atmosphere at the scene was intense 🔥.
California's Litigation ⚖️: California Governor Gavin Newsom sued the federal government 📄, stating that Trump's imposition of tariffs on multiple countries was illegal, which led to rising prices and economic losses in the state 💰. This is the first case in the United States where a state sues the federal government over tariff issues, attracting extensive attention from the legal community 👀.
Supreme Court Ruling 🏛️: On the 19th, the Supreme Court halted the Trump administration's action of deporting Venezuelan immigrants based on the Alien Enemy Act of 1798 🚫. The ruling result has a significant impact on the immigration policy 🌍.
The Middle East Region 🌴:
The Israel-Palestine Conflict 💥: On the 20th, the Israeli Air Force killed the deputy commander of the 4400 Force of Hezbollah in Lebanon and other two people 💣. The regional situation escalated again, and the road to peace is difficult and tortuous 😔.
The Attack in Iraq ⚠️: In the early morning of the 20th local time in Iraq, the Al-Qarghuli military base in Babil Province was attacked, resulting in one death and eight injuries 😱. Both the United States and Israel denied their involvement, and the reasons behind the attack are shrouded in mystery 🧐.
Others 🌏:
The Earthquake in Myanmar 🌋: On March 28th, a strong earthquake with a magnitude of 7.7 to 7.9 occurred in Sagaing Region, Myanmar, causing significant casualties and property losses 😢. The international community has extended a helping hand 🤝
Ecuador's Alert 🚨: On the 19th, due to a planned terrorist attack against the president and cabinet members, Ecuador entered a state of maximum alert, and the whole country is on high alert 👮♂️
Tesla's Setback 🚗: In the first quarter, Tesla's sales in Europe plummeted 📉. The declines in Germany, Denmark, and Sweden exceeded 50%, and in the Netherlands, it was nearly halved. The Cybertruck performed poorly in the market and was frequently recalled due to quality issues 🔧. The market prospects are full of challenges 😟
Aviation Accident ✈️: On the 19th, a small single-engine plane crashed in Illinois, the United States. The injury situation of the four people on board is unknown 😰. This is the fifth serious aviation accident this month, and aviation safety issues have aroused concern 😓
Internal Conflict in Ukraine 🔫: In the early morning of April 20th, a father and son who were both Ukrainian soldiers opened fire during a police inspection in Vinnytsia region, killing one police officer and injuring another, and then fled 🚓. The police issued a wanted notice for the two, highlighting the internal security issues 😫
💰💰💰 XAUUSD💰💰💰
🎯 Buy@3320 - 3330
🎯 TP 3360 - 3400
Traders, if you're fond of this perspective or have your own insights regarding it, feel free to share in the comments. I'm really looking forward to reading your thoughts! 🤗
👇The accuracy rate of our daily signals has remained above 98% within a month! 📈 We sincerely welcome you to join our channel and share in the success with us! 🌟
XAUUSD.P trade ideas

Lingrid | GOLD Weekly ANALYSIS: UNPRECEDENTED Rally ContinuesOANDA:XAUUSD market continues pushing to higher and higher levels. The market went up approximately 7% in a single week. This was a big upward move, if not the biggest upward move in one week this year. As the market approaches the 3250 level, we can see some price deceleration. This may lead to a corrective move. After such an impulse move, the market usually consolidates. Therefore Monday and Tuesday might be sideways move days.
On the daily timeframe, the price is creating an ABC move which potentially completes around the 3300 level. If Monday's candle opens with a gap up, this suggests the price may surge again. However, if we get a pullback, then we can look for buying opportunities below the 3200 support level or the previous day's low.
Traders, if you liked this idea or if you have your own opinion about it, write in the comments. I will be glad 👩💻

I know, gold bulls don't want to read this right now...I know, gold bulls don't want to read this right now...
But even during bull markets, gold had these corrections:
Dec 1974 to Aug 1976, drop over 48%.
Mar 2008 to Oct 2008, drop over 33%.
Aug 2020 to Sep 2022, drop over 22%.
Same setup now with price historically stretched.

Gold's Cup and Handle: Historical Analysis, post completionThe recent completion of a Cup and Handle pattern on Gold price action leaves an open question about the historical performance after such a technical formation plays out. While Cup and Handle patterns are generally considered bullish, there are legitimate historical reasons to question maintaining a long position after the pattern completes.
Pattern completion often marks exhaustion points
======================================
Historically, the completion of a Cup and Handle pattern indicates near term exhaustion of buying pressure rather than the beginning of a sustained move higher. This occurs because:
1) The pattern completion itself often represents the culmination of a buildup in speculative long positioning.
2) Technical traders who entered based on the pattern may take profits once their target is achieved.
3) The psychological milestone of completing the pattern can trigger selling from larger institutional players.
For example, the technical Bull flag of 2001 on completion saw a 40% following correction. Were that to happen on the Cup and Handle pattern upon completion price action would return to $1950
2001 Bull flag
Monetary policy transition periods
======================================
Historical analysis shows that gold's technical pattern reliability decreases significantly during periods of monetary policy transitions. If the Cup and Handle completion coincides with a shift in central back policy stance (particularly Federal Reserve policy), historical precedent suggest heightened risk of pattern failure.
Looking left, breakouts in the Bond market resulted in serious downside pressure for Gold price action, the Federal Reserve may not have a choice in the months ahead. Especially as the cost of servicing the debt grows and foreign entities increase Bond market selling pressure.
10 year Bond breakout
Conclusion
======================================
While the Cup and Handle pattern is traditionally viewed as bullish, historical data specific to gold markets suggest caution about maintaining long position immediately following pattern completion. The historical tendency toward mean reversion, pattern reliability concerns, volatility expansion, and correlation breakdowns all suggest that a more measured approach may be warranted.
Ww

GOLD Took Third Scenario , New Entry Valid To Get 500 Pips !Here is my second place we can buy gold from it after the first entry that gave us more than 700 pips from last analysis please check it to know all scenarios for the next days , now i`m looking to buy gold again after retest the previous high that already broke , and with any bullish P.A , We can enter a new entry with 500 pips target .
This Is An Educational + Analytic Content That Will Teach Why And How To Enter A Trade
Make Sure You Watch The Price Action Closely In Each Analysis As This Is A Very Important Part Of Our Method
Disclaimer : This Analysis Can Change At Anytime Without Notice And It Is Only For The Purpose Of Assisting Traders To Make Independent Investments Decisions.
Gold Dips From PRZ – Will Supports Hold for New ATH?Gold ( OANDA:XAUUSD ) started to correct again from the Potential Reversal Zone(PRZ) and near the Resistance lines . The question is, can Gold create a new All-Time High(ATH) again?
In terms of Elliott waves , Gold appears to be completing a main wave 4 . This main wave 4 is likely to complete near the Support lines and Support zone($3,168-$3,133) .
I expect Gold to either rise again after breaking the Resistance zone($3,220-$3,211) or near the Support zone($3,168-$3,133) and Support lines .
Do you think Gold can create a new All-Time High(ATH) again?
Note: If Gold breaks the Support zone($3,168-$3,133), we should expect a further correction from Gold.
Gold Analyze ( XAUUSD ), 1-hour time frame.
Be sure to follow the updated ideas.
Do not forget to put a Stop loss for your positions (For every position you want to open).
Please follow your strategy; this is just my idea, and I will gladly see your ideas in this post.
Please do not forget the ✅' like '✅ button 🙏😊 & Share it with your friends; thanks, and Trade safe.

Fading Gold’s All‑Time HighGold has just posted a euphoric all‑time high at 3 499.6 after an almost parabolic climb along a single ascending trend‑line, and the wick that pierced that level sits in a thin, low‑volume pocket on the profile—classic bull‑trap territory—so once we see a four‑hour close beneath the trend‑line we expect momentum algos to flip, dragging price swiftly toward the 3 160‑3 130 demand block that marks the prior high‑volume consolidation; the short thesis is to scale into shorts between 3 480‑3 510, place invalidation above 3 525, and ride a potential vacuum move to that target zone (with room to extend toward 3 100) as crowded longs unwind, especially if a hawkish Fed headline or uptick in real yields provides the spark.

Gold (XAU/USD) Multi-Timeframe Technical Outlook
Multi-Timeframe Analysis – Gold (XAU/USD)
⸻
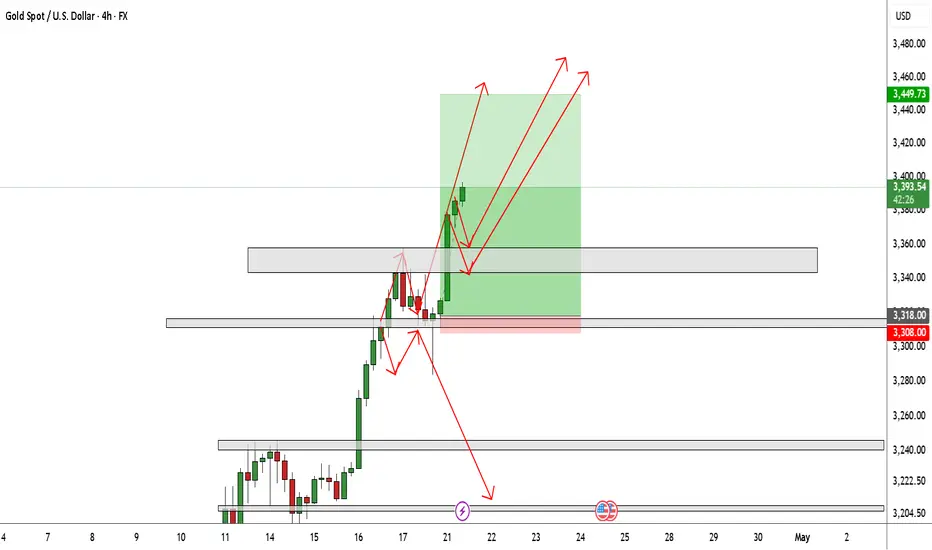
1H Chart – Bullish Continuation Potential
On the 1-hour chart, Gold is trading within a defined channel structure after reaching an all-time high (ATH) of 3357.775. Following this peak, the price made a shallow retracement between the 38.2% and 50% Fibonacci levels, indicating underlying bullish strength.
Currently, the price has formed a Descending Broadening Wedge — a pattern typically associated with bullish continuation. A successful breakout above the wedge’s upper boundary and the key resistance levels at 3334, 3346, and 3357 could pave the way for a rally toward the 3400 level.
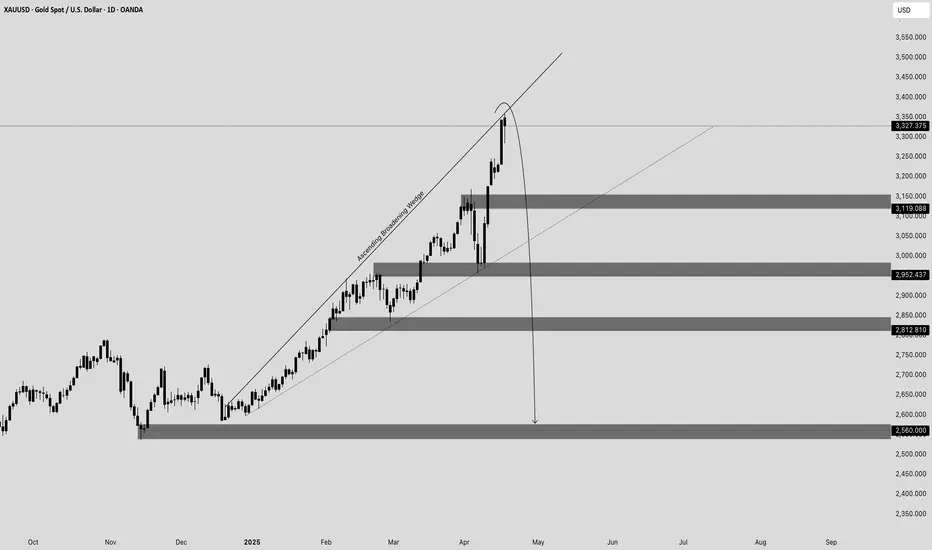
Daily Chart – Bearish Reversal Structure
In contrast, the daily chart reveals an Ascending Broadening Wedge — a known bearish reversal pattern. The price is trading near the upper region of this structure, and the measured move projection of the pattern points toward a potential decline to the 2560 area, should the bearish scenario play out.
⸻
Final Note
While short-term charts signal bullish opportunities, the daily chart reminds us of the broader reversal risks. As always, strict risk management is essential to protect capital and lock in profits in both trending and volatile conditions.
⸻
Happy Trading,
SpicyPips
Gold / Potential Swing SpotOnly up and up. We have reached a suitable place for correction, on a daily time frame. I think there is a pretty good opportunity for Selling from this level.

Gold Eiffel Tower The GOLD GTFO is still in play.
What saved Gold was the stopping for the market crash when Trumnpchenko manipulated the markets. Had the crash continued Gold would have crashed with it. As it is the last safe haven for money to pile into and people just give up and sell everything in sight.
If you were an early buyer of gold and sold above $3,000 then you have a nice 50% gain.
Take your money and RUN! All the way to the bank! Don't be a dick for a tick. If you are then you will ride it all the way back down.
When will it top no one can know. But what pros do is take their money and RUN! So be a pro! ;)
Click like follow subscribe!

Gold bull cycle continues, 3400✍️ NOVA hello everyone, Let's comment on gold price next week from 04/21/2025 - 04/25/2025
🔥 World situation:
Gold prices are poised to close the week on a strong footing, gaining over 2.79% as the precious metal surged nearly $90 amid continued US Dollar (USD) weakness driven by lingering global trade uncertainties. At the time of writing, XAU/USD is trading around $3,326.
Despite touching a fresh all-time high of $3,358, the rally has cooled slightly as traders lock in profits ahead of the extended Easter weekend, with both European and US markets closed. Meanwhile, real yields have ticked higher, offering a modest headwind. On the policy front, San Francisco Fed President Mary Daly noted that the US economy remains resilient, though some segments are showing signs of slowing. She emphasized that monetary policy is still restrictive enough to keep inflation in check, while also suggesting that neutral rates could be on the rise.
🔥 Identify:
Gold price is still in a big uptrend, short-term corrections only make gold price accumulate more and continue to reach new ATH, tariffs are tense, gold price continues to increase strongly: 3382, 3400
🔥 Technically:
Based on the resistance and support areas of the gold price according to the H4 frame, NOVA identifies the important key areas as follows:
Resistance: $3357, $3382, $3400
Support : $3284, $3236, $3155
🔥 NOTE:
Note: Nova wishes traders to manage their capital well
- take the number of lots that match your capital
- Takeprofit equal to 4-6% of capital account
- Stoplose equal to 2-3% of capital account
- The winner is the one who sticks with the market the longest

XAUUSD It's most important week in 5 years.Gold (XAUUSD) hit last week the multi-year Higher Highs trend-line that has been in effect since the July 04 2016 High. Last time it had a rejection on it was on August 03 2020 when the market started the last 2-year Bear Cycle.
The current 1W candle has opened above this Higher Highs trend-line, so the week is of utmost importance as a closing below it maintains the pattern and the bearish Cycle Top bias, while above it jeopardizes invalidating it.
If as a result, the market closes the week below it and remains within the Fibonacci Channel Up, we may indeed be on Leg (4) peak and our Target will be near the 0.382 horizontal Fibonacci level at 2700 towards the end of the year. If not, we will see what new pattern is created and adapt accordingly (updates will follow).
-------------------------------------------------------------------------------
** Please LIKE 👍, FOLLOW ✅, SHARE 🙌 and COMMENT ✍ if you enjoy this idea! Also share your ideas and charts in the comments section below! This is best way to keep it relevant, support us, keep the content here free and allow the idea to reach as many people as possible. **
-------------------------------------------------------------------------------
Disclosure: I am part of Trade Nation's Influencer program and receive a monthly fee for using their TradingView charts in my analysis.
💸💸💸💸💸💸
👇 👇 👇 👇 👇 👇

Gold: Reversal Is Near
The impulse move in OANDA:XAUUSD COMEX:GC1! CAPITALCOM:GOLD TVC:GOLD AMEX:GLD appears to be complete. Several signals point to an imminent correction:
A five-wave structure is nearing its final leg
RSI is showing bearish divergence
Volume is surging at the top — a classic sign of distribution
The 3315–3350 zone is a risk area.
Expecting a pullback to 3200–3150, possibly deeper.

Updated Structure & Trend (April 17 – Pre-Weekend Trading)🧠 Updated Structure & Trend (April 17 – Pre-Weekend Trading)
✅ HTF (D1, H4): Price has made a new all-time high at 3357, extending the bullish run — but we're now deep in premium exhaustion territory.
🟠 M30–H1: First signs of distribution and internal CHoCH on M15 are showing. No follow-through above ATH. Price is stalling, likely waiting for NY volume.
⚠️ Volatility is low, and Friday is a market holiday, so any manipulation or rejection will likely happen today.
🔼 New ATH: 3357
This makes previous zones like 3333–3340 less relevant for traps.
Focus shifts to the true inducement zone:
🔻 3355–3365 → Main sniper short zone, valid only with clear M5 structure (BOS or reversal FVG).
🔻 Key Sell Zones (Updated):
3355–3365 → Final inducement / exhaustion zone near new ATH
3342–3345 → OB retest below weak high, valid only if confirmed with bearish PA on M5
🟢 Key Buy Zones (Same):
3284–3288 → OB + FVG + discount zone
3260–3265 → H1 equilibrium and last clean demand
3230–3235 → Deeper reentry zone if we get a flash crash before NY
📊 Trading Logic:
If NY session spikes again into 3355–3365, we're ready to snipe with precision.
If price fails to reclaim 3345 and breaks M5 structure, we target early shorts.
On a clean dump, we look for longs in the 3280–3260 range, with confirmation.

Gold skyrocketing as expectedAs discussed throughout my yesterday's session commentary: "My position: Gold is soaring as it represents safe-haven asset, I'd prefer to stay with the trend (Bullish). I have attempted to Buy Gold on #3,208.80 and since Price-action tested #3,214.80 I moved my Stop on breakeven and it got triggered moments ahead which left me without order and Gold delivered #3,225.80 extension. However I have managed to re-Sell #3,225.80. I will keep Buying every dip on Gold for maximum Profit optimisation from my calculated re-Buy zones. #3,192.80 is Support for current Bullish motion."
Technical analysis: I have announced that Gold might skyrocket as next Resistance zone is priced at #3,322.80 / break of it might extend the uptrend towards #3,352.80 benchmark configuration. Gold has invalidated solid Neutral Rectangle on Hourly 4 chart and if you recall, delivered #2 additional Higher High’s extension (my chart’s explanation that Gold always delivers #3 Higher High's extensions ahead of full scale reversal, so practically I have one more Higher High’s to expect according to the cycle). DX (# -0.63% almost) is again turning the market sentiment to Bullish on Intra-day basis, and according to my estimations, current Buying sequence was due to the Trump's tariff's talks, which is being aggressively Bought due to the remarks.
My position: Congratulations for those who Bought Gold from #3,220's as per my advice.

new peak 3520, waiting for gold price to touch⭐️GOLDEN INFORMATION:
Gold prices extended their record-breaking surge on Tuesday, soaring past the $3,450 mark during the Asian session as investors sought refuge in the traditional safe-haven asset amid mounting fears of a US recession and broader financial market volatility.
Persistent concerns over the economic outlook and waning confidence in the US Dollar (USD) have continued to drive demand for the USD-denominated precious metal. The greenback remains under pressure, further amplifying gold's appeal.
Adding to the uncertainty, US President Donald Trump once again criticized Federal Reserve Chairman Jerome Powell, stoking fears about the central bank’s independence. Reports suggesting the administration explored legal avenues to potentially remove Powell have only deepened market unease, boosting the allure of gold as a hedge against policy and economic instability.
⭐️Personal comments NOVA:
Fomo price increase, trade tension, gold price benefits
⭐️SET UP GOLD PRICE:
🔥SELL GOLD zone : 3519- 3521 SL 3526
TP1: $3505
TP2: $3490
TP3: $3465
🔥BUY GOLD zone: $3403 - $3405 SL $3398
TP1: $3415
TP2: $3430
TP3: $3445
⭐️Technical analysis:
Based on technical indicators EMA 34, EMA89 and support resistance areas to set up a reasonable BUY order.
⭐️NOTE:
Note: Nova wishes traders to manage their capital well
- take the number of lots that match your capital
- Takeprofit equal to 4-6% of capital account
- Stoplose equal to 2-3% of capital account

Gold Target $4054 Year 2025-2026 With Reasons & 4$rules.1st Tp completed at 3341
2nd Tp 3437
3rd Tp 3622
4th Tp 3747
Final target is $ 4054 for Year 2025 to 2027
Below the Base line mentioned in chart will be the Seller profit zone which is marked as 1st Support, 2nd Support, 3rd Support & 4th Major Support.
Current Major reasons mentioned in the chart and future will be running of food, drinking water crisis and health issues will remain on high alerts (after covid 19 and pollution issues) and Insurance companies profits will be on Top of every Monthly trading results.

XAUUSD: 1H Channel Up bottomed and is rebounding for the new HHGold is neutral on its 1H technical outlook (RSI = 52.820, MACD = 3.110, ADX = 23.525) and as it just crossed under its 1H MA50 and rebounded, we have the conditions for the new bullish wave of the short term Channel Up. We are aiming for another +4.45% rise (TP = 3,425).
## If you like our free content follow our profile to get more daily ideas. ##
## Comments and likes are greatly appreciated. ##

XAUUSDThe long-term trend of gold is completely bullish according to previous analyses, which still shows a strong bullish trend on monthly time frames.
We expect a correction in the chart during next week , but The long term trend of Gold is still bullish and we couldn't see any ICHIMOKU based divergence.
important support and resistance levels on the chart is highlighted.

GOLD 1H CHART ROUTE MAP & TRADING PLAN FOR THE WEEKHey Everyone,
Please see our updated 1h chart levels and targets for the coming week.
We are seeing price play between two weighted levels with a gap above at 3261 and a gap below at 3230. We will need to see ema5 cross and lock on either weighted level to determine the next range.
We will see levels tested side by side until one of the weighted levels break and lock to confirm direction for the next range.
We will keep the above in mind when taking buys from dips. Our updated levels and weighted levels will allow us to track the movement down and then catch bounces up.
We will continue to buy dips using our support levels taking 30 to 40 pips. As stated before each of our level structures give 20 to 40 pip bounces, which is enough for a nice entry and exit. If you back test the levels we shared every week for the past 24 months, you can see how effectively they were used to trade with or against short/mid term swings and trends.
The swing range give bigger bounces then our weighted levels that's the difference between weighted levels and swing ranges.
BULLISH TARGET
3261
EMA5 CROSS AND LOCK ABOVE 3261 WILL OPEN THE FOLLOWING BULLISH TARGET
3292
EMA5 CROSS AND LOCK ABOVE 3292 WILL OPEN THE FOLLOWING BULLISH TARGET
3324
EMA5 CROSS AND LOCK ABOVE 3324 WILL OPEN THE FOLLOWING BULLISH TARGET
3352
BEARISH TARGETS
3230
EMA5 CROSS AND LOCK BELOW 3230 WILL OPEN THE FOLLOWING BEARISH TARGET
3201
EMA5 CROSS AND LOCK BELOW 3021 WILL OPEN THE RETRACEMENT RANGE
3179
3167
EMA5 CROSS AND LOCK BELOW 3167 WILL OPEN THE SWING RNGE
3120
3094
EMA5 CROSS AND LOCK BELOW 2975 WILL OPEN THE SECONDARY SWING RANGE
SECONDARY SWING RANGE
3069 - 3038
As always, we will keep you all updated with regular updates throughout the week and how we manage the active ideas and setups. Thank you all for your likes, comments and follows, we really appreciate it!
Mr Gold
GoldViewFX

Sorry, I want to buy gold, it's falling.First of all, I never claimed that all my analyses were 100% successful. But you only need to look at the last 20 to 50 of the 2200+ analyses to see that the success rate of these analyses is above 88%, sometimes even up to 95%!
The only exception in yesterday's analysis was that gold failed to continue to fall and failed to break the low of $3187 or lower. Instead, we witnessed the continuation of the bullish trend and set a new high of $3319.
I know many people are burning their accounts because of the surge in gold. Or have already burned. Join me. I will give you free professional advice

DeGRAM | GOLD Slows Under Resistance📊 Technical Analysis
GOLD failed to break out above the resistance line near $3 400 and is retreating from overbought levels; low volatility signals weakening momentum and a likely pullback toward support around $3 325.
💡 Fundamental Analysis
Short-term macro drivers also tilt bearish. Rising U.S. Treasury yields are making gold less attractive, while hawkish Fed signals fueled by strong U.S. data have strengthened the dollar.
✨ Summary
Technical and fundamental factors point to a short-term bearish correction in XAUUSD.
-------------------
Share your opinion in the comments and support the idea with a like. Thanks for your support!

GOLD Trade Plan 16/04/2025Dear Traders,
"Gold continues its bullish trend without any significant correction, primarily driven by ongoing systematic risks. At present, in the 4-hour timeframe, it has reached the upper boundary of its ascending channel. Should a correction take place, a retracement toward the 3250 level is possible. Following that, the chart should be re-evaluated to identify potential buying opportunities."
If you enjoyed this forecast, please show your support with a like and comment. Your feedback is what drives me to keep creating valuable content."
Regards,
Alireza
