Lingrid | GOLD complex PULLBACK from RESISTANCE zoneOANDA:XAUUSD is maintaining its structure above a key upward trendline after a higher low formed near support. The market remains technically bullish while staying above this level, with the recent pullback looking corrective rather than impulsive. Buyers may step in for a renewed attempt toward the upper resistance area. Watch for a bullish breakout continuation above 3,326 toward 3,380 if buyers hold the current support line.
📌 Key Levels
Support zone: 3,305.583 (upward trendline and structure base)
Breakout target: 3,380.000 (resistance ceiling of range)
Invalidation level: Below 3,304.696 (would negate bullish setup)
⚠️ Risks
Breakdown below trendline could trigger deeper correction
Price consolidation may reduce momentum short term
Rejection near 3,326 could signal fading bullish strength
Traders, if you liked this idea or if you have your own opinion about it, write in the comments. I will be glad 👩💻
XAUUSD.P trade ideas

Latest gold operation analysisFrom the daily level, the current price resistance is in the 3310 area, which is the key watershed of the band trend. If the price is below this position, the subsequent band will be shorted. At the same time, for the short-term four-hour price resistance, it is in the 3253 range. The gains and losses of this position determine the key to the short-term trend. The price will consolidate up and down at this position in the short term. Pay attention to the support of this position and further test the daily resistance area before looking at the pressure.

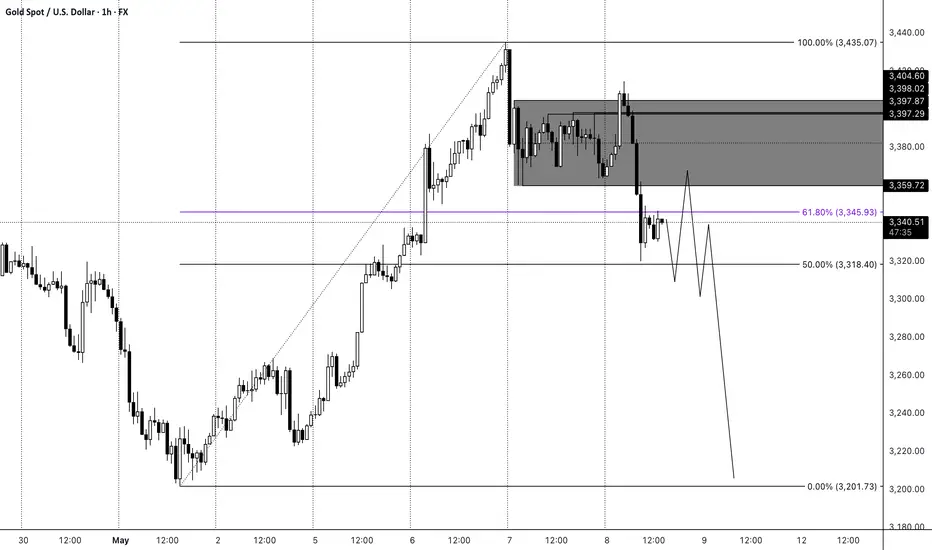
Gold Narrative OverviewGold remains in a long-term and medium-term uptrend, while currently showing signs of a short-term pullback. Given this context, the most logical stance is to continue looking for buying opportunities. However, price has reached rather extreme levels after a sharp and uninterrupted rally in recent weeks. That’s why I lean toward the expectation of at least a temporary pause followed by a downside correction and the formation of a consolidation phase.
On the local timeframe, I anticipate that the price may continue to move lower through a consolidation, targeting the previous support level around 3,201. While short-term bullish impulses are still possible, I expect the broader move to be downward. This bearish setup would be invalidated if the price breaks above 3,380.
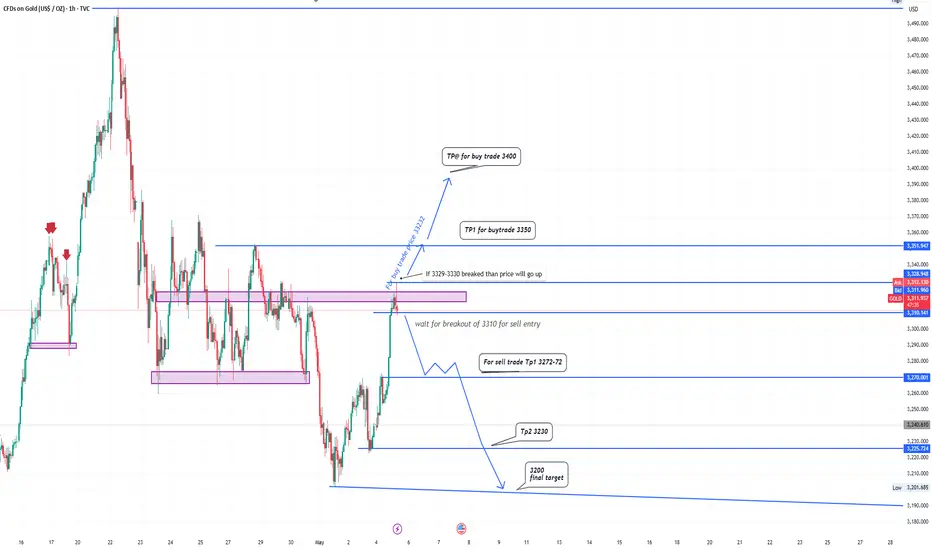
Quick setup on XAUUSD current scenario> The chart shows a consolidation area near 3310–3330, which is a key resistance zone.
> Price recently made a sharp bullish move into that resistance, now testing the zone.
> Several historical rejections (red arrows) align with this level, reinforcing it as a decision point.
:Bullish Scenario (Buy Plan):
Entry Trigger:
If 3329–3330 is broken with confirmation (i.e., retest or strong close above).
Targets:
TP1: 3350
TP2: 3400
Note:
Confirmation might be a retest of 3322, labeled as "buy trap price", which could serve as new support.
Bearish Scenario (Sell Plan):
✅ Entry Trigger:
Wait for a clean break below 3310, which has held as a support.
🎯 Targets:
TP1: 3272–3270
TP2: 3230
Final Target: 3200
🔹 Bearish Flow:
The projected price path is a stair-step decline, suggesting pullbacks before continuation downward.
Summary & Trade Logic:
Bias Condition Entry Level Take Profits
Bullish Break & hold above 3330 Above 3330 (ideally 3329–3330) 3350, 3400
Bearish Break below 3310 Below 3310 3272–70, 3230, 3200
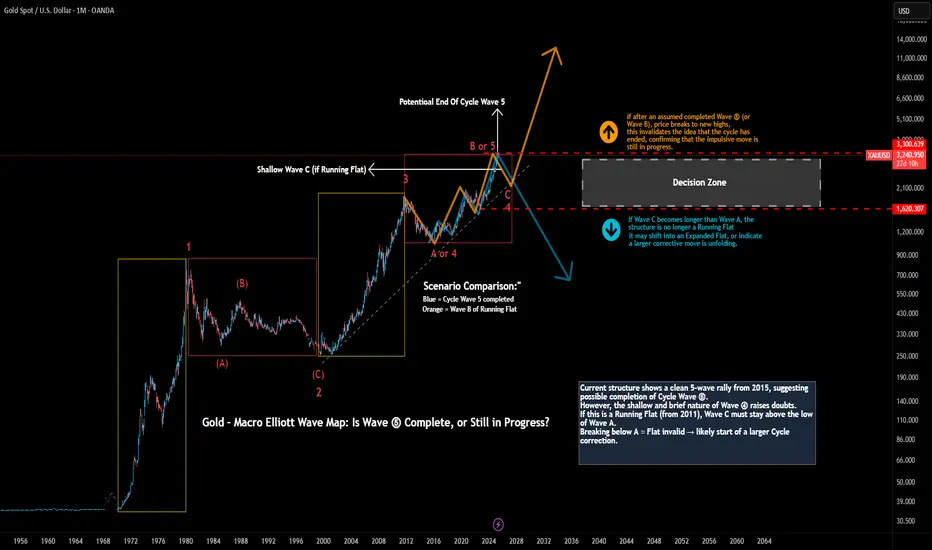
Gold Macro Elliott Wave Analysis – Is Cycle Wave ⑤ Already Done?This analysis presents a long-term Elliott Wave interpretation of gold from the 1970s to the present, focusing on the macro cycle structure.
We are currently facing a major inflection point, where two valid scenarios emerge:
Scenario 1 – Cycle Wave ⑤ Completed:
A clear 5-wave impulse from the 2015 low is visible, with Wave (5) extending to the 2.618 extension of Wave (1). This aligns well with typical Fibonacci proportions.
If this is correct, a multi-year correction may now begin, marking the end of the long-term bullish cycle.
Scenario 2 – Still in a Running Flat:
Alternatively, the entire structure since 2011 may still be part of a Running Flat correction:
Wave A: 2011–2015
Wave B: 2015–2024 (currently near 2.0 × A, which is extreme but still technically possible)
Wave C: Yet to come (expected to be shallow and brief if this scenario holds)
Key Decision Point:
If Wave C drops below the low of Wave A, the Running Flat scenario fails — and we may be seeing the start of a larger degree correction.
On the other hand, if price continues higher and breaks the assumed Wave (5) top, it may indicate the impulsive move is still in progress and the current count must be re-evaluated.
Let me know your thoughts — which scenario do you favor?
Is this the end of a decades-long cycle? Or are we still preparing for the final rally?
#Gold #XAUUSD #ElliottWave #WaveAnalysis #TechnicalAnalysis
#MacroTrends #Commodities #Wave5 #RunningFlat #TradingView
#CycleAnalysis #PriceAction #MarketStructure #GoldForecast
gold still is in bullish side!!!we should just buy gold in deeps guys...every steps down in gold is an goooooood chance to buy it and hold it for saving money an make profit...just buy buy buy gold in deeps and corrections

GoldXAUUSD
- Symmetrical Triangle as an corrective pattern in Short Time Frame
- Break of Structure
- S / R Level
- Completed " 123 - abc " Impulsive Waves
- Fibonacci Level - 50.00% / 61.80%

GOLD SELL SETUP
To determine the reason behind selling gold at $3263:$3264, let's examine current market conditions and possible factors influencing this decision.
*Possible Reasons:*
- *Resistance Level*: $3263:$3264 might be acting as a resistance level, where gold prices face selling pressure or struggle to break through. This level could be influenced by historical price movements or technical indicators.
- *Profit-Taking*: Investors might be selling gold at this price range to secure profits, especially after recent gains. This decision could be driven by market volatility or shifts in sentiment.
- *Market Sentiment*: Changes in market sentiment, driven by news or economic data, can impact gold prices. If sentiment is bearish, traders might be more inclined to sell at $3263:$3264.

XAUUSD SIGNAL READ THE CAPTAINXauusd signal technical analysis satup 👇🏼
( Xauusd ) Sell zone
( TRADE SATUP)
ENTRY POINT (3366) to (3368) ✅
FIRST TP (3360)✅
2ND TARGET (3354) ✅
LAST TARGET (3345) ✅
STOP LOOS (3374)❌
FALLOW RISK MANAGEMENT ✅✅

GOLD XAUUSDCurrently has shown high support around 3200. we believe it can retest 3200 once again. Best buying opportunity are around 3200 and 3175.
write me any questions in the comment below. I will answer

Gold price analysis May 6Due to the impact of world economic and political tensions. The gold candle has reversed to increase again with the D1 candle increasing by nearly 100 prices.
The gold uptrend has formed and it is easier to trade to find entry zones. Today's beautiful Buy zone is noticed in the price retests to the Break out zone. 3328 is considered a buying opportunity today. Currently, gold is sideways in the 3372 and 3354 range. Watch for a breakout to trade the breakout and wait for the main entry zone. When gold increases, it will encounter barriers or targets for buy orders at 3410. Today is a day without much important news, so the 3410 and 3328 ranges are considered strong. If it breaks through this range, pay attention to the quite far range around 3445 and 3270

Gold another shortShort from 3350$ .
i think gold will keep going down .
It is time for crypto to take the momentum

Gold is rising strongly. When can the bull market stop?🗞News side:
1. Trump announces renegotiation of USMCA
2. Pay attention to the Fed interest rate
📈Technical aspects:
Looking at the daily chart, gold prices are breaking through important resistance levels and forming a strong upward trend. The price is currently trading around 3410, with strong suppression at 3420-3430 above the short-term. If the gold price encounters resistance and pressure, gold may once again experience a correction. Therefore, when the gold price touches the 325-3435 line, you can try to place a short position. In terms of operation, after two consecutive positive days on the technical front, the bulls will continue further. The current short-term support has moved up to the 3386 line. 3386 is the early resistance that turned into support after breaking through. This will be an important support level. At the same time, the 3270-3260 line support below is still strong. Continue to look at the 3430-3450 line. Therefore, in terms of operation, we mainly do long positions on callbacks and supplementary short positions on rebounds.
If you agree with this view, or have a better idea, please leave a message in the comment area. I look forward to hearing different voices.
OANDA:XAUUSD FX:XAUUSD FXOPEN:XAUUSD FOREXCOM:XAUUSD TVC:GOLD

Gold is expected to pull back, short gold!Fundamentals:
Focus on the Fed's interest rate decision and Powell's speech;
I think the Fed will keep the interest rate decision unchanged this time, at least it will not announce a rate cut this time, which may suppress the gold market;
Technical aspects:
Before the Fed's interest rate decision, gold is currently in a volatile state. However, relatively speaking, it is currently in a volatile and bearish state, with short-term resistance in the 3395-3405 area; and gold has repeatedly tested the 3370-3360 below during the retracement process. After multiple tests, gold may be more likely to break through this support area; the key support below is in the 3360-3350 area, followed by the 3320-3310 area.
Trading strategy:
Consider shorting gold in the 3395-3405 area, TP: 3370-3360

GOLD - Is this the end of the Bull Run?Gold has once again followed my previous analysis — turning bearish right at key levels! 🚩 After an incredible bull run where price kept making new highs, signs are now pointing to a possible top. We could be entering a short-term bearish phase here, with potential for a deeper correction if momentum builds.
Right now, I’m holding a bearish bias. I’ll be watching for solid sell setups, especially around those well-defined resistance zones. There’s also an unfilled gap below that could attract price action — keep an eye on that level (chart shows the zone clearly 🔎).
I’ll be looking for confirmation through structure breaks and clean retests before entering shorts.
What’s your take — are we seeing a reversal brewing, or is this just a dip before the next leg up? Drop your thoughts below!
If this analysis helps, a boost or follow would mean a lot — and keeps you in the loop for the next moves! 🚀

XAUUSD Price Action: Bullish Break + Liquidity Sweep Trade Idea🪙✨ Gold (XAUUSD) Technical Outlook ✨📈
I’m currently analyzing XAUUSD on both the daily and 4H timeframes, and here’s what I’m seeing:
🚀 Price has broken bullish structure and is now looking overextended, pushing into a buy-side liquidity zone—clearly visible to the left of current price action. 💰📊
It’s clearing buy stops, which could trigger a retracement soon. 🧲🔁
🎯 I’m watching closely for a pullback into the 50%–61.8% Fibonacci retracement zone on the current price swing—that’s my key point of interest for a potential long setup, provided we see a healthy pullback followed by another bullish break of structure. 🔍🔐
🧠 Not financial advice—just my personal analysis. Always manage risk. ⚠️📉

DXY, BTCUSD, USDJPY, XAGUSD & XAUUSD Daily Trade SetupsIn this update we review the recent price action in the Dollar, Bitcoin, Yen, Silver & Gold and identify the next high probability trading setups and price targets. To review today's video analysis click here!

Fibonacci Confluence Fuels Gold’s Next Rally: Wave (Y) InsightThis 4-hour chart of XAU/USD is showcasing a WXY corrective pattern, a classic double zigzag (W)-(X)-(Y) correction after a strong impulsive move
Wave (W) has topped, marking the end of the first corrective leg.
A deep correction into the 0.5 Fibonacci retracement level occurred with wave (X), forming a potential higher low within the red demand zone.
Now, wave (Y) is anticipated, which typically mirrors or slightly exceeds the length of wave (W) but in a more corrective format.
Target 1: 3292.629
Target 2: 3372.161
Stop loss: 3201.955

GOLD BEST PLACE TO BUY FROM|LONG
GOLD SIGNAL
Trade Direction: long
Entry Level: 3,341.45
Target Level: 3,414.79
Stop Loss: 3,292.55
RISK PROFILE
Risk level: medium
Suggested risk: 1%
Timeframe: 2h
Disclosure: I am part of Trade Nation's Influencer program and receive a monthly fee for using their TradingView charts in my analysis.
✅LIKE AND COMMENT MY IDEAS✅

Valid or fake out? - [1H] formationHere is what I noticed—let me know if this aligns with your perspective or if you see something different.
📌 Wave Structure Alignment
Wave A → C → E show corrective declines within the contracting triangle.
Wave B → D retrace in a controlled manner, respecting contraction limits.
Price tightening near 3392 - 3360, signaling absorption before a breakout move.
📌 Fibonacci Relationship Check
Wave A retraced ~38.2% - 61.8% of the previous impulse move.
Wave B & C followed standard corrective depths (~50% - 78.6%), aligning with expected fib levels.
Wave E represents the final squeeze (~38.2% - 61.8% of Wave D), acting as a breakout trigger.
📌 Liquidity Positioning & Institutional Play
Bullish Breakout Potential: A strong push above 3417 could activate momentum toward 3440 - 3510, but only if absorption transitions into expansion.
Bearish Breakdown Risk: If price rejects 3392, expect a liquidity grab driving price into 3303 - 3370 range.
💡 Verdict: What to Watch Next
The triangle structure appears valid, following typical Fibonacci relationships and smart money positioning. However, the breakout direction remains uncertain—monitor liquidity behavior closely before confirming entry.
📌 Key Levels in Play
🔹 3378 Retest: A crucial resistance zone—failure to reclaim suggests strong sell pressure.
🔹 Break Above: If buyers absorb selling pressure, the move could extend past 3385 pivot, favoring bulls.
🔹 Failure to Hold: A rejection at 3378 could induce fast liquidation, sending price toward 3363 and below.
🔥 Smart Money Perspective
Institutions may test 3378 multiple times before deciding the next move.
If absorption strengthens , price may lean bullish.
If rejection dominates , expect a fast downward sweep into 3339 - 3326 range.
The liquidity game is in play—what’s your take on this setup? Anything you’d fine-tune based on current order flow? 🚀🔥 Would love to hear your perspective!

Global central banks are increasing their holdingsGold hit a low of 3323 in the morning and then began to rebound strongly, reaching a high of 3386, then fell to a low of 3352, and rebounded to 3372. Gold made a slight correction near 3365 for a while, then fell to 3350, and now rebounded to 3368. There is less than an hour left before the European session. It is currently in the middle of the strong stretch in the morning. Now, gold still has some room for stretching. The upper resistance is currently at 3374-3377, which is expected to be the highest level today, and the lower support is 3340-3330. It is recommended to rebound short.
Operation strategy 1: It is recommended to rebound short at 3374-3378, stop loss at 3384, and the target is 3355-3325.

XAUUSD NEW KEY LEVELS📈 XAUUSD Trade Setup 📉
Please refer to the highlighted boxed zone 🟦 on the chart for key price action levels.
🔵 Buy Setup
Initiate a buy position if a candle breaks and closes above the boxed area.
Then, enter when the next candle breaks the high of the closing candle.
🔴 Sell Setup
Initiate a sell position if a candle breaks and closes below the boxed area.
Then, enter when the next candle breaks the low of the closing candle.
🎯 Target Levels
The blue lines 🔵 indicate our target levels.
Close 90% of your position to secure profits 💰.
Hold the remaining 10% for potential extended gains 🚀.

Gold short: A Video Walkthrough on AnalysisOver in this video, I went through live on how I analyze the Gold Chart (I did not prepare before hand). Here, I propose that Gold has further to to fall and set 3 different targets and how I derived the targets.
