GOLD increased in the short term: Break down expectedThe Gold market has been very strong for some time, but I don’t think this will continue to be the case going forward. As we’ve seen, the price has rallied a bit on Friday with Trump’s EU tariff threats.
Market structure starts to hint exhaustion, as such overbought conditions often lead to generous pullbacks, supporting needed corrections.
That being said I do think that on Monday we might see a short term pullback.
We can see that gold is currently being rejected just above the higher zone of the 4h ascending channel. The zone aligns with a low-volume node as well. Therefore, at this zone around the 3,350, I wouldn't recommend to chase high. Before this zone is clearly broken considering long entries here would be buying blindly.
Right now I think you have to look at this as a market that may just simply be a buy on the dip and hold till we get to the $3,500 level again type of situation.
The other scenario is that the market will consolidate for a while.
If we were to break down below the $3,290 level, then $3,200 is next support.
In the long run though the bias remains bullish with potential to challenge the 3,435 and as well as 3,500 in the big picture.
But if you're watching for buys:
wait to see how price behaves on Monday
watch for sustained bullish structure before getting involved
don’t chase, wait for a clean break + candle confirmation pattern
For sells:
Watch for bearish rejection in the next couple of candles (4H or Daily)
Don’t enter unless it’s confirmed!
XAUUSD trade ideas

Lingrid | GOLD Weekly Outlook: Flag BREAKOUT Eyes April HighOANDA:XAUUSD is currently forming a textbook flag pattern at 3,358, following the sharp rally from March lows. This consolidation represents a pause in bullish momentum rather than a reversal, with price oscillating between well-defined boundaries in a rectangular formation. The 4H chart shows a completed corrective wedge pattern after April's 3,500 high, while the daily timeframe clearly displays the flag structure - a classic trend continuation pattern. The downward trendline containing recent price action appears increasingly vulnerable as gold approaches the flag's upper boundary.
Key technical levels include immediate resistance at 3,400, with the more significant battle at 3,500 where April highs converge with the flag's upper boundary. A decisive break above this zone could trigger rapid acceleration toward measured move targets around 3,680 - 3,720. The major support at 3000 has held firm throughout consolidation, providing a solid foundation for renewed buying. The primary uptrend remains intact with consistent higher lows despite periodic weakness.
The broader macro environment continues supporting gold's fundamental case through geopolitical uncertainties, currency concerns, and diversification needs. Combined with this compelling technical setup, the current consolidation likely represents accumulation rather than distribution. Next week we should monitor the flag's upper trendline closely, as any breakout above 3,380 - 3,400 could trigger rapid acceleration toward new all-time highs.
Traders, if you liked this idea or if you have your own opinion about it, write in the comments. I will be glad 👩💻

GOLD trending higher: Can buyers push towards 3,350$?Right now OANDA:XAUUSD is a classic case of a market trading within an ascending channel, with price action consistently respecting both its upper and lower borders.
The price has broken above a clear resistance zone and may pull back for a retest. This area also happens to coincide with the golden pocket of the recent swing and so it deserves special attention. If it holds as support, then that would be a confirmation of the bullish structure with the most likely possibility of a move towards 3,350, the middle side of the channel.
As long as the price stays above this support zone, the validity of the bullish setup is still there. If it does not, the short-term bullish outlook would therefore be interrupted and might be followed by further downside pullback.
Be sure to use proper risk management always.

Lingrid | GOLD bullish BREAKOUT from Downward ChannelOANDA:XAUUSD is retesting the broken trendline from above while consolidating just above the key $3,300 level. A successful bounce from this zone could ignite a rally toward the next resistance at $3,382, breaking the recent lower high structure. However, the market remains sensitive to any fake breaks, as seen multiple times in the current structure. Bulls need to defend the trendline to keep the upward momentum alive.
📈 Key Levels
Buy zone: $3,300 – $3,310
Buy trigger: bounce from upward trendline
Target: $3,382
Sell trigger: close below $3,300
💡 Risks
Another fake breakout could trap late buyers.
Bearish rejection from the red resistance trendline may stall upside.
U.S. macro data surprises could inject volatility.
Traders, if you liked this idea or if you have your own opinion about it, write in the comments. I will be glad 👩💻

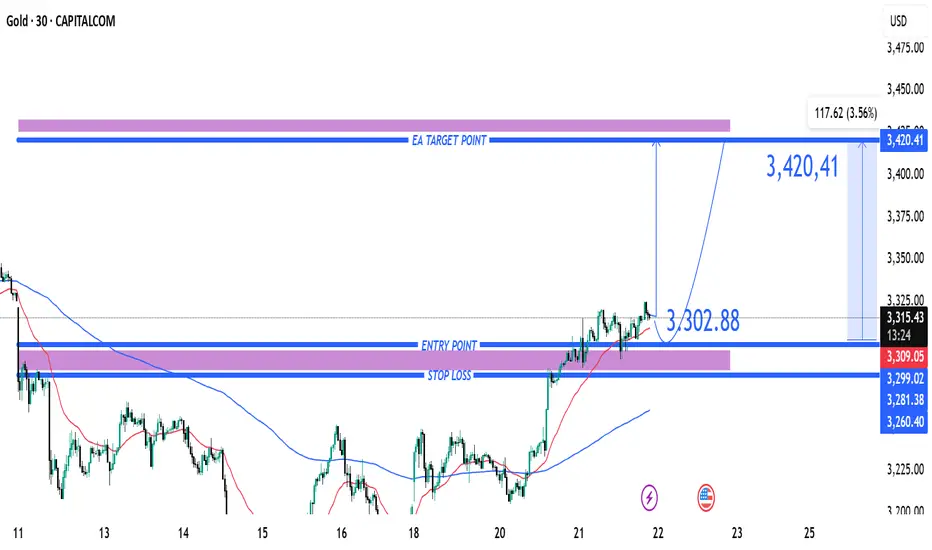
Gold (XAU/USD) Bullish Breakout Trade Setup – Targeting $3,4201. Entry Point Zone (~3,302.88 - 3,317.09):
This is the area where a long position (buy) is suggested.
The price has already moved slightly above this zone, indicating the trade may have already been triggered.
2. Stop Loss (~3,260.41 - 3,299.02):
Positioned below the entry zone to limit downside risk.
Suggests that if the price drops below this support zone, the trade idea is invalidated.
3. Target Point (3,420.41):
A bullish target suggesting a potential upside move of ~117.62 points (or ~3.56%).
This zone acts as a take-profit level.
4. Technical Indicators:
Moving averages (possibly 50 EMA in red and 200 EMA in blue) show a bullish crossover recently, supporting the upward momentum.
5. Pattern Outlook:
The chart implies a possible cup-and-handle or bullish consolidation breakout pattern, anticipating continuation upward.
Summary:
The strategy depicted is a bullish breakout setup:
Buy near 3,302.88–3,317.09
Stop Loss near 3,260–3,299
Take Profit near 3,420
This setup favors buyers as long as the price remains above the stop-loss zone. If the market holds this structure, there's a good risk-reward ratio for a move to 3,420.41.
GOLD → Consolidation (correction) ahead of newsFX:XAUUSD is testing resistance at 3346 and forming a correction, leaving liquidity above the level as the current target. The correction was influenced by the dollar. What can we expect next?
Gold is rising for the fourth day in a row and is approaching $3350, awaiting US PMI data. The dollar remains weak amid geopolitical risks, US-China disputes, and concerns about the US budget. The passage of Trump's tax bill could increase the deficit and pressure on the dollar. Weak PMI data could support gold by heightening expectations of a Fed rate cut
Technically, with the dollar falling, gold has every chance of continuing its rise. But now we are seeing a correction forming. I would say that the relevant areas of interest are 3288 and 0.5 Fibo
Resistance levels: 3346, 3360, 3409
Support levels: 3288, 3275, 3265
As part of the correction, gold may enter a consolidation phase, during which the price will gather liquidity relative to key areas of interest before continuing its growth. A retest and false breakout of 3288 - 3275 is possible before the growth continues.
Best regards, R. Linda!

Hellena | GOLD (4H): LONG to resistance area of 3439.37.Colleagues, Last time, I suggested that the five-wave movement was not yet complete. It seems that this is indeed the case.
Wave "5" of the higher degree is unfolding, and I expect the price to reach the resistance area around 3439.37, which marks the top of wave "X".
Within the smaller five-wave structure, I believe wave "3" is currently in progress.
A correction toward the 3248.38 area is possible.
Manage your capital correctly and competently! Only enter trades based on reliable patterns!

XAU/USD) Bullish reversal analysis Read The ChaptianSMC trading point update
Tchnical analysis for XAU/USD (Gold vs US Dollar) on the 4-hour timeframe, using Smart Money Concepts (SMC). Here's a breakdown of the idea behind this analysis:
---
1. Trend & Structure
The previous downtrend was broken with a change of character (ChoCH), suggesting a possible bullish reversal.
After the ChoCH, the market formed bullish order blocks which have been respected, confirming the bullish sentiment.
---
2. Key Levels
Support level: Around 3,220–3,240 region, coinciding with the 200 EMA, which has acted as dynamic support.
Order blocks: Several yellow zones indicate areas of institutional buying interest.
The most recent "new order block" is closer to the current price, showing a potential short-term demand zone.
---
3. Price Projection
The chart suggests a bullish continuation, projecting a move towards:
Target Point 1: Around 3,350–3,349.50
Target Point 2: Around 3,408–3,407.98
These levels are likely based on prior highs or imbalance zones.
---
4. RSI Indicator
RSI is above 65, showing bullish momentum, but nearing overbought territory (>70), which could signal a short-term pullback before continuation.
---
5. Trade Idea (Visualized Path)
A potential small pullback into the "new order block" around 3,280 is expected.
From there, price may rally to the next supply zones or previous highs, offering a potential gain of ~1.44%.
Mr SMC Trading point
---
Summary of the Idea
This is a bullish continuation setup based on:
Trend reversal via ChoCH.
Strong order block formations.
EMA 200 support.
RSI confirmation.
Traders might look to enter near the new order block (around 3,280), targeting 3,350 and then 3,408, while managing risk below the order block support.
Pleas support boost 🚀 analysis follow K

XAUUSD..gold 4H chart pattern I’m sharing a trading signal or idea for XAU/USD (Gold vs. US Dollar):
• Buy at 3358
• Target: 3500
• Rationale: Expecting price to touch recent highs again
Let me break it down and offer some considerations:
1. Price Context
• 3358 is a very high level for gold — if this is a real-time signal, it’s likely based on a future bullish momentum expectation or perhaps referring to a forecasted level.
• The all-time high for gold (as of mid-2024) was around $2,450. If you mean 3358, it might be a typo or you’re referring to something else like a gold-related index, synthetic pair, or specific contract (e.g., in another currency or leveraged ETF).
2. Technical Analysis Tips
If you’re anticipating a move to 3500, here are a few things traders typically confirm:
• Strong uptrend with no major resistance between 3358 and 3500
• Volume confirmation on bullish candles
• Fundamental backing like economic weakness, high inflation, or geopolitical tension
3. Risk Management
• Entry: 3358
• TP: 3500
• SL: You should have a clearly defined stop loss to manage downside risk — perhaps based on a recent support level (e.g., 3310 or 3280)
• Risk-reward: Make sure the reward (3500-3358 = 142) is at least 2x the risk

Gold (XAU/USD) Bullish Trade Setup – Breakout in ProgressTrend Overview
📈 Uptrend in Progress
Price is moving within an ascending channel:
🔵 Support Line (bottom of channel)
🔺 Resistance Line (top of channel)
Key Levels
Current Price:
● 3,337.53 (📍)
Trade Idea (Long Setup):
🔵 Entry Zone
● 3,306.85 – 3,302.98
(Wait for pullback into this area)
🟦 RBS + RBR ZONE – Previous resistance, now potential support
🔴 Stop Loss
● 3,265.51
💣 Protect your capital below support zone
🎯 Target
● 3,490
🚀 Bullish target based on breakout from channel and momentum
📉 EMA 70:
● 3,282.74 (📉 Red Line)
Helps confirm trend direction. Price above EMA = Bullish bias.
Outlook Summary
✅ Wait for a dip to entry zone
✅ Stop below recent support zone
✅ Target high at 3,490 if breakout continues

Lingrid | GOLD Range RESISTANCE Short SetupThe price perfectly fulfilled my previous idea . OANDA:XAUUSD bounced from the higher low and is now testing the key resistance around 3330, where the downward trendline intersects the prior weekly high (PWH). Price remains within the broader upward channel, but signs of rejection could lead to a retest of the 3215 support area. Bulls must reclaim and hold above the descending trendline to regain control. A failure here would confirm another lower high and open downside risk.
📈 Key Levels
Buy zone: 3215 – 3230
Buy trigger: breakout above 3330 and trendline retest
Target: 3494
Sell trigger: rejection from 3330 resistance
💡 Risks
Macro catalysts (FOMC, CPI) could trigger volatility.
Repeated failure to reclaim trendline may deepen bearish pressure.
Higher low remains valid unless 3215 breaks decisively.
Traders, if you liked this idea or if you have your own opinion about it, write in the comments. I will be glad 👩💻

Will Trump's Tariffs Propel Gold Past 3,500 ? Again ? On May 23rd's U.S. trading session, Trump's tariff announcements on the EU and Apple roiled markets like a tempest 🌪️. He proposed a staggering 50% tariff on EU products starting from June 1st, citing unfair trade practices. Meanwhile, he threatened Apple with a 25% tariff if iPhones sold in the U.S. weren't manufactured domestically.
This sent gold prices soaring sky - high 🚀. As a reliable safe - haven, gold spiked as investors, deeply worried about the potential global economic impacts, rushed to safeguard their wealth. The 3280 support level for gold, which had been holding firm in the preceding days, became even more crucial as the upward momentum strengthened, like a sturdy anchor in stormy waters ⚓.
If the tariff issue remains unresolved and tensions continue to simmer between the U.S., the EU, and major corporations like Apple, the upward trajectory of gold prices is likely to persist. Analysts predict a good chance it could break the 3,500 mark, as if a new peak is waiting to be conquered 🏔️. Tariffs disrupt global supply chains and raise U.S. inflation fears, driving investors to gold for protection against economic and currency risks, much like sailors seeking a safe port in a typhoon 🌊.
⚡️⚡️⚡️ XAUUSD ⚡️⚡️⚡️
🚀 Buy@ 3340 - 3360
🚀 TP 3400 - 3450
Accurate signals are updated every day 📈 If you encounter any problems during trading, these signals can serve as your reliable guide 🧭 Feel free to refer to them! I sincerely hope they'll be of great help to you 🌟 👇

Lingrid | GOLD Potential Near-Term BULLISH MomentumOANDA:XAUUSD is attempting to stabilize just above the $3,208 zone after forming a lower low inside the downward channel. Price is compressing between the support base and descending trendline, signaling potential for breakout if buyers reclaim $3,225. A successful retest and push above this level could trigger a rally toward $3,285. Bulls will likely remain in charge if the structure holds above $3,208.
📈 Key Levels
Buy zone: 3,208 – 3,225
Buy trigger: breakout and hold above descending trendline
Target: 3,285
Sell trigger: drop below 3,208
💡 Risks
Fed comments or rate surprises may jolt gold direction.
Sharp rebound in USD could undermine gold recovery.
Rejection from trendline may resume the bearish structure.
Traders, if you liked this idea or if you have your own opinion about it, write in the comments. I will be glad 👩💻

XAUUSD[GOLD]: Bearish Correction Is Happening! Gold rejected at 3350, dropping almost 600 pips to 3290. We can expect the price to drop further to around 3250, potentially reversing from there. A possible entry point is 3304, followed by a drop from there.
If you’d like to contribute, here are a few ways you can assist us:
- Like our ideas
- Comment on our ideas
- Share our ideas
Team Setupsfx_🚀❤️

Gold: Bullish Flag Formation Suggests Further Upside Potential Hello guys, let's dive into Gold analysis!
Gold is currently forming a bullish flag pattern, a continuation formation that typically follows a strong upward impulse (flagpole). After a sharp rally, the price consolidated within a downward channel, creating the classic flag structure.
🔍 Technical Breakdown:
Flagpole: The strong bullish rally in early April marks the beginning of the uptrend.
Flag (Channel): Price has corrected in a downward-sloping channel, respecting both upper and lower bounds, creating a textbook flag pattern.
Breakout Zone: Price is now testing the upper boundary of the flag. A confirmed breakout above this resistance would signal a continuation of the prior uptrend.
🎯 Price Targets:
First Target: Around $3,445, which aligns with the measured move from the breakout point.
Second Target: Around $3,725, representing full flagpole projection from the breakout zone.
📌 Key Levels to Watch:
Breakout Confirmation: A strong 4H close above the flag’s upper boundary (~$3,260) with volume confirmation would validate the pattern.
_____________________________________
Invalidation: A rejection from the resistance and a fall below the channel may delay the bullish scenario, potentially retesting lower support around $3,090.
📊 Conclusion:
This setup favors bulls, but patience is key. Traders may consider waiting for a clear breakout and retest for safer long entries, aiming for the outlined targets.

GOLD → Correction before possible growthFX:XAUUSD entered a liquidation phase (rally) within the trading range at the opening of the session. The dollar's rise is to blame. The focus is on supporting consolidation...
Investors remain interested in gold as a safe haven asset amid geopolitical risks and declining demand for US assets.
The key drivers remain news about tax reform in the US, trade negotiations, and upcoming macro data.
Gold is consolidating, but since the opening of the session, the price has been heading towards support. Against the backdrop of an upward trend, a trigger for bearish liquidity is likely to form before growth.
Against the backdrop of the dollar's growth, gold is entering a correction phase. At the moment, all attention is on support and the liquidity zone of 3265. A false breakdown will trigger a price buyback.
Resistance levels: 3322
Support levels: 3282, 3265
Since the price is still within the range and a countertrend correction is forming in the market, in our case, it is worth considering an intraband trading strategy. A false breakdown of support could trigger growth to intermediate resistance or to the upper border of the channel.
Best regards, R. Linda!

Automate Gold Trading with Machine Learning and LLMS: FULL Guide🚀 Harnessing Machine Learning and Large Language Models (LLMs) to Automate Gold Trading: A Practical Guide
Gold 🥇 has long been considered a safe-haven asset and a cornerstone of investment portfolios worldwide. The advent of advanced technologies like machine learning (ML) 🤖 and large language models (LLMs) 🧠 has opened new avenues for automating gold trading, enhancing accuracy, and improving profitability.
🌟 Why Automate Gold Trading with ML and LLMs?
Machine learning algorithms excel at detecting complex patterns, analyzing vast amounts of market data swiftly, and predicting price movements more reliably than traditional methods. LLMs, such as GPT-4, further augment trading strategies by interpreting news sentiment, macroeconomic data, and global geopolitical events in real-time, offering nuanced insights into gold market movements.
🛠️ Step-by-Step Practical Implementation
1. 📊 Data Acquisition and Preparation:
Historical gold price data (open, close, high, low).
Economic indicators: inflation rates 📈, currency valuations (USD strength 💵), and interest rates 📉.
News sentiment analysis 📰 derived from financial headlines using GPT-4.
Example Application:
Use APIs like Alpha Vantage or Yahoo Finance to pull historical gold prices.
Integrate financial news from Bloomberg or Reuters and summarize sentiments using GPT-4 API.
2. 🎯 Choosing the Right ML Model:
Time Series Forecasting Models: LSTM ⏳ (Long Short-Term Memory), GRU 🔄 (Gated Recurrent Units).
Classification Models: Random Forest 🌳, Gradient Boosting Machines (GBM), and XGBoost 🚀 for predicting upward/downward price movements.
Example Application:
Use Python libraries such as TensorFlow, Keras, and XGBoost to build and train these models.
Predict price changes for the next trading session to make informed entry and exit decisions.
3. 🤖 Integrating Large Language Models (LLMs):
Employ GPT-4 or similar LLMs to perform real-time sentiment analysis on financial news.
Translate sentiment results into numerical signals (e.g., +1 positive, 0 neutral, -1 negative).
Example Application:
Daily analyze major news headlines related to gold using GPT-4 to capture market sentiment.
Incorporate these signals into your ML model to refine price movement predictions.
4. 📈 Training and Validation:
Train models on historical datasets using cross-validation to prevent overfitting.
Optimize parameters using genetic algorithms 🧬 or grid search techniques.
Example Application:
Use scikit-learn’s GridSearchCV or genetic algorithms in libraries like DEAP for parameter tuning.
5. ⚙️ Automating Trades with Expert Advisors (EA) on MetaTrader 5:
Integrate ML and LLM-derived signals into MetaTrader 5 Expert Advisors.
Implement position-sizing logic, risk management, and automatic lot scaling.
Example Application:
Write custom MQL5 scripts that execute trades based on ML model predictions and sentiment analysis outputs.
Dynamically adjust position size based on account equity and market volatility.
🛡️ Practical Considerations for Robustness
Risk Management: Always integrate dynamic stop-losses 🛑, trailing stops, and overall account-level risk management.
Flat Market Detection: Employ advanced techniques like Hurst Exponent, ADX/DMI compression, or Bollinger Band squeezes 🔍.
Continuous Optimization: Regularly retrain models and update sentiment analysis parameters.
🌐 Benefits of Combining ML and LLMs
Enhanced predictive accuracy 📈 through combined numerical and textual data analysis.
Improved adaptability 🔄 in dynamic market conditions.
Reduced emotional bias 😌 and human errors in trading.
⚠️ Challenges and Solutions
Data Quality and Overfitting: Rigorous preprocessing and cross-validation.
Market Regime Shifts: Continuous monitoring and periodic recalibration of models.
📌 Real-World Application Examples
Example 1:
Combine sentiment analysis with price data to predict significant market movements around economic announcements (e.g., Fed rate decisions).
Example 2:
Deploy an ML-driven EA on MetaTrader 5, adjusting positions based on both predictive analytics and real-time news sentiment shifts, significantly improving trade timing and results.
Example 3:
Use an adaptive ML model that retrains weekly with the latest market data, ensuring the trading algorithm remains relevant to current market conditions.
🎉 Conclusion
Automating gold trading using machine learning and LLMs presents an exciting frontier for traders. By leveraging these technologies, traders can significantly enhance decision-making, effectively manage risk, and achieve consistent profitability. The future of gold trading automation lies in blending cutting-edge algorithms with insightful real-time analysis, making now the perfect time to integrate ML and LLMs into your trading toolkit. 🥇🤖💹

GOLD → Breaking of the downward trend structure...FX:XAUUSD is breaking out of the downward price channel and heading towards the zone of interest at 3346. A false breakout of resistance could trigger a correction before growth continues.
Gold is rising for the third day in a row and trading above $3,300 amid a weakening dollar and heightened geopolitical tensions. Investors are seeking refuge due to concerns about US fiscal policy, trade disputes with China, and a possible Israeli strike on Iran. Gold is also supported by expectations of a Fed rate cut and weak prospects for the dollar.
Technically, the price is heading towards the order block and resistance at 3345-3360. Since the opening of the session, the price has exhausted all its potential, and a retest of the key level may end in a false breakout and correction. However, based on the fundamental background, gold's growth may continue after the correction...
Resistance levels: 3346, 3360, 3409
Support levels: 3288, 3265, 3245
Gold has returned to the buy zone, but the fundamental background is unstable, and any weakening of economic risks could send gold back south. At the moment, the focus is on 3346-3360, with a false breakout likely to trigger a correction.
Best regards, R. Linda!

GOLD → Consolidation. Retest of support before growthFX:XAUUSD is strengthening due to a complex fundamental backdrop. A false break of support at 3285 allows the price to update its local high to 3365.
Gold fell moderately from a high of $3365 amid weak activity due to holidays in the US, despite the weak dollar. Investors are taking profits ahead of US inflation data.
Pressure is also linked to hopes for a trade agreement between the US and Japan. However, the decline in prices is limited — geopolitical tensions, US budget problems, and instability in the Middle East are keeping demand for gold as a safe-haven asset.
Support levels: 3321, 3308, 3300
Resistance levels: 3363
Technically, gold is making a false breakout of consolidation resistance and is entering a correction phase, during which the price may test liquidity below 3320-3303 before continuing to rise.
Best regards, R. Linda!

Gold may break resistance level and then continue to growHello traders, I want share with you my opinion about Gold. In this chart, price previously formed a clear triangle pattern, where price was squeezed between two converging trend lines. After a period of consolidation, the market broke above this formation, reaching the resistance zone near 3365, but then started to retrace. Following that breakout, a new structure emerged, an upward wedge. The asset has been moving within this narrowing channel, forming higher lows and approaching the upper boundary with weakening momentum. This type of pattern often signals an upcoming strong move once the price breaks out from either side. Currently, Gold is trading near the resistance line of the wedge and just beneath the seller zone. I expect that the price may fall back to the support line of the wedge around the 3205 - 3185 area. After that, a bounce from this zone could trigger a bullish breakout from the wedge. That’s why I set my TP 1 at the 3420 level, this target aligns with a full wedge breakout and continuation of the upward movement through the resistance level and beyond the seller zone. Please share this idea with your friends and click Boost 🚀
Disclaimer: As part of ThinkMarkets’ Influencer Program, I am sponsored to share and publish their charts in my analysis.

THE KOG REPORT Bank Holiday tomorrow so we'll keep it simple and update the KOG Report on Tuesday ready for the week ahead. Please have a look at the last few KOG Reports to see how it went, wasn't a bad week at all.
This week, immediate red boxes are on the chart, there is a red box active above and the indicator is suggesting a potential retracement on the move. So we'll look for price to attempt the high, if failed we can expect the move downside into the order region where we may settle.
RED BOXES:
Break above 3365 for 3370, 3376, 3381, 3390 and 3403 in extension of the move
Break below 3350 for 3343, 3335, 3330, 3323 and 3310 in extension of the move
Please do support us by hitting the like button, leaving a comment, and giving us a follow. We’ve been doing this for a long time now providing traders with in-depth free analysis on Gold, so your likes and comments are very much appreciated.
As always, trade safe.
KOG

XAUUSD.. gold 4H charts pattern I'm outlining a short (SELL) trade setup for XAU/USD (Gold). Here's a breakdown of your trade idea:
Entry: 3308 (SELL)
First Target (FVG): 3250
(FVG likely refers to a Fair Value Gap – a liquidity target in imbalanced price zones)
Final Target: 3140
Let’s assess the setup:
Key Points to Consider:
1. Risk Management:
Have you set a stop-loss? For this short, a logical SL might be above recent highs or structure – perhaps around 3330–3340.
Position sizing is critical depending on account size and risk tolerance.
2. Market Context:
Is this based on a higher time frame imbalance, a bearish trend continuation, or news catalyst?
Are you following a liquidity sweep strategy or reacting to a key resistance rejection?
3. Technical Confirmation:
Confirmation from order blocks, bearish divergence, or break of market structure (BOS) could strengthen your setup.
Would you like me to:
Analyze the chart if you provide a screenshot?
Provide a technical breakdown of current XAUUSD levels?
Help calculate risk-to-reward or position size for this trade?
Let me know how you'd like to proceed.

GOLD 1H CHART ROUTE MAP UPDATE & TRADING PLAN FOR THE WEEKHey Everyone,
Please see our updated 1h chart levels and targets for the coming week.
We are seeing price play between two weighted levels with a gap above at 3389 and a gap below at 3352. We will need to see ema5 cross and lock on either weighted level to determine the next range.
We will see levels tested side by side until one of the weighted levels break and lock to confirm direction for the next range.
We will keep the above in mind when taking buys from dips. Our updated levels and weighted levels will allow us to track the movement down and then catch bounces up.
We will continue to buy dips using our support levels taking 20 to 40 pips. As stated before each of our level structures give 20 to 40 pip bounces, which is enough for a nice entry and exit. If you back test the levels we shared every week for the past 24 months, you can see how effectively they were used to trade with or against short/mid term swings and trends.
The swing range give bigger bounces then our weighted levels that's the difference between weighted levels and swing ranges.
BULLISH TARGET
3389
EMA5 CROSS AND LOCK ABOVE 3389 WILL OPEN THE FOLLOWING BULLISH TARGETS
3428
EMA5 CROSS AND LOCK ABOVE 3428 WILL OPEN THE FOLLOWING BULLISH TARGET
3478
EMA5 CROSS AND LOCK ABOVE 3478 WILL OPEN THE FOLLOWING BULLISH TARGET
3517
BEARISH TARGETS
3352
EMA5 CROSS AND LOCK BELOW 3352 WILL OPEN THE FOLLOWING BEARISH TARGET
3317
EMA5 CROSS AND LOCK BELOW 3317 WILL OPEN THE FOLLOWING BEARISH TARGET
3282
EMA5 CROSS AND LOCK BELOW 3282 WILL OPEN THE FOLLOWING BEARISH TARGET
3233
EMA5 CROSS AND LOCK BELOW 3233 WILL OPEN THE SWING RANGE
3185
3146
As always, we will keep you all updated with regular updates throughout the week and how we manage the active ideas and setups. Thank you all for your likes, comments and follows, we really appreciate it!
Mr Gold
GoldViewFX
