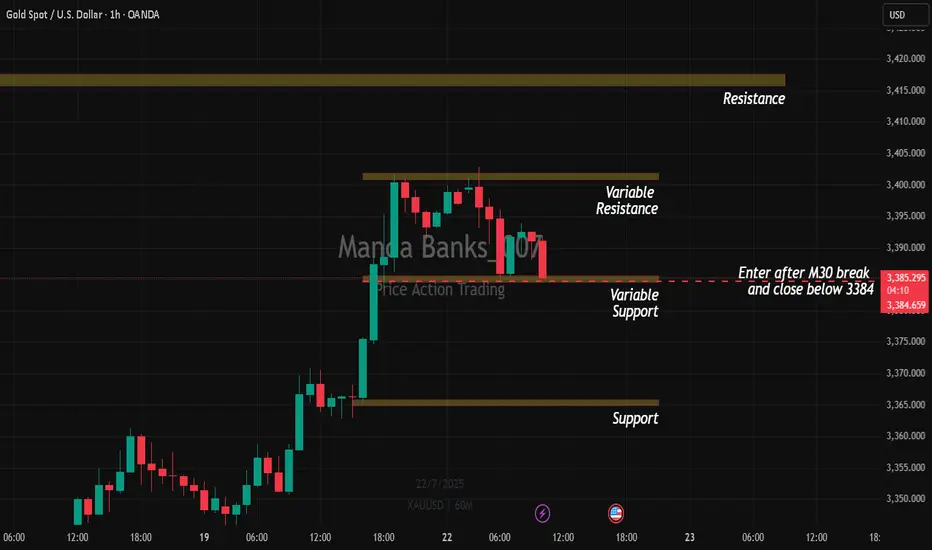
Impulse Sells on Gold/ Pre-London SetupI'll take a sell on Gold if price break and close below 3384.
It's simple price action strategic entry based on volume in Pre-London Session.
1st TP always 15-25 pips.
Manage risk dynamically by trailing SL to the high of the previous candle high.
XAUUSD trade ideas
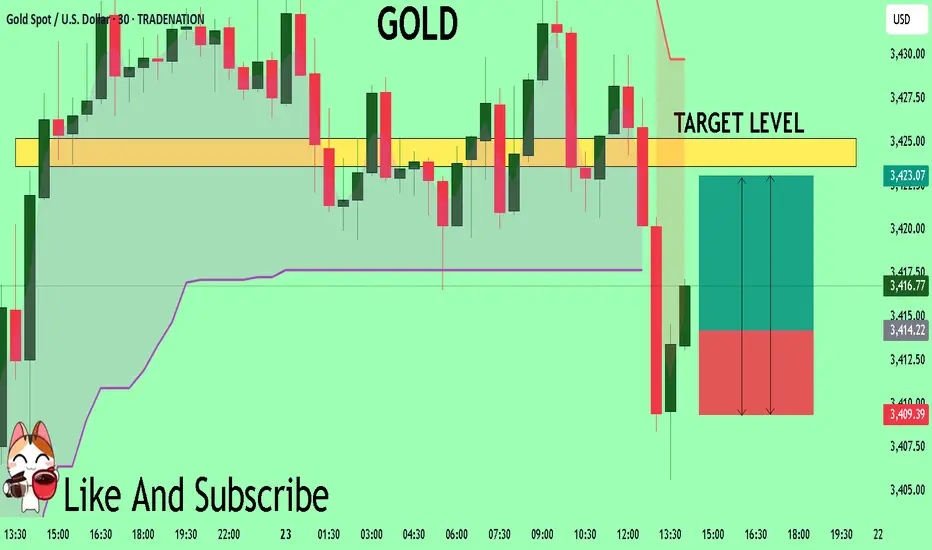
GOLD The Target Is UP! BUY!
My dear friends,
Please, find my technical outlook for GOLD below:
The price is coiling around a solid key level - 3414.2
Bias - Bullish
Technical Indicators: Pivot Points Low anticipates a potential price reversal.
Super trend shows a clear buy, giving a perfect indicators' convergence.
Goal - 3423.6
Safe Stop Loss - 3409.3
About Used Indicators:
The pivot point itself is simply the average of the high, low and closing prices from the previous trading day.
Disclosure: I am part of Trade Nation's Influencer program and receive a monthly fee for using their TradingView charts in my analysis.
———————————
WISH YOU ALL LUCK
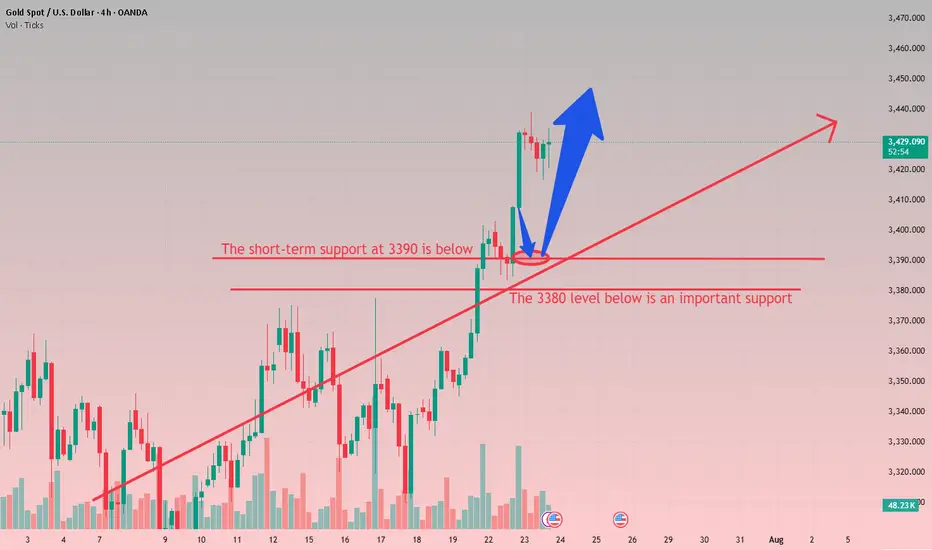
Don't chase gold at high levels, buy more when it falls back to From the 4-hour analysis, today's support is around 3400-10. If the intraday retracement relies on this position, the main bullish trend remains unchanged. The short-term bullish strong dividing line focuses on the 3380 mark. If the daily level stabilizes above this position, the rhythm of retracement will continue. Short positions against the trend should be cautious.
Gold operation strategy:
Gold retracement to 3400-10 line to go long, retracement to 3390-95 line to cover long positions, stop loss 3379, target 3435-3440 line, continue to hold if it breaks;
Is Smart Money Selling Gold? A VSA LookHey Traders,
Let's take a look at the Gold (XAU/USD) 1-hour chart using Volume Spread Analysis (VSA). The price made a strong run-up to a new high around $3,438, but the volume is telling us a story of potential weakness.
Here’s a simple breakdown of what I'm seeing.
The Trap at the Top (Signs of Weakness)
Think of the market as being moved by "smart money" (professionals) and "herd money" (the crowd).
Climax Volume: See that huge volume spike right at the peak on July 23rd? While it looks like strong buying, this is often a classic sign of a Buying Climax. This is where smart money starts selling their positions to the excited crowd who are buying at the top, fearing they'll miss out.
No Real Buyers Left: After the peak, notice how the price tried to push higher a few times but on much lower volume? This is a "No Demand" signal. It’s like a car trying to rev its engine, but it's out of gas. It shows there isn't enough buying power to push the price any higher.
Sellers Take Control: As the price started to fall from the top, look at the volume on the down bars. It got bigger. This tells us that supply (selling pressure) is now in control, and they are pushing the price down with force.
Where Are We Now?
The price has dropped and is now hovering around the $3,330 area. The volume has dried up for now, which means the market is taking a pause and deciding where to go next.
What to Watch For Next
Based on the VSA story, here are two possible scenarios:
Scenario 1 (Bearish 📉): The weakness continues. If we see the price try to rally from here but the volume is very low, it would be another major red flag. It would suggest sellers are still in control, and we could see a break below the recent low of $3,320 for another leg down.
Scenario 2 (Bullish 📈): This is a bear trap. For this to happen, we would need to see a strong sign of buying returning. For example, a sharp drop on massive volume that is quickly bought back up. This would signal that the sellers have been absorbed and smart money is starting to buy again.
Conclusion:
For now, the evidence points more towards weakness. The action at the top suggests that smart money was distributing (selling) their gold.
Key Takeaway: Be cautious of any weak-looking bounces. The sellers appear to have the upper hand until we see a clear sign of strength with high buying volume.
This is not financial advice. This is just my interpretation of the chart using VSA. Always do your own research and manage your risk. Good luck trading!

XAUUSD BUYS EXPECTATIONS I'm expecting buys from the marked demand zone(OB) as indicated from the graph above... Who is in ☝🏾 let me see your hands up 😎

Gold could be an changing hand area False break for cemeterycal triangle. Could lead to to start a down trend for a medterm investment
Gold Elliott Wave Bearish SetupGold 8H Analysis:
The chart shows a potential Elliott Wave pattern completing its 5th wave. After hitting resistance near 3383, price reversed at point (4) and is projected to drop toward the support zone near 3281. Bearish momentum expected.

THE KOG REPORT - UpdateEnd of day update from us here at KOG:
That was a difficult move to capture! I would not blame anyone for getting frustrated and FOMO'ing. Thankfully, we stuck to our guns, price was manipulated but our targets are completed as is the move we highlighted on Sundays KOG Report. I even say here and thought what on earth are they doing, but, we gave a level of 3318 as the line in the sand, we bounced before that and BOOM, all Excalibur targets completed in one go.
Now, we have support below at the 3340-45 level which is where they may settle for the session, above 3340 we're still likely to see a retest of the level, however, we said there is a curveball this week, and look at what is happening. Can't remember the last time I saw price action this bad!
Price: 3337
RED BOXES:
Break above 3350 for 3355✅, 3362✅, 3370✅ and 3376✅ in extension of the move
Break below 3335 for 3330✅, 3322✅, 3320✅ and 3314 in extension of the move
As always, trade safe
KOG

$XAUUSD: Macro InterconnectionsResearch Notes
Linking historic surface area and coordinates of consistent geometric expressions to document and learn more about the "texture" of self-organizing processes. The topology assumes that current price is a result of all history together that took to make the price end up where it is.
The fastest shortcut to figure out fractal hierarchy of waves and general direction is through Fractal wave marker .
Since angle of highs cycle is broken and price stayed above it for long time. That means it would be better to strip the chart starting from the lower levels, in order to get better coordinates for structural basis.
FWM helps to spot that distinctive part of broken waves that enables visual orientation in the rhythm. They manifest in its closest formative across cycles.
The angle that links the pattern through the time can have deterministic property, therefore we can use that direction for fibonacci channels to fill the gaps.
The fact that on log scale the bits from bullish phase of cycles contracted on price scale, I'd orientate with thin fibonacci channels (that is based on angle of lows of macro-cycle applied to previous ATH.
There are some other interconnection that are being tested.

XAUUSD 4H Golden Cross preparing a massive break-out.Gold (XAUUSD) has been trading on a 3-week Channel Up, which is approaching its top but at the same time, it's been trading within a 3-month Triangle, which is also approaching its top.
The key here is the formation today of a Golden Cross on the 4H time-frame, the first since May 28. Being at the end of the long-term Triangle pattern is technically translated to the structure's tendency to look for a decisive break-out above its top that attracts volume (buyers).
It is possible to see an initial rejection followed by a break-out that will re-test the top of the Triangle as Support and then follow the long-term trend dynamics. Those are technically bullish and previous break-out in April targeted the 2.618 Fibonacci extension. Our Target remains a little below it at $3770.
-------------------------------------------------------------------------------
** Please LIKE 👍, FOLLOW ✅, SHARE 🙌 and COMMENT ✍ if you enjoy this idea! Also share your ideas and charts in the comments section below! This is best way to keep it relevant, support us, keep the content here free and allow the idea to reach as many people as possible. **
-------------------------------------------------------------------------------
Disclosure: I am part of Trade Nation's Influencer program and receive a monthly fee for using their TradingView charts in my analysis.
💸💸💸💸💸💸
👇 👇 👇 👇 👇 👇

Gold Eyes 3365 – Breakout or Rejection?GOLD | Technical Outlook
Gold maintains bullish momentum as long as it trades above 3355, aiming to test the 3365 resistance level.
However, signs of rejection at 3365 may emerge, especially if the 4H candle closes below this level. In that case, expect a period of sideways consolidation between 3365 and 3342.
A confirmed 1H candle close above 3365 would signal bullish continuation toward 3373, with an extended target at 3395.
Key Levels:
• Pivot: 3355
• Resistance: 3365 / 3375 / 3395
• Support: 3342 / 3333
Outlook:
• Bullish above 3355
• Breakout above 3365 confirms further upside
• Rejection at 3365 may lead to short-term range-bound movement

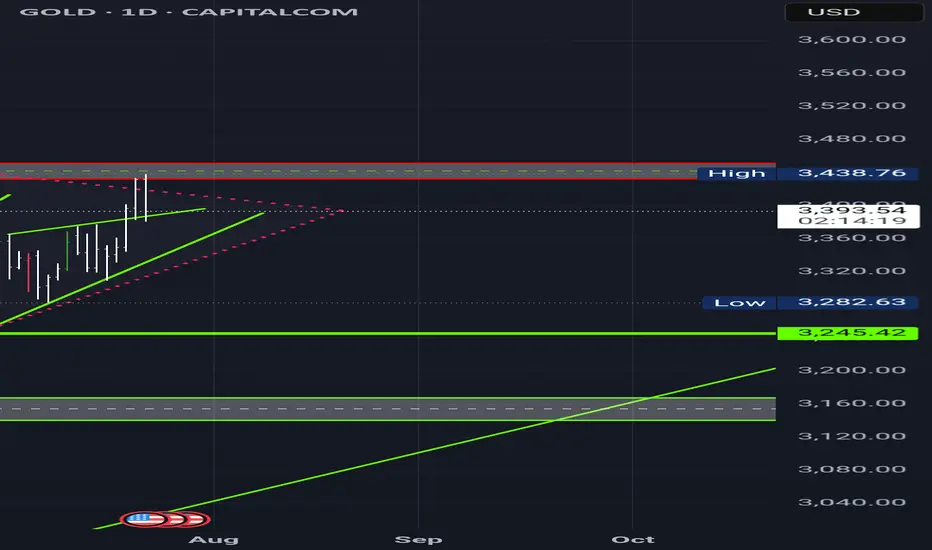
Gold (XAU/USD) Market Outlook – July 2025Gold continues to trade at historically elevated levels around $3,352 as of mid-July 2025, representing a significant breakout from previous resistance zones. This price action reflects strong institutional demand amid global economic uncertainty and strategic shifts in monetary policy.
Fundamental Market Forces
Monetary Policy Environment
The Federal Reserve is positioned to begin its easing cycle in Q3 2025, with the first rate cut anticipated as inflationary pressures subside and employment data shows cooling trends. This dovish pivot has substantially weakened real yields and diminished the opportunity cost of holding gold.
Currency and Bond Market Dynamics
The U.S. Dollar Index has retreated from 106 to below 102, creating a favorable backdrop for dollar-denominated commodities. Simultaneously, real 10-year Treasury yields are approaching zero, eliminating the yield disadvantage traditionally associated with gold investments.
Risk Environment
Persistent geopolitical tensions across multiple regions—including the Taiwan Strait and Middle East—alongside energy market volatility have reinforced gold's role as a premier safe-haven asset. Additionally, concerns over long-term currency debasement continue to drive hedge fund and institutional allocation.
Technical Market Structure
Current Trading Dynamics
Price Level: $3,352 (July 18, 2025)
Critical Support Zones
• $3,300: Immediate support representing psychological significance and recent consolidation floor
• $3,245: Key breakout level from late June that now serves as major support
• $3,180: 50-day exponential moving average confluence zone
• $3,095: Fibonacci retracement level and structural support from early June
Resistance Targets
• $3,390: Near-term resistance marking the upper boundary of July's trading range
• $3,450: Extension target based on current momentum patterns
• $3,500+: Psychological milestone and potential breakout objective
Technical Indicators Assessment
• Relative Strength Index: Currently 66-70, indicating mild overbought conditions without signaling immediate reversal risk
• MACD: Displaying bullish crossover with sustained upward momentum
• Moving Average Structure: All key EMAs (20/50/100-day) maintain upward trajectory, confirming strong bullish trend
Trading Outlook for July 2025
Projected Range: 3,245−3,450
Support Zone: 3,245 - 3,300
Resistance Zone: 3,390-3450+
Strategic Assessment
Gold maintains a robust bullish framework with any price declines likely to attract buying
interest, barring unexpected Federal Reserve hawkishness or significant geopolitical deescalation. The combination of accommodative monetary policy expectations, currency weakness, and sustained institutional demand creates a favorable environment for continued gold appreciation through the remainder of July 2025.
Gold prices fall in the short term – What's next?Hello everyone, what’s your take on gold?
Today, gold continues to attract short-term selling pressure as USD buying momentum returns and expectations for Fed rate cuts diminish. On the other hand, an overall positive risk sentiment is also seen as another factor weighing on the precious metal.
At the time of writing, gold is trading around the EMA 34 and 89 near 3,336 USD. With no major updates expected, the market is likely to remain steady throughout the day.
From a technical perspective, the bearish trend persists, with prices capped below the trendline. A series of lower highs and lower lows could push XAUUSD to retest deeper levels, potentially reaching the 3,300 USD mark. However, lingering trade uncertainties may limit losses for this safe-haven asset.
This is just my view on the market, not financial advice.

XAUUSD Analysis Of next waveSo the Analysis of gold is that if 3343-3345 holds we can travel to 3392-3388 as mentioned there the wave completion target is there

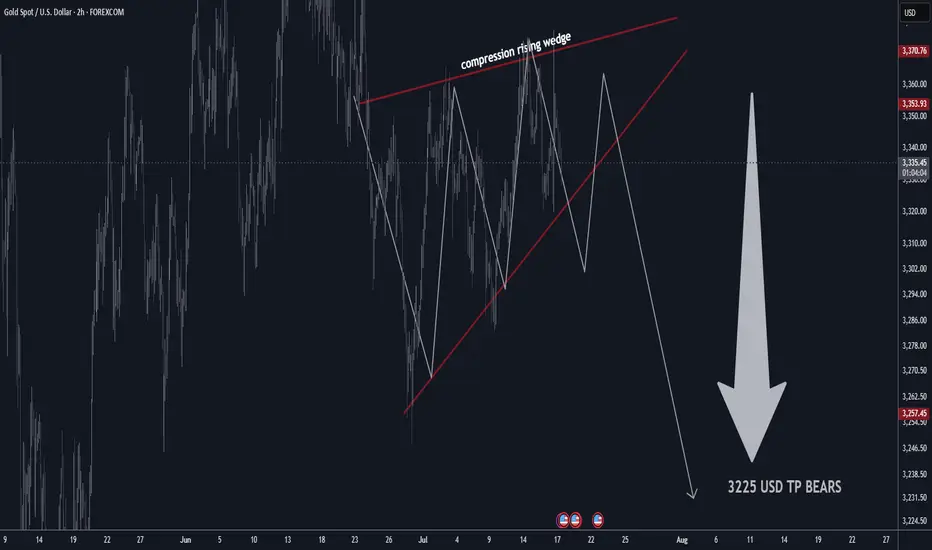
GOLD H2 Rising Wedge Expecting SellOFF TP BEARS 3225 USD📊 Gold Technical Outlook Update – H4 & 2H Chart
📰 Latest Summary Headlines
• Gold stalls near highs as technical compression signals possible breakdown
• Bearish rising wedge on 2-hour chart hints at sharp move lower
• Market volatility stays elevated amid global economic risks
• Short-term sellers targeting $3,225 if wedge pattern breaks
________________________________________
🏆 Market Overview
• Gold remains in a choppy range, struggling to clear key resistance.
• 2H Chart: Bearish rising wedge pattern identified, showing compression—expecting a potential breakdown soon.
• Overhead resistances: $3,410 / $3,460 USD will likely cap further upside.
• Major supports: $3,160 / $3,240 USD.
• If support fails, next key bear target is $3,225 USD.
• Range trading remains favored for now.
• Volatility likely to persist with no major bullish headlines on the horizon.
________________________________________
⭐️ Recommended Trade Strategy
• Bearish Setup (2H): Short sell gold at market on wedge breakdown.
o Stop loss: Above recent highs (set according to your risk tolerance and latest 2H swing high).
o Take profit: Target $3,225 USD.
• Continue to focus on selling near resistance, buying near support.
• Momentum: Watch for sharp moves as wedge resolves—be nimble!
• Always manage risk and adjust stop as price develops.
________________________________________
💡 Gold Market Highlights
• Safe-haven demand still strong due to tariffs, geopolitical tension, and U.S. fiscal concerns.
• Central banks & investors remain net buyers, but jewelry demand slides at high prices.
• Price action is dominated by institutional flows, with banks forecasting potential for gold above $4,000 next year—but short-term correction likely if wedge breaks.
• Current price: ~$3,358 per ounce. Compression suggests a larger move coming soon.
________________________________________
Summary:
Gold is at a crossroads, with a bearish wedge pattern building on the 2-hour chart. A breakdown could see a quick move to $3,225. Short sellers should act on confirmation, while bulls will look to reload at key support. Stay tactical!
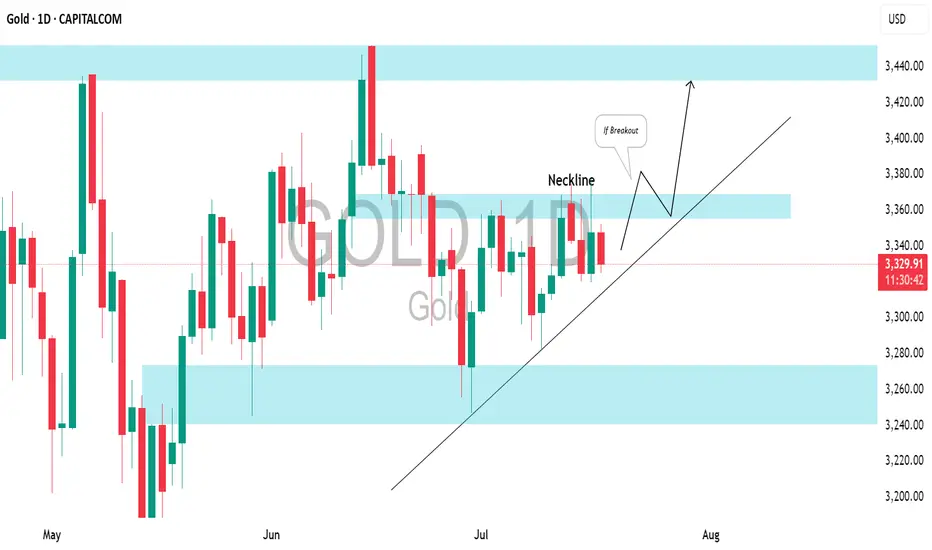
GOLD (XAUUSD): Bullish Accumulation PatternI spotted a clear ascending triangle pattern on a daily time frame.
To validate a bullish continuation, we need a breakout above the neckline.
A daily candle close above 3370 will serve as a strong confirmation, and we can expect a move up to at least the 3440 resistance level.
Waiting for the Break: 3375 or 3320 Will Decide the Next 1k Pips📉 Quick recap:
As you know, I've been bullish on Gold. However, as explained in yesterday’s analysis, I started to approach this view with more caution. Unfortunately, I closed my long position at break even… before the rally to the 3375 resistance. That’s trading.
📌 What now?
Despite missing that move, the market is beginning to offer more clarity. There are now two key levels that will likely define the next major swing:
________________________________________
🔹 1. Resistance at 3375 – Top of the Range / Triangle Breakout Zone
• This level marks the upper boundary of the recent range
• It’s also the resistance of a developing ascending triangle
• A clean breakout above 3375 would confirm the pattern and could trigger a strong upside acceleration
• Target: 3450 zone, with potential for more if momentum kicks in (approx. 1000 pips higher)
➡️ This is the obvious bullish scenario – in line with the broader trend and classical technical setup.
________________________________________
🔻 2. Support at 3320 – The Less Obvious, but Classic Gold
• 3320 is now a confluence support area
• Technically, a break below here is less probable – but Gold has a habit of doing the unexpected
• If 3320 breaks, bears could look for a first leg to 3280 (approx. 400 pips), and very probably 3250 (around 700 pips drop)
➡️ This bearish scenario is not the base case, but it must not be ignored. Sometimes the trap is in the obvious.
________________________________________
🧭 Trading Plan:
For now, I’m out of the market, patiently waiting for confirmation. I’ll trade the breakout – whichever side gives the signal first.
________________________________________
📌 Conclusion:
Gold is coiling for a larger move. The levels are clear: 3375 and 3320 are the doors. One of them will open. Until then, we wait and prepare. 🚀
Disclosure: I am part of TradeNation's Influencer program and receive a monthly fee for using their TradingView charts in my analyses and educational articles.

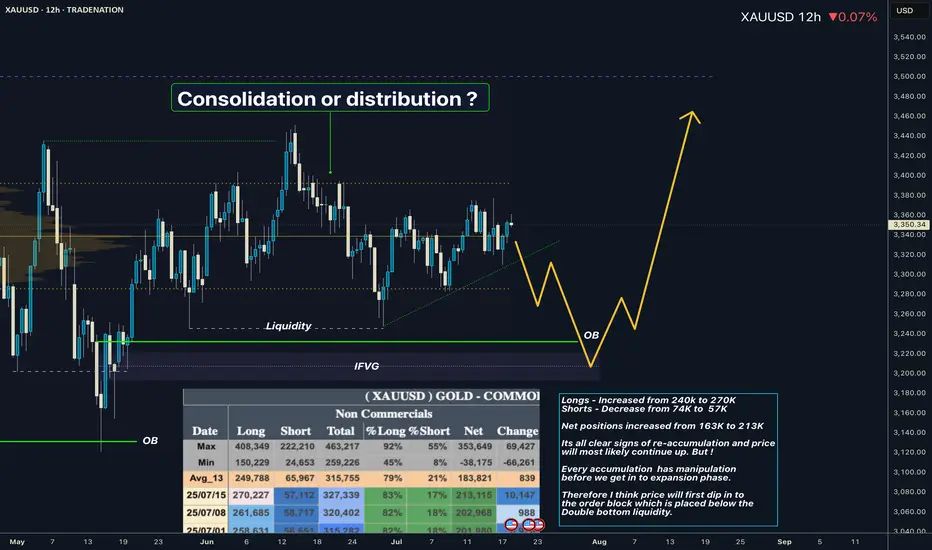
XAUUSD I Whats playing out in the range? COT overviewHey what up traders welcome to the COT data and Liquidity report. It's always good to go with those who move the market here is what I see in their cards. I share my COT - order flow views every weekend.
🎯 Non Commercials added significant longs and closed shorts at the same time. So for that reason I see the highs as a liquidity for their longs profits taking.
📍Please be aware that institutions report data to the SEC on Tuesdays and data are reported on Fridays - so again we as retail traders have disadvantage, but there is possibility to read between the lines. Remember in the report is what they want you to see, that's why mostly price reverse on Wednesday after the report so their cards are hidden as long as possible. However if the trend is running you can read it and use for your advantage.
💊 Tip
if the level has confluence with the high volume on COT it can be strong support / Resistance.
👍 Hit like if you find this analysis helpful, and don't hesitate to comment with your opinions, charts or any questions.
Analysis done on the Tradenation Charts
Disclosure: I am part of Trade Nation's Influencer program and receive a monthly fee for using their TradingView charts in my analysis.
"Adapt what is useful, reject what is useless, and add what is specifically your own."
— David Perk aka Dave FX Hunter ⚔️
Gold Approaching a Key Support, Potential Long OpportunityHi,
The setup is pretty clear from the chart.
Price has reached the lower boundary of the channel, which could offer a solid entry point for a long position, with a defined stop loss and take profit.

3400 is no longer the target for gold. The answer is: higher
After gold touched 3,400, most people expected gold to fall back. This kind of rigid thinking is often out of touch with reality. During the rise, do you think it is better to short at highs or to go long on pullbacks?
💡Message Strategy
This round of gold's upward movement is not accidental. Behind it are significant changes in macro fundamentals. First, the overall weakening of the US dollar. The recent decline of the US dollar index to below the 98 mark reflects the market's concerns about the outlook for the Fed's policy. At the same time, the 10-year US Treasury yield also fell below 2%, and the actual yield fell, strengthening the relative attractiveness of gold.
More worthy of vigilance are the political rumors surrounding the re-election of Fed Chairman Powell. According to the Wall Street Journal, US Treasury Secretary Bessent once advised the president to avoid removing Powell from office to maintain the reputation of the Fed. However, speculation about Powell's possible dismissal remains, although Trump himself publicly denied the relevant plan.
In addition, Europe's actions have also disturbed the market. According to Bloomberg, citing EU diplomatic sources, if no agreement is reached before August 1, the EU will impose retaliatory tariffs on US products worth US$72 billion, covering areas such as automobiles, aircraft, alcohol and digital services. These messages have formed a risk resonance environment of "political uncertainty + economic friction", providing a natural long hotbed for gold.
Although the US economic data is slightly mixed - consumer confidence has rebounded, but inflationary pressure continues, with CPI approaching 3% in June - this has made the market full of doubts about the Fed's monetary policy path. Especially in the case of sparse economic data this week (only new housing data, initial claims and durable goods orders), the market focus is on the impact of political and policy conflicts on market confidence.
📊Technical aspects
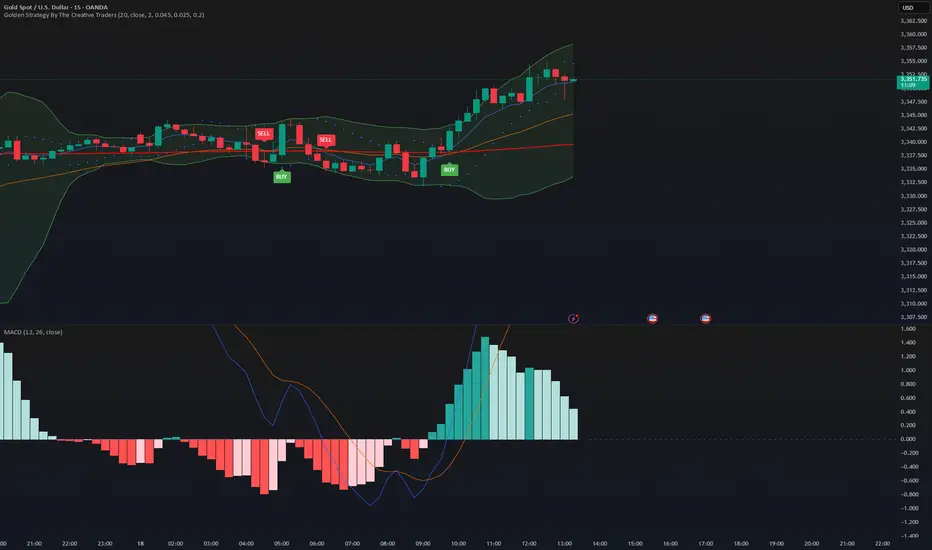
From the daily candlestick chart, gold has recently shown signs of breaking upward after five weeks of sideways fluctuations. In terms of MACD indicators, the MACD histogram has turned from green to red, and the fast and slow lines have formed a "golden cross", strengthening the expectation of a short-term technical rebound.
For gold's lower support, pay attention to last week's high of $3,380, which is also the current 4-hour MA10 moving average position. Secondly, pay attention to the multiple declines in gold prices in the European session on Monday to test the stabilization position of $3,370. For gold's upper pressure, pay attention to the intraday high of $3,402, which is also the high point of gold's rise on Monday. After the decline in June, gold prices rebounded several times to test resistance here and further strengthened. The upper space can pay attention to the high point of the past three months at $3,440.
The previous five weeks of consolidation showed that the market was waiting for directional signals, and this breakthrough of the 3,400 mark was achieved against the dual backdrop of a falling US dollar and rising political uncertainty in the United States, with the typical characteristics of "news trigger + technical confirmation".
If gold successfully stabilizes above 3400, the market will turn its attention to the two key resistance areas of 3451 and 3499, the year's high. Breaking through the former will open up space to test new historical highs upwards; combined with the current MACD golden cross pattern, if the capital side and fundamentals continue to cooperate, short-term accelerated rise cannot be ruled out.
💰Strategy Package
Long Position:3370-3380,SL:3350,Target: 3420,3440
Daily live trade with XAUUSD in 15m/30m/1h 20250723Daily live trade with XAUUSD in 15m/30m/1h 20250723
Gold selling pressure decreased at the end of the week⭐️GOLDEN INFORMATION:
Gold price (XAU/USD) remains under modest pressure during Friday’s Asian session, unable to build on the previous rebound from the mid-$3,300s. Renewed strength in the US Dollar, which extends its recovery from a multi-week low, acts as a headwind for the non-yielding metal. Additionally, fresh optimism surrounding the US-Japan trade agreement has dampened safe-haven demand, keeping gold on the defensive for the third consecutive day.
That said, lingering uncertainty over the Federal Reserve’s rate-cut trajectory, along with concerns about its independence amid growing political pressure, could limit the USD's upside. Meanwhile, rising geopolitical tensions—this time along the Thailand-Cambodia border—may lend some support to bullion. Investors now await US Durable Goods Orders data, which could influence the greenback’s direction and provide short-term cues for the XAU/USD pair going into the weekend.
⭐️Personal comments NOVA:
Gold prices are consolidating and starting to fall below 3400 to stabilize. The momentum for an early rate cut is waning.
⭐️SET UP GOLD PRICE:
🔥SELL GOLD zone: 3399- 3401 SL 3406
TP1: $3390
TP2: $3380
TP3: $3370
🔥BUY GOLD zone: $3310-$3312 SL $3305
TP1: $3325
TP2: $3333
TP3: $3345
⭐️Technical analysis:
Based on technical indicators EMA 34, EMA89 and support resistance areas to set up a reasonable SELL order.
⭐️NOTE:
Note: Nova wishes traders to manage their capital well
- take the number of lots that match your capital
- Takeprofit equal to 4-6% of capital account
- Stoplose equal to 2-3% of capital account
