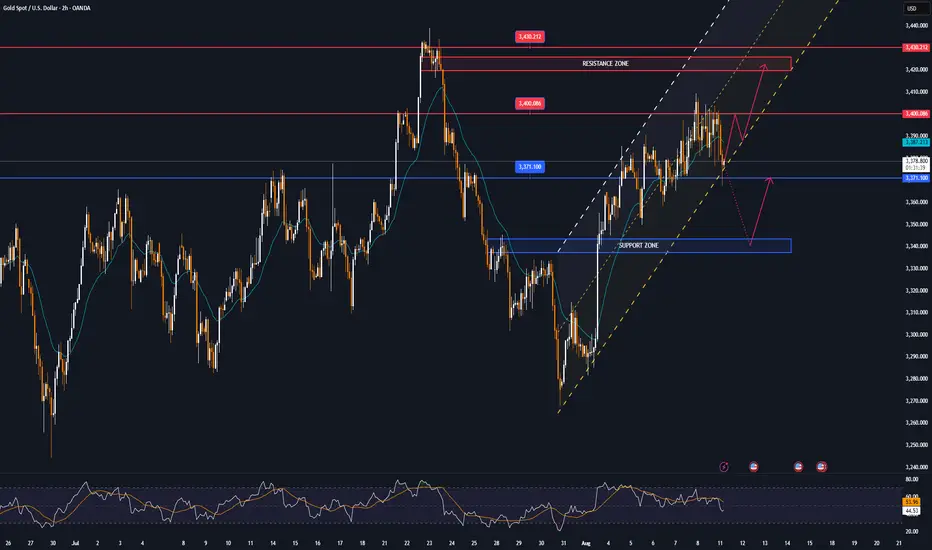
Price broke below lower trendline. Price finally broke below lower trendline thus signaling more downsides for this week . It should be notedworthy that 3340s is our next target then 3280s support zones . A break below 3280s - 3270s brings us down to 3180s . Signal service available . Its free , PM for more details .
XAUUSD trade ideas

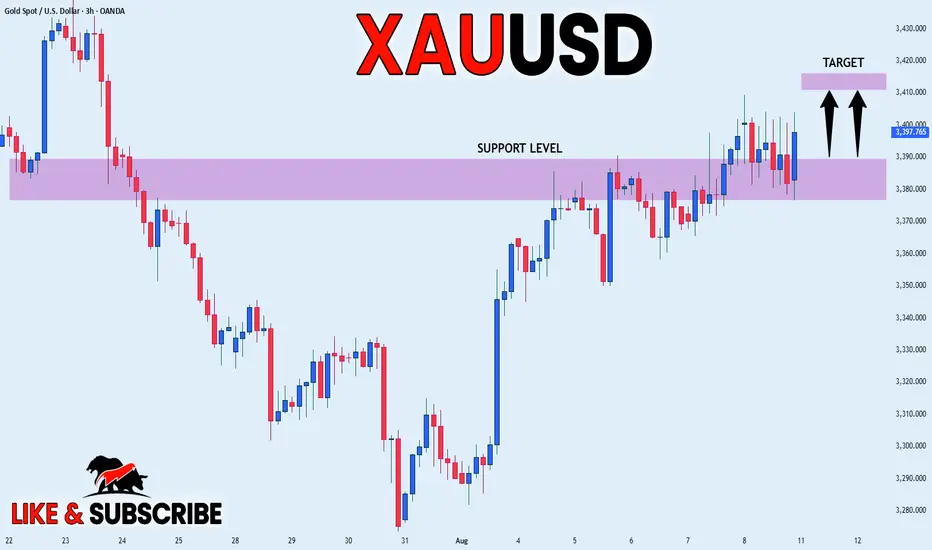
GOLD STRONG BULLISH BIAS|LONG|
✅GOLD is consolidating above
The horizonal support level
Of 3390$ while trading in a
Strong uptrend so we are
Bullish biased and we will be
Expecting growth on Monday!
LONG🚀
✅Like and subscribe to never miss a new idea!✅
GOLD SELL BIOSthis setup depends on CPI data.
dollar is going long
so we should expect.gold to drop from 3358 sl 3363
tp 3266

Gold is under pressure. Can the upward trend continue?On Thursday, gold rose rapidly in the European session, reaching around 3397, but failed to successfully break through the 3400 integer mark; it currently fell back slightly and fluctuated around 3375. Judging from the 4-hour chart, the price is currently running close to the middle track of the Bollinger band; since the market opened this week, the gold price has continued to run above the middle track of the Bollinger band. Despite the slight decline, it has remained within the upward trend channel and has continuously set new highs.
The current upward pressure position remains at 3390-3400, and the key support level is around 3370, which is also the crossover position of the current MA5, 10, and 20 moving averages. The RSI indicator remains above its midline, indicating that bullish momentum remains.
Quaid believes that as long as the price remains above 3370 in the US session, any pullback will be a sign of accumulating upward momentum. Gold still has the trend of hitting the 3400 integer mark.
Trading strategy:
Go long near 3370, stop loss at 3360, profit range 3380-3390-3400.
Short near 3400, stop loss at 3410, profit range 3375-3365-3355.

XAUUSD: Market Analysis and Strategy for August 5th.Gold Technical Analysis:
Daily chart resistance: 3430, support: 3300
4-hour chart resistance: 3400, support: 3334
1-hour chart resistance: 3385, support: 3350.
Gold prices have continued their upward trend since breaking through $3335 last Friday, with an overall bullish outlook. Currently trading around $3356, support lies at $3350, a key defensive barrier for bulls. If this level breaks, gold could fall further to $3328 or even the $3300 mark. Conversely, upward resistance lies at $3385 (previous high), $3400 (round number), and $3430 (trend line resistance). If gold successfully breaks through these resistance levels, it could retest the year's high of $3500. During NY trading, focus on the $3388-3405 range above and the $3350-3334 support range below. Keep an eye on the bull-bear dividing line at 3350!
BUY: 3350
SELL: 3345
SELL: 3385

THE KOG REPORT - NFPTHE KOG REPORT – NFP
This is our view for NFP, please do your own research and analysis to make an informed decision on the markets. It is not recommended you try to trade the event if you have less than 6 months trading experience and have a trusted risk strategy in place. The markets are extremely volatile, and these events can cause aggressive swings in price.
Following on from the FOMC KOG Report which worked quite well, we’ll stick with the same chart and for today suggest caution. It’s the first day of the month and the last day of the weekly candle. The close here for gold is important and will give us further clues to the next few months.
We’ve shared the red boxes and the red box targets are below. There is a key level above 3306-10 which will need to be breached to correct the move back up to the 3330-34 region for the weekly close. However, we now have an undercut low which is potential if there is more aggressive downside to come and that level is sitting around the 3240-50 region which for us may represent an opportunity for a swing low. We’re a bit low and stretched here to short and as we’ve already hit our target for the day so we’ll wait for the extreme levels and if hit and our indicators line up, we may take some scalps. Otherwise, as usual on these events, the ideal trade will come next week.
RED BOXES:
Break above 3290 for 3295, 3306, 3310 and 3320 in extension of the move
Break below 3275 for 3267, 3260, 3255 and 3250 in extension of the move
Please do support us by hitting the like button, leaving a comment, and giving us a follow. We’ve been doing this for a long time now providing traders with in-depth free analysis on Gold, so your likes and comments are very much appreciated.
As always, trade safe.
KOG

Consolidation and indecisionA clear consolidation and indecision can be seen in that yellow-marked area, and a breakout in either direction could mark the start of a strong trend.
There’s also a chance the price could open with a gap tonight, but in any case, I believe this consolidation will break to the upside.

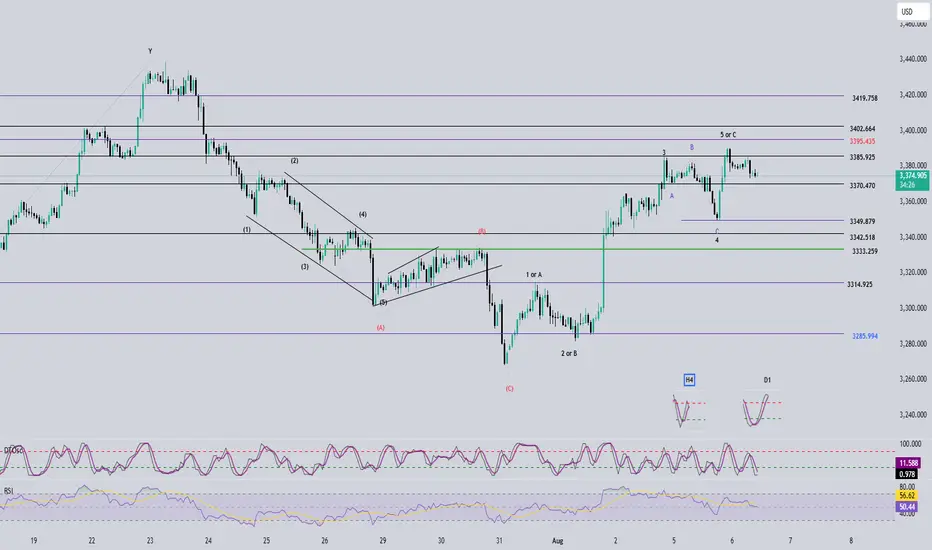
Elliott Wave Analysis – XAUUSD August 6, 2025📊
________________________________________
🔍 Momentum Analysis
• D1 Timeframe:
Daily momentum is showing signs of a potential bearish reversal. However, we need to wait for today’s candle to close to confirm the signal. While waiting for confirmation, price may still experience a minor upward move on lower timeframes, but the current bullish momentum is weak and unlikely to extend far.
• H4 Timeframe:
Momentum is also preparing to reverse. We need to observe the current H4 candle for confirmation. Notably, the reversal signal is forming just below the overbought zone, suggesting there may be one more upward push before a potential decline.
• H1 Timeframe:
Momentum is approaching the oversold zone. It may take 1–2 more bearish candles before a short-term bullish rebound occurs.
________________________________________
🌀 Elliott Wave Structure Update
Yesterday’s bullish move was disappointing — instead of pushing directly to the 3402 or 3419 target zones to complete Wave 5, price only broke slightly above 3385 before reversing. This behavior complicates wave analysis by introducing conflicting possibilities.
We currently consider two main scenarios:
Scenario 1: Wave 5 is not yet complete
• Given that D1 momentum is preparing to reverse downward, it’s unlikely that the current move is Wave 1 of Wave 5. A more likely scenario is that Wave 3 of Wave 5 has completed and price is currently in Wave 4.
• The current corrective structure has stopped at the 0.382 Fibonacci level. As long as price remains above 3370 (the 0.5 Fib level), this strengthens the case for a Wave 4 retracement before another leg up in Wave 5.
• Since bullish strength appears limited, we now focus on two main target zones for Wave 5: 3395 and 3402, instead of the previous high at 3419.
Scenario 2: Full 5-wave structure is complete – now in correction
• If the 5-wave pattern has already finished, the current decline marks the beginning of a corrective phase.
• With current momentum conditions, this is still a viable scenario. However, due to the remaining upside possibility, we recommend waiting for today’s D1 candle to confirm momentum before taking any trade.
________________________________________
📌 Trade Plan
For experienced traders:
• Wait for price to reach the 3395–3402 zones.
• Look for reversal signals in those areas to enter short positions.
Suggested trade plan for newer traders:
• Sell Zone: 3395 – 3398
• Stop Loss: 3408
• Take Profits:
o TP1: 3385
o TP2: 3370
o TP3: 3349
________________________________________
✅ Note:
This trade plan should be reassessed after today’s D1 candle closes for confirmation of the momentum shift.
Gold potentialshi everyone, we have CPI news, and i think these prices are good for pending orders.
dont forget to trail your stop loss.
have a nice day

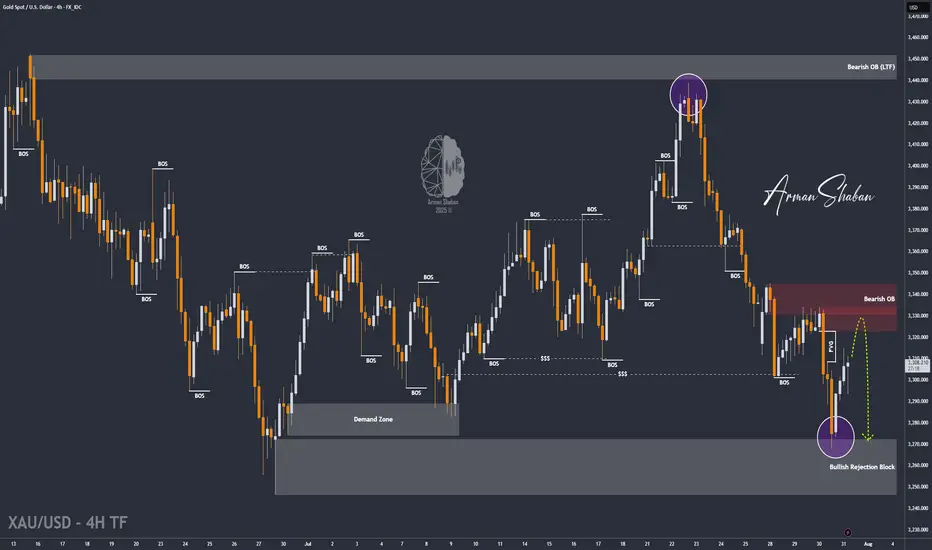
XAU/USD | Next Key Zone: Watch for Rejection at $3334! (READ)By analyzing the gold chart on the 4-hour timeframe, we can see that, just as expected, the price dropped from $3310 to $3288 in the first leg, where it hit a demand zone and bounced up to $3305, delivering a 170-pip rally. The main bearish move from $3333 to $3288 yielded 450 pips, bringing the total return on this analysis to over 620 pips!
In the second phase, gold dropped sharply again to $3268, and once more found demand, currently trading around $3307. If the price holds above $3294, we could expect further upside toward the $3322–$3334 zone. Once gold reaches this area, a strong bearish rejection is likely, with a potential return of 250 to 400 pips.
All key supply and demand levels are marked on the chart — make sure to monitor them closely and study the chart in detail. Hope you’ve made the most of this powerful analysis!
Please support me with your likes and comments to motivate me to share more analysis with you and share your opinion about the possible trend of this chart with me !
Best Regards , Arman Shaban
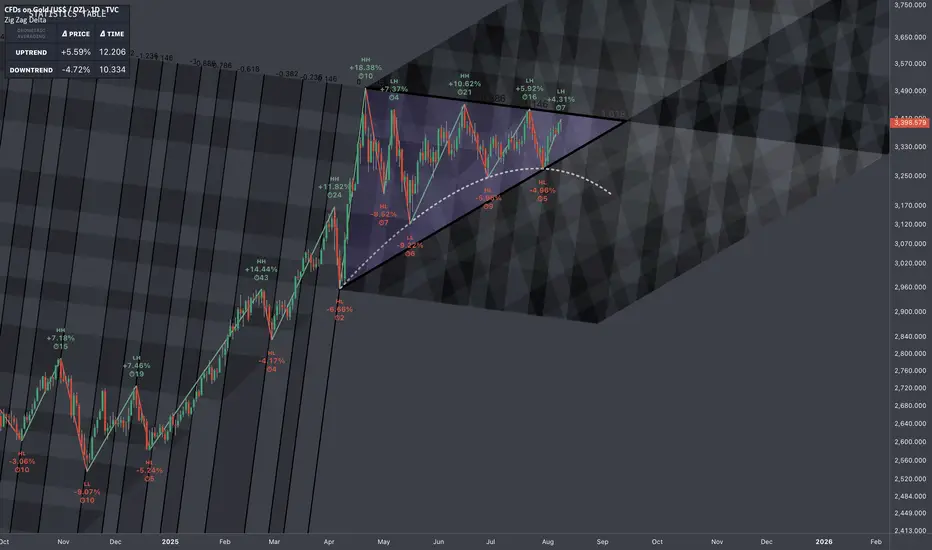
$GOLD: Breakout Texture🏛️ Research Notes
Original Structure
Logical Continuation
Cycle can be broken further by adding x.146 and x.886 essentially allowing us define probability density with better precision. Also, made it B&W because I care about the topology of compression and release (the outcome) more than providing subjective interpretation colors to remain objective. Specifically, if the geometry of "release" phase would match the price texture.
Validation of the structure (initial measurements) by recognizing how it resonated throughout history. (in a way prelude to what we see)
Stats Table shows geometric averaging of all swings to figure out the all time mean to be able to anticipate wave’s first limit set by typical range.
XAUUSD XAU/USD SHORT BIAS (at $3396) – Expecting a Sharp Decline
Thesis:
Gold is currently overextended at $3396, showing signs of exhaustion after a strong rally. Technical indicators and macroeconomic conditions suggest an imminent correction.
Reasons for Bearish Outlook:
1. Overbought Conditions – RSI and momentum oscillators are at extreme highs; a retracement is statistically likely.
2. Strong Resistance – Price approaching a historical supply zone; failed breakouts are common at this level.
3. Dollar Strengthening – If DXY gains strength due to Fed policy, gold could see downward pressure.
4. Bond Yields Rising – Higher yields reduce gold’s appeal as a non-yielding asset.
Target Zones:
• Immediate target: $3310–$3290
• Deeper support: $3225–$3190
Risk:
If gold breaks and holds above $3420, the short thesis may be invalidated.

GOLD PRICE: 2 BIG OPTIONS.1. Option 1: Wave 4 of gold price ends, with this scenario, the DXY trend will not be like the chart below, but this week DXY will return to the old bottom and head towards 95-91, gold will increase to complete wave (5).
Price range for the next 3-4 months: 3350-3750.
2. Option 2:
In terms of time, wave (4) has not yet ensured balance. DXY increases and recovers as the chart.
That means we have a gold price range for the next 3-4 months of 3400-3100.

My first take on XAUUSDI see this last fall as a very clear sweep of liquidity (the recent lows. After that i see an impulsive push away from this zone giving me a change of character. Left behind is an FVG on hopurly chart that aligns within the kill zone on my Fibonacci tool. and that is where i would enter. I would expect price to mitigate this FVG. Another confluence is that we created many IFVG's on the way up showing balanced price action. Only one more confluence i would have liked is a HTF order block from the liquidity sweep but only have one on the 5 minute. i will monitor. First tp is that internal liquidity from the move, second tp is the external liquidity where we have had consolidation and a few failed attempts to break above this opening gap fvg. thanks for looking. any comments welcome,

The gold chart made VERY simple.The gold chart made VERY simple.
$3800 target POSSIBLE once we get a confirmed continuation breakout.

Data week, GOLD has all the conditions to riseThis week, global financial markets will look forward to US inflation data for July (CPI, PPI), retail sales data and speeches from several Federal Reserve officials.
These important pieces of information will directly impact expectations for a September rate cut and influence the performance of the US Dollar, gold, crude oil and US stocks.
On the political front, US President Donald Trump's public pressure on the Federal Reserve and recent appointments have raised market concerns about the independence of monetary policy, while escalating tariffs continue to raise the risk of global trade conflicts.
Federal Reserve: Policy Disruption and Dovish Signals Coexist
This week, the Fed kept its target range for the federal funds rate unchanged at 4.25% to 4.50%, but the vote was split, with two officials—Vice Chair Michelle Bowman and Governor Christopher Waller—in favor of an immediate quarter-point rate cut.
TVC:DXY : Technical Pressure and Political Risk
The US Dollar Index (DXY) has fallen to around 98 this week, failing to hold above 100. Technically, a break of the July low of 96.37 could lead to a drop to 95.13 and 94.62. Despite the 10-year Treasury yield rising to 4.285%, the Dollar remains under pressure, reflecting market concerns about political risks in the United States.
If CPI is higher than expected this week, the market may feel like it is moving too fast, which could cause volatility.
Traders generally believe that Trump's tariff policies, public criticism of the Federal Reserve and uncertainty about the fiscal deficit are all weakening the medium- to long-term support for the US Dollar.
Markets will be watching closely to see if the impact of tariffs starts to show in inflation data, and if consumer spending data confirms the economic recovery. A positive reading would reinforce expectations for a rate cut, a positive signal for stocks and gold. An unexpected rise in inflation could slow the pace of Fed easing, weighing on risk assets and supporting the US Dollar TVC:DXY .
Technical Outlook Analysis OANDA:XAUUSD
Gold has been on a long bullish recovery since breaking out and holding above the $3,300 base point, and currently structurally it has not changed much with the uptrend still dominating the daily chart.
Specifically, in the short term, gold is supported by the EMA21 with the target at the $3,400 base point noted by readers in the weekly publication last week has been achieved.
Looking ahead, the horizontal support at the 0.236% Fibonacci retracement will be the nearest support to reinforce the expectation of a continued breakout of gold prices breaking through the $3,400 point towards the $3,430 – $3,450 level.
In terms of momentum, the Relative Strength Index (RSI) has moved above 50 but is still quite far from the overbought zone (80-100), indicating that there is still a lot of room for upside ahead.
Meanwhile, even if gold is sold below the EMA21, the declines are not considered a specific technical trend in the short term, as long as the support levels of 3,310 – 3,300 USD and Fibonacci 0.382% are not broken below.
Finally, in terms of position as well as technical conditions, the gold price on the daily chart currently has a technical outlook leaning more towards the upside and the notable points will be listed as follows.
Support: 3,371 – 3,350 – 3,340 USD
Resistance: 3,400 – 3,430 – 3,350 USD
SELL XAUUSD PRICE 3424 - 3422⚡️
↠↠ Stop Loss 3428
→Take Profit 1 3416
↨
→Take Profit 2 3410
BUY XAUUSD PRICE 3338 - 3340⚡️
↠↠ Stop Loss 3334
→Take Profit 1 3346
↨
→Take Profit 2 3352
Daily XAUUSD OutlookGood day traders 🌟
Gold opens today’s session still holding strong near the upper boundaries of its daily range, trading just beneath the dominant weekly supply zone. Buyers have kept control above the 3290 handle, while sellers continue to defend the ceiling around 3439. With a busy US data week ahead, the daily chart sets the stage for either a decisive breakout or a calculated pullback into fresh demand.
📌 Bias: Bullish — daily structure remains firmly intact above 3290, dynamic EMA flow is aligned for upside, and momentum is in buyers’ favor. Still, given we’re in premium pricing, waiting for confirmation is essential before entering fresh positions.
Macro Context
Markets are poised for volatility with US CPI, PPI, and retail sales lined up. Softer inflation data could give bulls the push to clear the 3439 ceiling, while stronger numbers may invite a retracement toward lower daily demand zones.
📊 Key Daily Zones
Immediate Resistance / Supply: 3395 – 3439 (HTF supply overlap + liquidity resting above).
Mid-Level Demand: 3330 – 3310 (recent bullish OB, intraday reload zone).
Major Daily Demand: 3290 – 3260 (untested breakout base).
📊 Key Zones
Above Current Price
Immediate Resistance / Supply: 3395 – 3439 (major HTF supply).
3460 – 3475 → H4/D1 imbalance + inducement zone.
3480 – 3490 → 1.618 Fibonacci extension from last weekly swing.
3510 – 3525 → minor HTF supply / wick rejection zone.
Below Current Price
Mid-Level Demand: 3330 – 3310 (recent bullish OB).
Major Daily Demand: 3290 – 3260 (untested breakout base).
3220 – 3200 → daily demand + liquidity sweep zone.
3155 – 3140 → daily OB + HTF BOS retest.
3100 – 3085 → HTF demand + liquidity shelf.
3040 – 3020 → deep daily demand + Fibo 0.786 retracement of May rally.
🚀 Bullish Scenario
A break and daily close above 3439 clears the path toward 3460 – 3475, with extension targets at 3480 – 3490 and 3510 – 3525.
Pullbacks into 3330 – 3310 or 3290 – 3260 with bullish confirmation may offer high-RR entries back toward the highs.
📉 Bearish Scenario
Rejection from 3439 could push price back toward 3330 – 3310 or 3290 – 3260.
A daily close below 3260 opens deeper targets at 3220 – 3200, 3155 – 3140, and potentially 3100 – 3085.
🔍 Confluence & Indicators
Dynamic EMA Flow: Bullish, price above all major EMAs.
RSI: Neutral-to-bullish, no divergence on D1.
FVGs: Unfilled gap above 3439 acts as liquidity magnet.
Fibonacci: Price near 1.272 extension, with 1.618 above at 3480–3490.
📌 Outlook Summary
Gold is coiled near the top of its range in a bullish structure. The best setups will come from either a confirmed breakout above 3439 toward higher HTF targets or a disciplined buy from demand after a healthy retracement.
💬 Your move — will gold finally push through the highs, or is a deeper pullback coming first? Share your thoughts below and let’s track the market together.
If you find these outlooks useful, hit like and follow for precision updates.
— GoldFxMinds
Disclosure: This analysis uses Trade Nation’s price feed and is for educational purposes only — not financial advice.

Gold: Is a Bullish Wedge Brewing?Yesterday, gold once again reversed from the resistance level of 3,400 USD. However, a vague "bullish wedge" pattern is forming on the chart...
Gold price has dropped from its two-week high due to profit-taking. The correction was intensified after the United States imposed tariffs on imported gold bars (1 kg), which could disrupt supply from Switzerland and London.
Key supporting factors: Weak U.S. employment data and expectations that the Fed will cut interest rates in September are putting significant pressure on the USD, making gold more attractive to investors seeking a safe-haven asset.
Risk: Short-term volatility ahead of U.S. CPI data next week. However, the underlying bullish momentum remains intact.
The issue with the bullish wedge pattern is that it forms a vague shape. We have an upward movement, but this pattern could easily reverse the local bullish trend due to the difficult resistance zone at 3,390-3,410.
Currently, the lower boundary of the wedge is acting as support. If the price holds above this level, the main scenario remains a bullish move towards the 3,433 to 3,450 USD resistance zone. On the other hand, if the support of the wedge pattern is broken, the price could return to the 3,350 USD level before the bullish trend resumes.

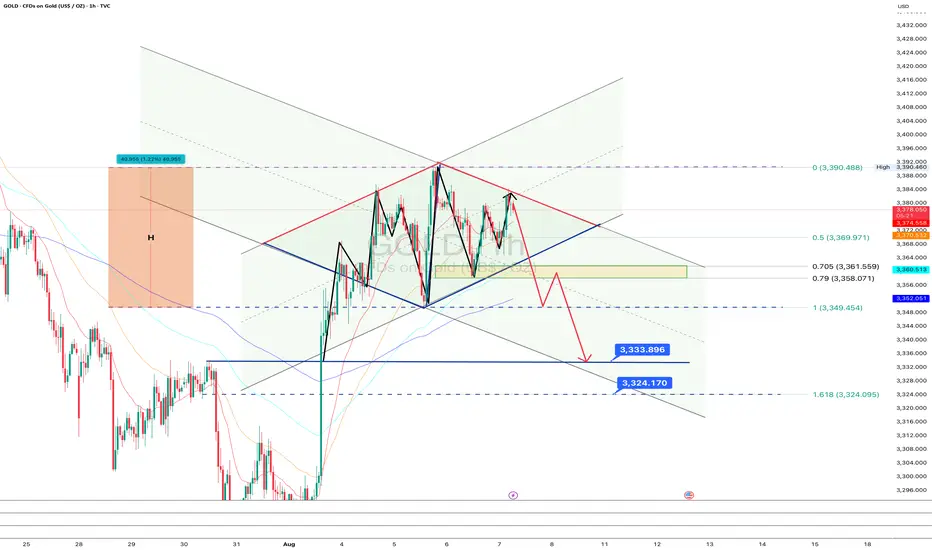
GOLD: The diamond hasn’t sparkled yet - waiting for confirmationOn the 1-hour chart of gold, a diamond pattern is forming at the top of an ascending channel. The current price is 3378, and the asset remains within the structure, without confirming a reversal yet. The key area is the 0.705–0.79 Fibo zone (3361.5–3358), which aligns with the lower boundary of the diamond. At this stage, the pattern is not complete — there's no break of the base, so the move is still pending.
Technically , the market is showing signs of momentum fading and a possible transition into a correction, but it's too early to call it without a clear break and close below 3361, which represents the lower edge of the diamond. If the bearish scenario plays out, the next targets are 3333 and 3324, projected from the pattern itself.
Fundamentally , the picture remains mixed: the dollar has stabilized temporarily, and expectations around U.S. interest rates continue to create uncertainty. Gold is reacting to all of this, but without a clear macro trigger, the upside may remain limited.
Tactical plan: Watch how price behaves in the 3361.5–3358 zone. If a reversal pattern forms, followed by a break to the downside, a short opportunity may open after a retest.- with targets at 3333 and 3324. If that break doesn't happen, and price moves higher, the diamond structure breaks to the upside, and the bearish scenario is invalidated.
As they say until the base breaks, it’s just a shiny piece of the chart, not a diamond. Watch closely, act on confirmation, not assumptions.
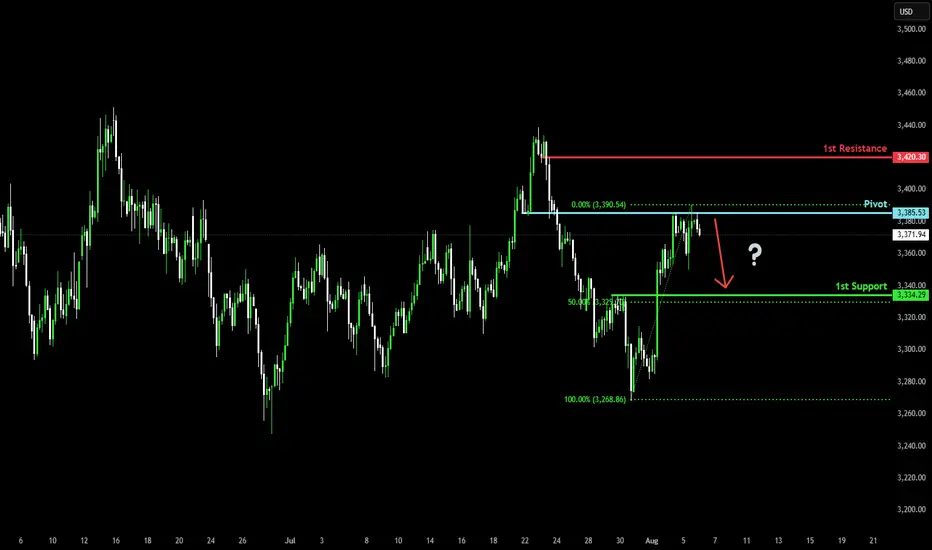
Bearish drop for the Gold?The price has rejected off the pivot which has been identified as a pullback resistance and could drop to the 50% Fibonacci support.
Pivot: 3,385.53
1st Support: 3,334.29
1st Resistance: 3,420.30
Risk Warning:
Trading Forex and CFDs carries a high level of risk to your capital and you should only trade with money you can afford to lose. Trading Forex and CFDs may not be suitable for all investors, so please ensure that you fully understand the risks involved and seek independent advice if necessary.
Disclaimer:
The above opinions given constitute general market commentary, and do not constitute the opinion or advice of IC Markets or any form of personal or investment advice.
Any opinions, news, research, analyses, prices, other information, or links to third-party sites contained on this website are provided on an "as-is" basis, are intended only to be informative, is not an advice nor a recommendation, nor research, or a record of our trading prices, or an offer of, or solicitation for a transaction in any financial instrument and thus should not be treated as such. The information provided does not involve any specific investment objectives, financial situation and needs of any specific person who may receive it. Please be aware, that past performance is not a reliable indicator of future performance and/or results. Past Performance or Forward-looking scenarios based upon the reasonable beliefs of the third-party provider are not a guarantee of future performance. Actual results may differ materially from those anticipated in forward-looking or past performance statements. IC Markets makes no representation or warranty and assumes no liability as to the accuracy or completeness of the information provided, nor any loss arising from any investment based on a recommendation, forecast or any information supplied by any third-party.
XAUUSD H4 | Bullish bounce offXAU/USD is falling towards the buy entry which is a pullback support that lines up with the 50% Fibonacci retracement and could bounce to the take profit.
Buy entry is at 3,332.63, which is a pullback support that lines up with the 50% Fibonacci retracement.
Stop loss is at 3,306.53, which is a pullback support that is slightly above the 78.6% Fibonacci retracement.
Take profit is at 3,400.72, which is a swing high resistance.
High Risk Investment Warning
Trading Forex/CFDs on margin carries a high level of risk and may not be suitable for all investors. Leverage can work against you.
Stratos Markets Limited (tradu.com ):
CFDs are complex instruments and come with a high risk of losing money rapidly due to leverage. 65% of retail investor accounts lose money when trading CFDs with this provider. You should consider whether you understand how CFDs work and whether you can afford to take the high risk of losing your money.
Stratos Europe Ltd (tradu.com ):
CFDs are complex instruments and come with a high risk of losing money rapidly due to leverage. 66% of retail investor accounts lose money when trading CFDs with this provider. You should consider whether you understand how CFDs work and whether you can afford to take the high risk of losing your money.
Stratos Global LLC (tradu.com ):
Losses can exceed deposits.
Please be advised that the information presented on TradingView is provided to Tradu (‘Company’, ‘we’) by a third-party provider (‘TFA Global Pte Ltd’). Please be reminded that you are solely responsible for the trading decisions on your account. There is a very high degree of risk involved in trading. Any information and/or content is intended entirely for research, educational and informational purposes only and does not constitute investment or consultation advice or investment strategy. The information is not tailored to the investment needs of any specific person and therefore does not involve a consideration of any of the investment objectives, financial situation or needs of any viewer that may receive it. Kindly also note that past performance is not a reliable indicator of future results. Actual results may differ materially from those anticipated in forward-looking or past performance statements. We assume no liability as to the accuracy or completeness of any of the information and/or content provided herein and the Company cannot be held responsible for any omission, mistake nor for any loss or damage including without limitation to any loss of profit which may arise from reliance on any information supplied by TFA Global Pte Ltd.
The speaker(s) is neither an employee, agent nor representative of Tradu and is therefore acting independently. The opinions given are their own, constitute general market commentary, and do not constitute the opinion or advice of Tradu or any form of personal or investment advice. Tradu neither endorses nor guarantees offerings of third-party speakers, nor is Tradu responsible for the content, veracity or opinions of third-party speakers, presenters or participants.

GOLD Melted , Clear Chance To Buy It Now , 150 Pips Waiting !Here is My 15 Mins Gold Chart , and here is my opinion , the price go down very hard after touch 3400.00 and melted to 3353.00 and we finally above 3358.00 and we have a 30 Mins Candle closure above it And Perfect Breakout and perfect bullish price action , so we have a good confirmation now to can buy it and we can targeting 100 to 200 pips as a small correction after this huge movement to downside in a very short period , so i will buy it to see if we have a correction for 150 to 200 pips at least .
Reasons To Enter :
1- New Support Created .
2- Bullish Price Action .
3- Bigger T.F Giving Good Bullish P.A .
4- 30 Mins Confirmation
5- Little Correction .

Weekly XAUUSD Outlook,August 11-15, 2025Hello traders ,
We step into a new week with gold holding its ground in the premium zone, standing just beneath the towering high of 3439. The weekly chart tells a story of persistent bullish momentum — each pullback over the past months has been shallow, showing that institutional buyers remain firmly in control.
The macro calendar is packed with potential catalysts. US CPI and PPI will be the main drivers, shaping inflation expectations and influencing the USD. Stronger readings may spark a controlled retracement, while softer data could be the trigger for gold to finally break through the ceiling at 3439. Retail Sales and Consumer Sentiment later in the week could serve as the final push to decide direction.
📊 Weekly Structure & Key Zones
Major HTF Supply: 3350 – 3439 (full wick-to-body range of the last strong sell-side push; the only true weekly supply left).
First HTF Demand: 3290 – 3260 (breakout origin, untested bullish OB).
Deep HTF Demand: 2920 – 2880 (historical liquidity pocket, unlikely without major sentiment change).
📌 Bias: Bullish — structure, EMA flow, and momentum remain in buyers’ favor, but execution requires patience as we are already in premium pricing.
🚀 Bullish Breakout Path
If we see a decisive weekly close above 3439, gold steps into clear skies. The next reference points are:
3460 – 3475 → imbalance + inducement zone on H4/D1.
3480 – 3490 → 1.618 Fibonacci extension of the last weekly swing.
Beyond this, fresh mapping will be required on daily structure.
📉 Bearish Retracement Path
A rejection from 3439, especially if reinforced by strong USD data, could pull price back into 3290 – 3260 for a potential reload. Only a weekly close below 3260 would shift the bias toward the deeper 3100–3050 area.
🔍 Confluence & Indicators
Dynamic EMA Flow: Fully bullish, EMAs stacked in buy order.
RSI: Holding in bullish territory, no weekly divergence.
FVGs: Small unfilled gaps above 3439 act as liquidity targets.
Fibonacci: Price currently reacts near 1.272 extension; 1.618 remains above.
📌 Outlook Summary
The bulls still have the upper hand, but this is a premium zone where patience matters. The best plays will come from either a disciplined pullback into demand or a confirmed breakout toward 3480–3490.
💬 Your turn — what’s your call? Are we about to see new highs, or will gold take a breath first? Share your thoughts below.
If you enjoy these outlooks, don’t forget to like and follow for precision updates.
— GoldFxMinds
Disclosure: This analysis uses Trade Nation’s price feed and is for educational purposes only — not financial advice.
