Will We See a Break Down or a Sharp Rebound to Key Resistance?XAUUSD – Will We See a Break Down or a Sharp Rebound to Key Resistance? | MMFlow Trading 🔥
Market Overview
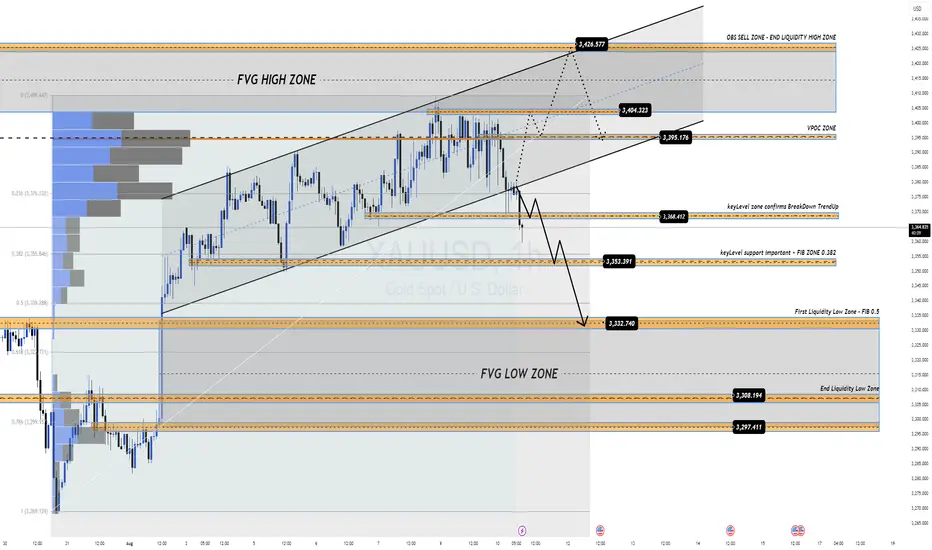
Gold dropped sharply at the start of the week as profit-taking hit the market and late-week FOMO buyers from last week were stopped out.
Buy-side momentum has clearly slowed, and sellers are waiting for a confirmed breakdown from the rising channel to target lower liquidity zones around 335x and 333x.
At present, price is reacting around the 336x – 337x key support with an H1 long-wick candle showing buying pressure.
Trading Outlook
We need a clear breakdown confirmation (candle close with volume) before executing a short entry.
If price holds and fails to break, we could see a rebound back towards major resistance zones 339x – 340x – 342x.
This week is loaded with high-impact USD data – CPI & PPI – both strong inflation indicators that could put short-term pressure on gold if data comes out USD-positive.
📌 Trading Plan
BUY SCALP
Entry: 3353 – 3351
Stop Loss: 3345
Targets: 3358 → 3362 → 3366 → 3370 → 3375 → 3380
BUY ZONE
Entry: 3332 – 3330
Stop Loss: 3325
Targets: 3336 → 3340 → 3345 → 3350 → 3360 → 3370 → 3380
SELL SCALP
Entry: 3394 – 3396
Stop Loss: 3400
Targets: 3390 → 3385 → 3380 → 3370 → 3360
SELL ZONE
Entry: 3425 – 3427
Stop Loss: 3430
Targets: 3420 → 3415 → 3410 → 3405 → 3400 → 3390 → 3380
⚠ Risk Management Notes
This is a high-impact news week – expect false breakouts before and after CPI/PPI releases.
Avoid oversized positions into news; keep risk tight.
If price breaks above 3430 with strong volume, the current sell setup is invalid → wait for a new market structure before re-entering.
XAUUSD trade ideas
Gold Trade Plan 06/08/2025Dear Traders
I am expecting a drop in gold to the targets of 3309 and 3282. I see a pattern on the chart, and if the price doesn't fix above 3390, a drop to 3290 and 3282 is inevitable.
First Target : 3330
Second target : 3309
third Target : 3290
Regards,
Alireza!

XAUUSD- GOLD Buy NowXAUUSD- GOLD Buy Now based on Clear bullish diveregence formed on 15 minutes chart,also confirmed through CRT method, it is expected that market will achieve atleast 50% of the target. what are your thoughts?

Gold Starts to Lose GroundAfter a period of steady movement, selling pressure is starting to build. Key support levels are coming into focus, and a break below them could open the door to further downside. The momentum has shifted, and buyers may need to step aside for now.

Gold | Tight Range as Tariff Uncertainty Caps MomentumGold Pares Gains on U.S. Tariff Uncertainty
Gold slipped, reversing the prior session’s gains as persistent tariff uncertainty weighed on sentiment.
Technical Outlook:
The price is consolidating between 3348 and 3365.
A 1H close below 3348 could trigger a decline toward 3332 and 3320.
A break above 3365 would open the way for gains toward 3383 and 3401.
Pivot: 3365
Support: 3348, 3332, 3320
Resistance: 3373, 3385, 3401

XAUUSD bulls eye 3400 target..Hello IGT FOLLOWERS
Today gold has fell down and now it has touched to the major support area around 3345/3352.. According to the structure of gold it is possible that it will fly high and reach the 3400.. Gold at 3345 is showing bullish strength on the H1 chart. Sustained upward momentum could push the price toward the 3400 target...
Key points :
Entry point : 3345
Support Area : 3345/3352
Follow me for more latest updates and signals

IM EXPECTING GOLD TO COLLAPSEHere on the post, i shared my SAXO:XAUUSD sell analysis, for further details, see the content of the post. All the best.

Bulllish on XAUUSD (Gold)Bullish on XAUUSD -
BUY - 3362.7
Stoploss - 3359
Final Target - 3410
Partial booking at 1:2RR , 1:3RR

Bulls maintain weekend above 3400⭐️GOLDEN INFORMATION:
Gold (XAU/USD) eased back from a more than two-week high near $3,409–3,410 during Friday’s Asian session, as traders booked profits ahead of the weekend. A broadly positive tone in equity markets, coupled with a modest rebound in the U.S. Dollar, added to the downward pressure on bullion. Even so, several factors continue to underpin the metal, urging caution for aggressive bearish positioning.
Lingering trade-related uncertainty—intensified by President Donald Trump’s latest tariff threats this week—has helped maintain gold’s safe-haven appeal. At the same time, growing expectations that the Federal Reserve will resume its rate-cut cycle in September are likely to cap any sustained dollar strength, encouraging dip-buying interest around the $3,380 level.
⭐️Personal comments NOVA:
Tariff tensions, along with a very positive market about the possibility of interest rate cuts, helped gold prices return above the 3400 zone.
⭐️SET UP GOLD PRICE:
🔥SELL GOLD zone: 3428- 3430 SL 3435
TP1: $3418
TP2: $3408
TP3: $3392
🔥BUY GOLD zone: $3373-$3371 SL $3366
TP1: $3382
TP2: $3395
TP3: $3410
⭐️Technical analysis:
Based on technical indicators EMA 34, EMA89 and support resistance areas to set up a reasonable BUY order.
⭐️NOTE:
Note: Nova wishes traders to manage their capital well
- take the number of lots that match your capital
- Takeprofit equal to 4-6% of capital account
- Stoplose equal to 2-3% of capital account

GOLD spikes then falls rapidly, all conditions are bullishOANDA:XAUUSD prices surged after falling in the previous trading day, as Trump tariffs took effect and weak U.S. jobs data raised expectations of interest rate cuts, boosting safe-haven demand.
OANDA:XAUUSD prices reversed course on Thursday, posting sharp gains as the latest U.S. jobs data showed a weakening labor market. Investors, therefore, increased their dovish bets as the Federal Reserve is expected to resume its easing cycle in September.
The number of people filing for continuing unemployment benefits in the United States has hit a high not seen since November 2021, adding momentum to the Federal Reserve’s dovish stance. With inflation remaining high and the U.S. job market weak, the risk of stagflation has emerged.
Data released by the U.S. Labor Department on Thursday showed that continuing unemployment claims rose by 38,000 to 1.97 million in the week ended July 26. The high level suggests that it is increasingly difficult for unemployed people to find new jobs. Initial jobless claims also rose to 226,000 last week, exceeding economists’ expectations.
The data has bolstered market expectations for a Fed rate cut
Last week, weak U.S. nonfarm payrolls data boosted expectations for a rate cut.
According to data from Prime Market Terminal, traders see a 95% chance of a 25 basis point rate cut at the September meeting.
Meanwhile, higher tariffs imposed by U.S. President Donald Trump took effect on Thursday, providing a tailwind for gold, Valencia added. Countries affected include Switzerland, Brazil and India, which have yet to reach a deal with Washington.
Gold, a store of value in times of uncertainty, also tends to perform well in low-interest-rate environments.
Milan joins Fed, adding pressure on Powell to cut rates
US President Trump announced on Thursday that he will nominate Stephen Milan, currently chairman of the White House Council of Economic Advisers, to serve on the Federal Reserve Board, replacing Kugler, who unexpectedly resigned last week. The news also helped push gold prices higher on Thursday.
Trump said on social media Truth Social: "Stephen Milan will serve as the newly vacated seat on the Federal Reserve Board of Governors until January 31, 2026. He has been with me since my second term and his economic expertise is unmatched. He will do an outstanding job."
Technical Outlook Analysis OANDA:XAUUSD
Gold currently has all the bullish conditions, specifically the gold price broke above the 0.236% Fibonacci retracement level of $3,371 and tested the original price point, which is the target upside point of the $3,400 area.
The $3,371 level becomes the nearest support at present, while the Relative Strength Index (RSI) shows that there is still room for further upside ahead. As long as gold remains above the EMA21, it still has a bullish outlook in the short term.
There are hardly any factors that suggest that gold can fall significantly, so the general trend in the short and medium term is bullish and the notable points will be listed as follows.
Support: $3,371 - $3,350
Resistance: $3,400 - $3,430 - $3,450
SELL XAUUSD PRICE 3431 - 3429⚡️
↠↠ Stop Loss 3435
→Take Profit 1 3323
↨
→Take Profit 2 3317
BUY XAUUSD PRICE 3339 - 3341⚡️
↠↠ Stop Loss 3335
→Take Profit 1 3347
↨
→Take Profit 2 3353

GOLD ROUTE MAP UPDATEHey Everyone,
Quick follow up on our 1H chart route map:
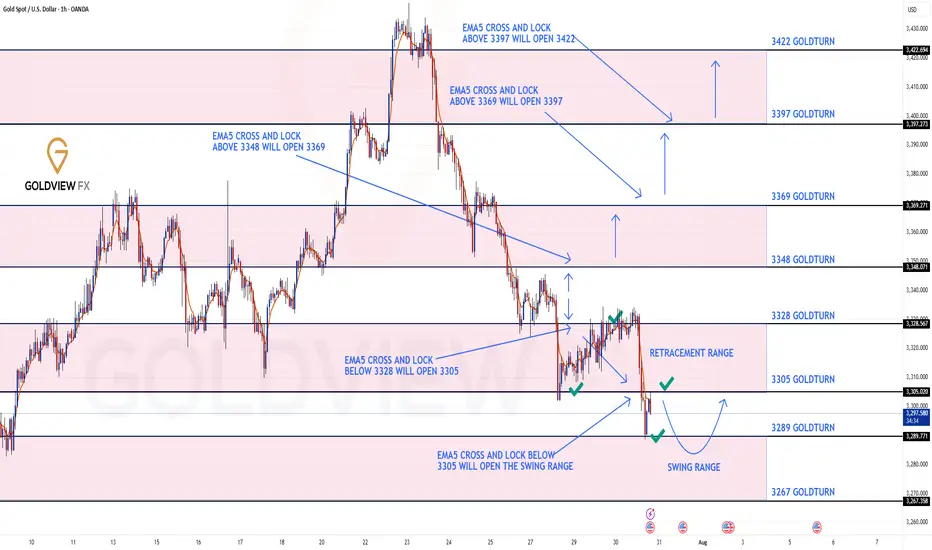
We had the break below 3305 Goldturn, opening and hitting the 1st level of the swing range at 3289, which did exactly what it says on the tin and gave us the perfect swing bounce into 3305.
We are now looking for support above the swing range and a break above 3305 to track the movement up or further retest and break below the 1st level of the swing range may open the the 2nd level at 3267. Ema5 cross and lock will confirm this.
From here, we’re watching for:
Support to hold above the swing range, followed by a clean break above 3305, which would suggest upward continuation.
Alternatively, if we retest and break below 3289, that opens the path toward the second level of the swing range at 3267.
We will keep the above in mind when taking buys from dips. Our updated levels and weighted levels will allow us to track the movement down and then catch bounces up.
We will continue to buy dips using our support levels taking 20 to 40 pips. As stated before each of our level structures give 20 to 40 pip bounces, which is enough for a nice entry and exit. If you back test the levels we shared every week for the past 24 months, you can see how effectively they were used to trade with or against short/mid term swings and trends.
The swing range give bigger bounces then our weighted levels that's the difference between weighted levels and swing ranges.
BULLISH TARGET
3348
EMA5 CROSS AND LOCK ABOVE 3348 WILL OPEN THE FOLLOWING BULLISH TARGETS
3369
EMA5 CROSS AND LOCK ABOVE 3369 WILL OPEN THE FOLLOWING BULLISH TARGET
3397
EMA5 CROSS AND LOCK ABOVE 3397 WILL OPEN THE FOLLOWING BULLISH TARGET
3422
BEARISH TARGETS
3328 - DONE
EMA5 CROSS AND LOCK BELOW 3328 WILL OPEN THE FOLLOWING BEARISH TARGET
3305 - DONE
EMA5 CROSS AND LOCK BELOW 3305 WILL OPEN THE SWING RANGE
3289 - DONE
3267
As always, we will keep you all updated with regular updates throughout the week and how we manage the active ideas and setups. Thank you all for your likes, comments and follows, we really appreciate it!
Mr Gold
GoldViewFX
GOLD DAILY CHART ROUTE MAPHey Everyone,
Daily Chart Update – Another Clean Rejection: Structure Still Dominates
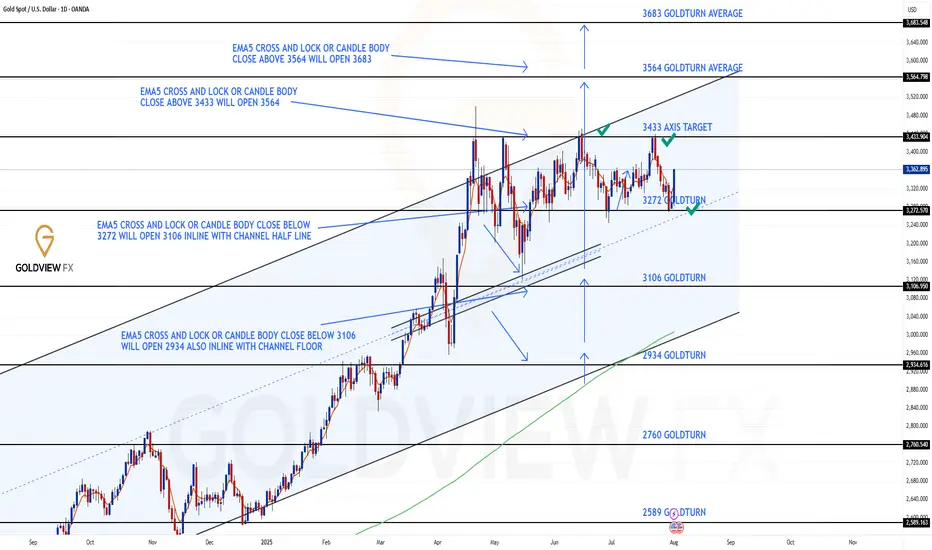
Following up on the recent price action last week after hitting the 3433 resistance level, we got exactly what the chart warned us about.
There was no confirmed break above 3433, which led to a clean rejection right back into 3272. Interestingly, the move aligned perfectly with the channel half-line, giving us another bounce right off that zone.
We remain in the same structured range, with price still rotating between 3262 and 3433, a 170+ pip zone that continues to deliver high probability trade setups.
Here’s where we are now:
🔹 Range Still Active
Price is respecting the 3272–3433 boundaries with precision. Until we get a decisive break and hold outside this range, range bound strategies remain in play.
🔹 No Breakout = Clean Rejection
The failure to sustain above 3433 confirms resistance is still valid. We're watching EMA5 for potential breakout confirmation, until then, the bias stays neutral within the range.
🔹 Channel Half-line Bounce
That rejection into 3272 also matched the channel half-line and the bounce there further cements this area as critical support.
Updated Key Levels
📉 Support – 3272
Still the major pivot. Buy zones remain valid here unless we see a confirmed breakdown.
📈 Resistance – 3433
Now clearly tested and rejected again. Any clean break and hold above could change the dynamic, but until then, it's solid resistance.
Thanks as always for your support.
Mr Gold
GoldViewFX
Bearish trend dominates, gold awaits direction decisionGold's 1-hour moving average has begun to turn around from a high point. For gold bulls, this may mean that if they want to reverse their decline in the short term, they may need major news to stimulate the market. Otherwise, in the short term, gold bulls may find it difficult to make any significant progress. Gold's 1-hour moving average has fallen at this rate, and there has been basically no major rebound. This rebound also provides a second opportunity for shorting. The key level of gold is still in the 3365-3380 area. If the US market is under pressure at the 3365-3380 area, then gold will continue to be shorted on highs. The market is changing rapidly. We never become rigid longs or shorts. Trading is about following the wind. We go where the wind blows, otherwise we will eventually fail against the wind. Gold bears are now clearly becoming stronger, so we should continue to ride on the tailwind of the gold bears.

GOLD | Gold Eyes Pivot at 3347 – NY Session Close KeyGOLD | Gold Eyes Pivot at 3347 – NY Session Close Key
🕯Gold slipped slightly on Tuesday due to a stronger dollar, but remains close to a two-week high amid growing expectations of a U.S. rate cut in September.
⏺ Price has begun to retreat from the 3380 resistance, now heading toward the pivot level at 3347.
We’re watching for a potential reversal from 3347, especially if a 4H candle closes above this level during the New York session — this could trigger a bullish recovery toward 3365, and possibly retest 3380.
⏺ A confirmed breakout above 3380 would open the path for further upside toward 3402, but only if strong momentum is sustained.
If price closes below 3347 on the 1H, and this is confirmed by a 4H candle, it would likely reactivate bearish pressure toward the 3320 support.
• Resistance: 3365 – 3380 – 3402
• Support: 3320 – 3313

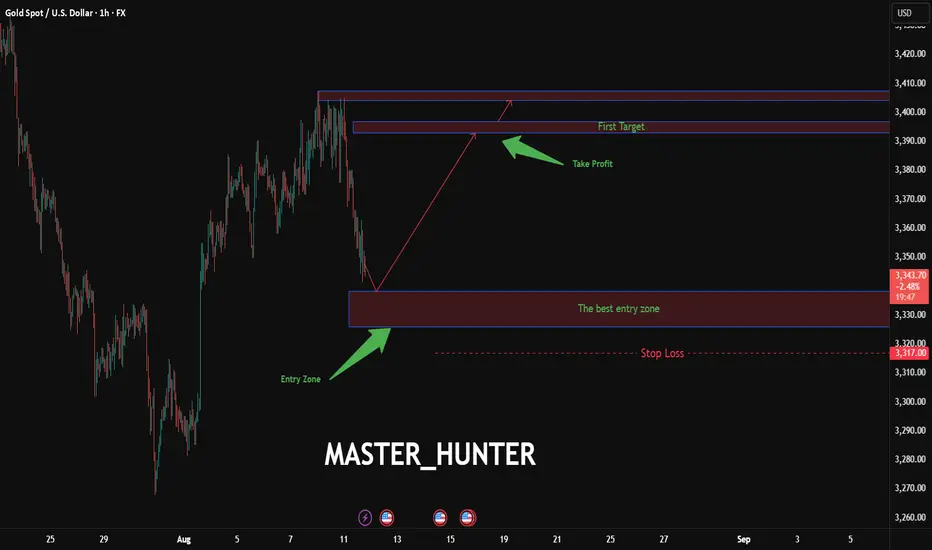
XAU/USD: Gold Rocket to 3407 Unleashed?FX:XAUUSD is primed for a explosive breakout on the 1-hou r chart, with an entry zone at 3326-3338 near a bullish pivot.
First target at 3393 , with a second target at 3407 smashing through resistance.
Set a tight stop at 3317 to lock in risk. A surge past 3340 with volume could ignite this gold rocket. Watch USD weakness and global risk appetite. Get ready to soar!
I will gladly see your comments
#XAUUSD #GoldTrading #ForexSignals #TechnicalAnalysis #TradingView #DayTrading #MarketAnalysis
Gold Technical & Fundamental Update | August 11–15, 2025XAUUSD closed last week near $3,400 after breaking above the resistance of the descending channel. Price action has been choppy, hinting at cautious buying ahead of major U.S. events this week, CPI, PPI, Retail Sales, and Fed commentary.
Key levels:
✅$3,380: Above = bullish bias continues; Below = look for selling setups
✅Support: Former channel resistance now acting as a retest zone
✅Trend guide: Ascending trendlines from the early August recovery
Watch how gold reacts to $3,380 early in the week. This will set the tone for either continuation toward recent highs or a deeper pullback.
#gold #xauusd #forex #technicalanalysis #marketupdate #tradingvie
I’ll update my thoughts in the comments as price action unfolds.
Disclaimer:
Based on experience and what I see on the charts, this is my take. It’s not financial advice—always do your research and consult a licensed advisor before trading.

XAUUS H4 | Market OutlookU.S. Tariff on Swiss Gold Bars Sends Prices Soaring
The Financial Times reports that the U.S. has imposed tariffs on imports of one-kilogram gold bars, a move that has shaken the global gold market recently. The decision was detailed in a July 31 ruling letter from U.S. Customs and Border Protection, sent to a Swiss refinery after it requested clarification on tariff exemptions for certain gold products.
- Earlier this month, Switzerland was among several countries hit with steep new tariffs. While many affected nations trade little with the U.S., Switzerland is a major hub for precious metal refining. As of Thursday, the U.S. tariff on Swiss gold imports has been raised to 39%, a significant blow to a country that exported $61.5 billion worth of gold to the U.S. over the past year. At current volumes, the tariff would add about $24 billion in costs.
- Christoph Wild, president of the Swiss Association of Manufacturers and Traders of Precious Metals, warned that the tax will make it harder to meet U.S. gold demand.
- Earlier this year, before President Trump’s tariffs—dubbed “liberation day”—came into effect, traders rushed to move gold into the U.S., boosting Comex stockpiles but temporarily draining supplies in London. The new tariff announcement did include some exemptions, particularly for certain large gold bars. This matters because the gold trade often flows through Switzerland, where London’s preferred 400-ounce bars are resized into New York’s favored kilo bars.

Gold Price Analysis August 6In the Tokyo session this morning, gold recorded some selling pressure after strong buying pressure in the US session yesterday promoted profit-taking sentiment. It is expected that prices may continue to correct during the Asia-Europe session today before potential buying pressure returns in the London session.
Trading plan:
Scalping SELL: 3375
Support zone to watch for BUY: 3346 – 3333 – 3315 (priority when there is a clear price rejection signal)
Upside target: 3420

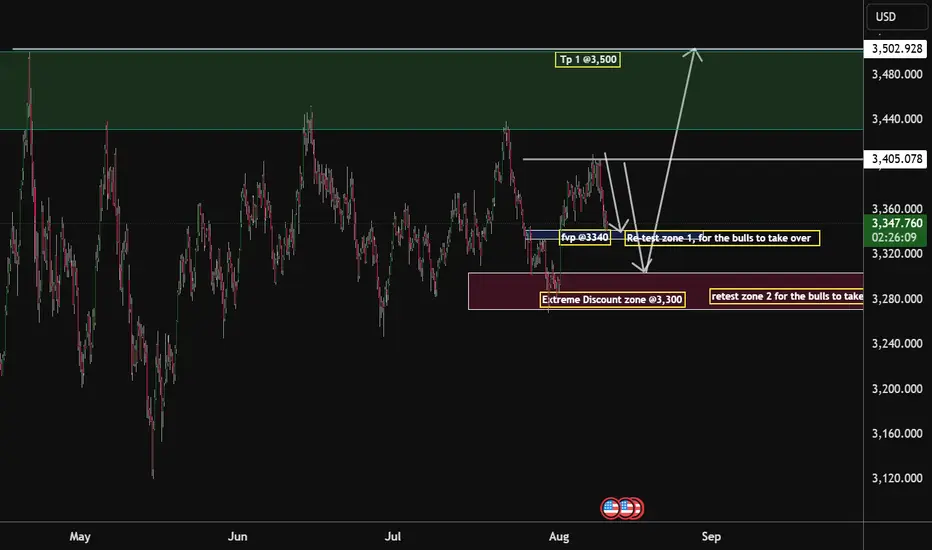
Am with the bulls on this one ahead of the cpi data As we head into a New week, why am a bull on this one is that investors are eyeing the
Rate-Cut Fever: Traders are pricing in a September Fed cut (~90% probability), which weakens the dollar and boosts gold demand Tariff Turbulence & Safe-Haven Flow: U.S. tariff policies—especially recent drama and subsequent exemptions—have kept gold in investors’ crosshairs
Strong Fundamentals: Central banks are still shopping for gold, and ETF inflows are climbing despite elevated prices.
My Tactical Summary is that
Buy dip at Retest Zone (~$3,340) or deeper near $3,300–$3,280. Stop below $3,280; Target $3,415 first, then $3,500 if macro holds
Cautious Watch If CPI or risk-off sentiment hits, expect rejection near $3,380–$3,400. Only go long with a clean move above $3,400 confirmed by macro
My theory is that if the If CPI comes in cooler than expected (lower inflation):
Fed rate-cut expectations will jump from “likely” to “almost certain.”
USD will weaken, yields will drop → Gold likely will have a bull run on that
Retest Zone 1 (~$3,340) could trigger a clean bounce toward $3,400+ almost immediately after the release. The mitigation of the $3,500 handle will have to take effect if the market smells an extended rate-cut cycle.
But on the dovish side now is that
If CPI comes in hotter than expected (higher inflation)
Fed cut odds fade, USD strengthens, yields rise → Gold could drop hard.
The Extreme Discount Zone (~$3,300–$3,280) will become the make-or-break demand area.
If that fails, we could see a quick trip to $3,245 or lower.
My final take
If CPI is bullish for gold → buy retests of $3,340 or $3,400 breakout.
If CPI bearish → short failed $3,340 retest or breakdown of $3,300.
GOLD: Multi-Timeframe Analysis Ahead of FOMCGOLD: Multi-Timeframe Analysis Ahead of FOMC
Gold prices may experience a short-term surge leading up to the FOMC announcement.
But what comes next?
Let’s break down the analysis, step by step.
For deeper insights, watch the full breakdown in the video.
Thank you!

XAUUSD analysis – 1H FVG and OB SetupsOn the 1H gold chart, price recently reacted to the FVG (red zone) at 3410, showing a clean rejection and shifting order flow to the downside.
Below the current price, we have three key bullish OB zones:
First green OB around 3460, acting as the closest demand zone.
Second green OB around 3310, a deeper liquidity zone.
Third green OB at 3287, a stronger higher-timeframe demand that may act as a swing point.
If price retraces back into 3410 and rejects with confirmation in lower timeframes (3m–15m), it could provide a short setup toward the 3460–3310 demand range.
Conversely, if price breaks above 3410 with strong momentum, the bias may shift to testing higher liquidity levels.
📊 ProfitaminFX | Gold, BTC & EUR/USD & Crypto
📚 Daily setups & educational trades

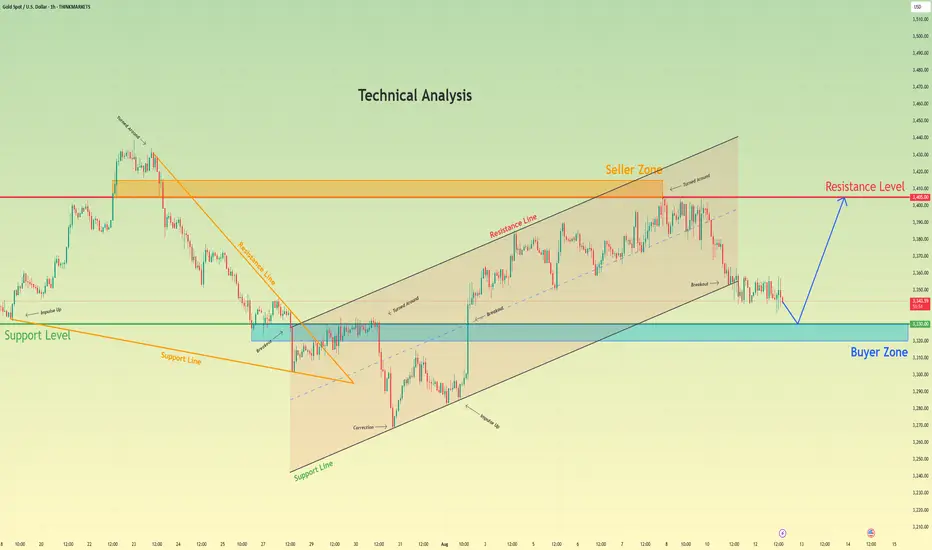
Gold may bounce from support level and rise to resistance levelHello traders, I want share with you my opinion about Gold. The technical narrative for gold has fundamentally shifted from bearish to bullish following a significant breakout from a prior downward wedge. This powerful upward rebound signaled a clear change in market control, invalidating the previous downtrend and establishing a new, constructive market structure. This new structure has taken the form of a well-defined upward channel, which has been guiding the price action higher through a series of impulsive and corrective waves. Currently, the asset is undergoing a natural corrective phase after recently testing the upper resistance line of the channel. This downward correction is guiding the price towards a critical confluence of support located around the 3330 level. This area is significant as it represents the intersection of the channel's ascending support line and a strong horizontal buyer zone. The primary working hypothesis is a long scenario, based on the expectation that buyers will step in to defend this key support confluence and maintain the integrity of the upward channel. A confirmed bounce from this area would likely initiate the next impulsive leg higher within the trend. Therefore, the tp is logically set at the 3405 resistance level, as this represents a full rotation back to the top of the channel and aligns with the major seller zone. Please share this idea with your friends and click Boost 🚀
Disclaimer: As part of ThinkMarkets’ Influencer Program, I am sponsored to share and publish their charts in my analysis.
XAU / USD 4 Hour ChartHello traders. Happy Tuesday. Taking a look at the 4 hour chart, I have marked the area of interest for potential scalp buy / sell trade set ups. Lower time frame confirmation is a must. We have red flag news today here in the US. The news comes out in 3 hours. I will post a lower time frame chart in a bit. Let's see how the current 4 hour candle plays out. Be well and trade the trend. Big G gets all my thanks.
