GOLD short term Analysis. - 15 mins. Gold (XAU/USD) – Harmonic Pattern Analysis (15m Chart)
As of: August 5, 2025
🔶 Pattern Observed: Bearish Harmonic (likely Gartley or Butterfly)
Pattern Completion: Near 3385–3390 zone
The price has tested the PRZ (Potential Reversal Zone) and started showing early signs of weakness.
A clear "Short only below here" marker is drawn just below 3370, signaling key support.
🔻 Short Trade Thesis:
If price breaks and sustains below 3370, bearish confirmation is triggered.
This confirms the harmonic pattern's validity and opens the path for impulsive downside targets.
🎯 Downside Targets (if 3370 breaks):
First target: 3310–3320
Second target: 3265–3270
Final target (extended move): 3180–3200
⚠️ Invalidation:
If price breaks above 3395–3400, the harmonic setup is invalidated.
In such case, avoid any short setups and re-analyze price action for new trend direction.
Conclusion:
This harmonic pattern suggests a high-probability short setup below 3370, with clean targets mapped out. However, it's critically important to wait for confirmation (break and retest or strong momentum candle) before entry. If the price starts moving up from current levels without breaching 3370, this setup becomes invalid.
⚠️ Disclaimer:
This analysis is for educational and informational purposes only and should not be considered as financial advice. Trading commodities and financial instruments involves significant risk and may not be suitable for all investors. Please perform your own due diligence or consult with a licensed financial advisor before making any trading decisions. The author is not liable for any losses incurred based on this analysis.
XAUUSD trade ideas

Gold Poised for a Surge: 3400 in Sight, 3430 Within ReachToday, gold retreated to a low of around 3350 before rebounding again, reaching a high of around 3390. During this process, we seized the opportunity to go long on gold near 3356 and closed the trade by successfully hitting TP: 3380, making a profit of 240 pips!
Although gold retreated after reaching 3390, I had originally planned to short gold near 3395, but gold didn't reach that level during the rally, so our shorting plan had to be shelved. Currently, it's trading in a narrow range around 3380. Clearly, I'm not considering shorting gold after a pullback.
Although gold retreated to around 3350 during the day, it did not destroy the current bullish structure of gold. In addition, gold regained the 3370-3375 area again during the rebound, and the gold bulls became even stronger. Therefore, I have now lost the desire and interest to short gold. Gold has currently reached a high near 3390. Given its current structure and strength, I don't believe 3390 is the current high. Gold is likely to attempt to break through 3400, and even has the potential to continue its rise to the 3420-3430 range. As the center of gravity of gold shifts upward, the current short-term support has moved up to the 3375-3365 area; and the relatively strong support is located in the 3360-3350 area.
Therefore, for short-term trading, I prefer to start trying to go long on gold after it retreats to the 3375-3365 area, and expect gold to hit 3400 as expected, or even continue to the 3420-3430 area.

XAUUSD Chart Analysis – Smart Money Concepts (SMC) Based🔍 XAUUSD Chart Analysis – Smart Money Concepts (SMC) Based
1. Market Structure Overview:
The chart clearly shows a bullish market structure forming after a sequence of Breaks of Structure (BOS) and Change of Character (CHoCH) events.
The market has consistently made Higher Lows, indicating strength from the bulls and institutional order flow to the upside.
2. Key Zones Identified:
✅ Strong Support Zone (Demand Area):
Around $3,260–$3,280, this level has been respected multiple times.
It is marked with BOS, CHoCH, and a Bullish Fair Value Gap (FVG) indicating institutional accumulation and unfilled orders.
The area also contains a Weak Low, which gives price a reason to stay above if bullish sentiment continues.
❌ Strong Resistance Zone (Supply Area):
Around $3,420–$3,460, this area shows signs of Level Rejection and is labeled with Buy-Side Liquidity.
This is where price previously reversed after grabbing liquidity—indicating distribution and possible shorting interest from smart money.
3. Liquidity Zones:
Buy-Side Liquidity: Above recent swing highs near $3,420–$3,440. Price tapped this level and sharply rejected.
Sell-Side Liquidity (Target Area): Currently aiming for the zone around $3,350, which aligns with a recent imbalance (FVG) and a clean liquidity pool below short-term higher lows.
4. Fair Value Gaps (FVGs):
A Bullish FVG is seen mid-chart, where price was rapidly driven up, leaving a gap—price later returned to this zone, respected it, and pushed higher again.
This is a strong sign of institutional entry and provides excellent long entries.
5. Trend Confirmation:
BOS + CHoCH + Higher Lows = Bullish Bias.
Each low is forming higher than the previous, with strong rejections from demand zones.
6. Entry & Target Insight:
Entry Point: After price reacted from support and printed another Higher Low.
Target: Currently price is targeting $3,350 (short-term retracement or pullback target).
This target is likely an internal liquidity sweep before potential continuation to retest the resistance zone again.
7. Educational Takeaways:
Market Structure is King: Observe BOS/CHoCH for directional bias.
Liquidity Matters: Understand where liquidity is resting—price seeks it.
FVG as Entry Tool: Fair Value Gaps provide high-probability trade setups when aligned with structure.
Patience at Key Zones: Wait for confirmations at resistance/support rather than impulsive trades.
✅ Summary:
Bias: Bullish, until structure breaks.
Short-Term Target: $3,350 (as per the chart).
Long-Term View: If price maintains higher lows, potential revisit to the resistance zone ($3,420–$3,460) is likely.
Invalidation Level: Break and close below strong support ($3,260) would shift bias.

XAU/USD – Bearish Momentum Building: Circle 2 Top In?OANDA:XAUUSD
We have now completed a 1-2-3-4-5 structure to the downside (in white).
Following that, we got a counter-correction in the form of an A-B-C, which potentially marks the completion of our yellow (Circle) Wave 2 🟡.
However, it’s not confirmed just yet — we still have two additional Fibonacci levels at 3400 and 3418, which could act as resistance zones and final topping areas for Circle 2.
We are now anticipating a 1-2-3-4-5 impulse into Circle 3, as already illustrated in yellow 🟡.
So at the moment, bias remains bearish 🔻.
Should we break above the Fibonacci levels mentioned, I do have an alternative scenario in mind — an ABCDE triangle formation that may have developed over the past months.
If that becomes relevant, I’ll make a separate upload for it 📌.
For now, I'm actively looking for sell positions, and I’ve already entered shorts ✅.

GOLD - Cut n Reverse Area? Holds or not??#GOLD... market perfect moved as per our analysis and now m
It's just reached at his current ultimate area that is 3404
Keep close with and holding of that area means drop...
NOTE: we will cut n reverse above althat area on confirmation.
Good luck
Trade wisely
Buy and sell level goldNow already showing upside momentum
3384-3398 level gonna week as it already responded yesterday
Now again reached to this level
We expecting that it will break now this level and straight towards 3430

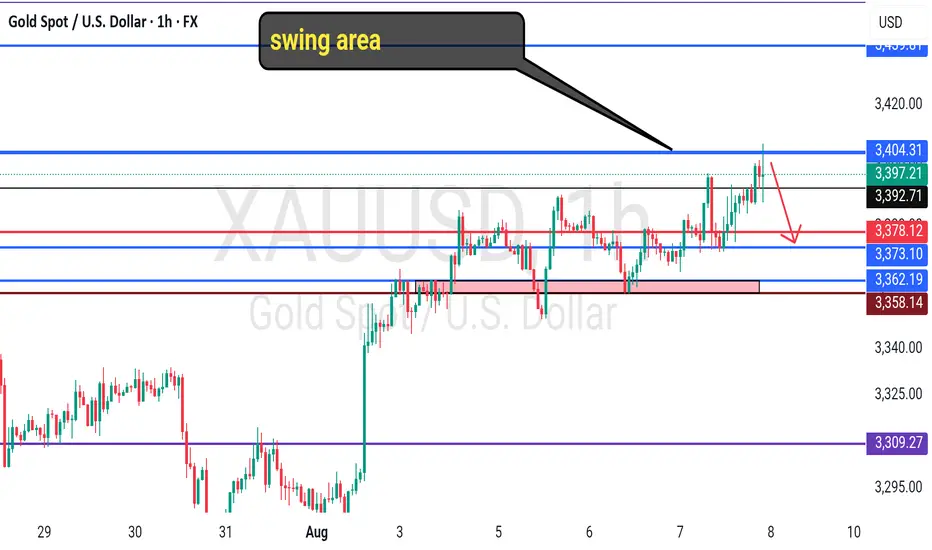
GOLD Weekly View📌 Mark your reference points — key levels or order blocks on the chart.
📌 Wait for price to reach them — there’s no need to be in the market all the time.
📌 Once price reaches your level, allow 10–40 candles to form. This is critical. Why? Because during this time, the market goes through its usual phases:
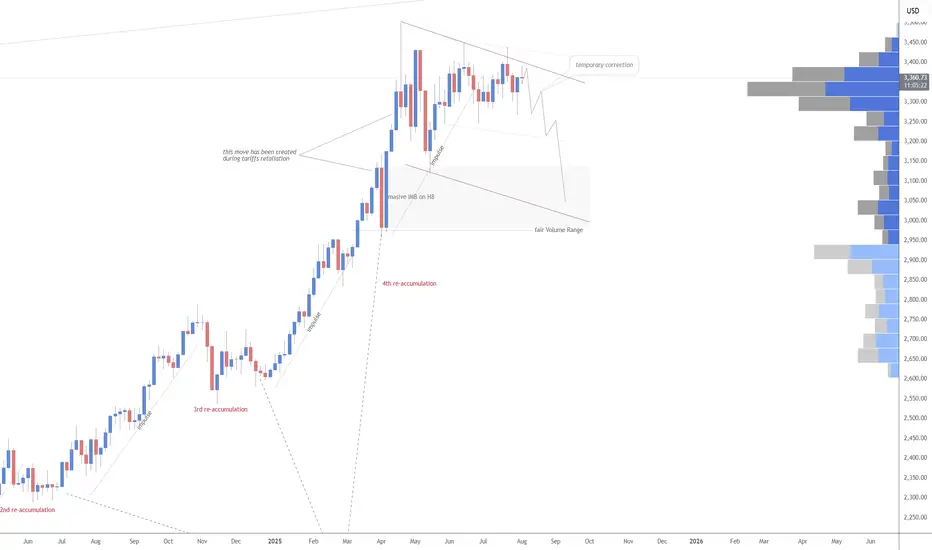
1. Accumulation
2. Manipulation
3. Distribution (which results from accumulation)
💡This is the natural cycle: cause and effect.
You don’t want to get trapped in the accumulation or manipulation phases, that’s where most traders get liquidated.
Instead, wait for structure to form inside your reference point or order block. Once structure is clear, you’ll often spot a QML (Quasimodo Level) and that’s your entry trigger.
💡You don’t need to be the first buyer or seller. You just need to enter at the right time, with clarity and confirmation. Let the market come to you, and let it show its hand before you act.
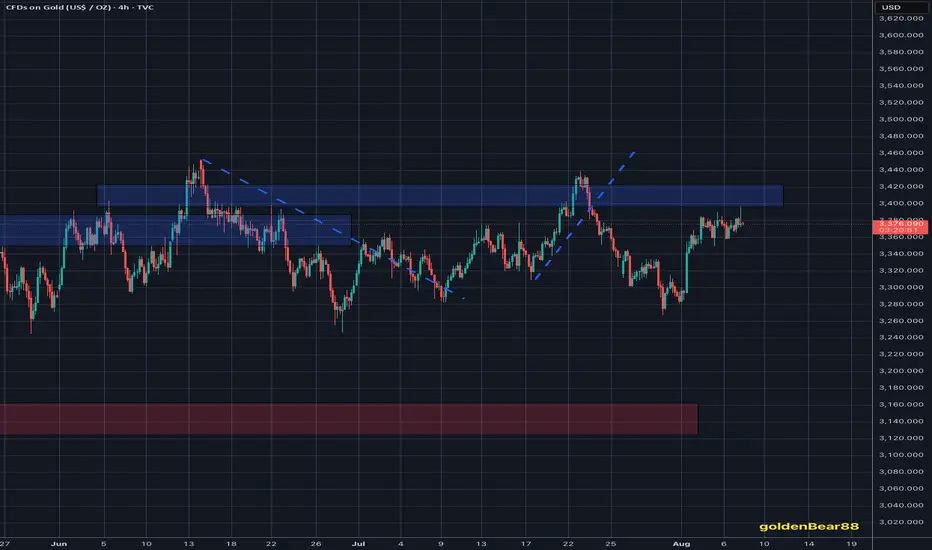
Gold Analysis: Short Selling is ExpectedThe short selling point is expected from the upper resistance, as this resistance is very strong.

Gold extending Buying sequenceAs discussed throughout my Tuesday's session commentary: "My position: I will keep Buying every dip on Gold from my key entry points / #3,357.80 is one of them expecting final push above the Resistance zone towards #3,400.80 benchmark."
If you have been Buying every dip as per my suggestion you would be in excellent Profits now. I have been Buying Gold from my #3,357.80, #3,367.80, #3,372.80 and #3,378.80 key entry points (last batch of Buying orders closed with Target late U.S. - early Asian session last night).
Technical analysis: Gold is under unprecedented Volatility (however with Bullish underlying trend) with Gold (Xau-Usd Spot) and the Futures price on a tight spread. This is of course the product of heavy speculation in the Metals market, fuelled by the expectation that the Fed’s new talks will be accepted. Needless to mention, this environment is Gold friendly. Technically I do see current aggressive decline in form of a correction as not sustainable however I cannot approach current configuration Technically since these are Fundamentally driven sessions but I do expect a slight pullback back towards #3,352.80 - #3,357.80 only for Gold to soar even more, as the main Support and Higher High’s High’s / Low’s cluster is nearby (#3,357.80 - #3,367.80). Despite Bond Yields stabilization, the continuous Low’s on DX on parabolic decline are adding Buying pressure on Gold and limiting all Selling advance which I am utilizing to it's maximum with my set of Buying orders.
XAUUSDlook TF M5
Entry Setup and Risk Management:
Active Buy Limit at 3,368.00 (Volume: 10 million USD)
Entry is pending at the lower Order Block (OB) zone and the imbalance area.
SL (Stop Loss): Around 3,365.00
TP (Take Profit): 3,381.00 – 3,381.70
Manual Buy at 3,370.41 and 3,370.49 (Volume: 5 million USD each)
Both positions are currently open, targeting the same TP area — the Daily OB zone.
Price Confirmation:
The current price is around 3,371.73, showing bullish potential (upward reversal).
There is a bullish reac

Gold Reversal in Progress - Sell Signal Confirmed Below 3375Hello IGT FOLLOWERS
Here is my Gold overview, Gold is showing weakness after rejecting resistance near 3378/3390. Price is giving rejection from the resistance level again and again, indicating bearish momentum. A break below 3360 could confirm further downside till 3330..
Key points :
Entry point : 3375
Resistance area : 3378/3390
Support Area : 3338/3330
Follow me for more latest updates and signals

GOLD DAY END SELLStoploss is based on 4h wick window
Red rectangles are block that keep price squished
Ideally see this hour close at >50% of previous buy body
and make a clean daily body candle, which then tomorrow oscillates or pushes further down

GOLD LONG FROM SUPPORT
GOLD SIGNAL
Trade Direction: long
Entry Level: 3,359.88
Target Level: 3,392.28
Stop Loss: 3,338.21
RISK PROFILE
Risk level: medium
Suggested risk: 1%
Timeframe: 4h
Disclosure: I am part of Trade Nation's Influencer program and receive a monthly fee for using their TradingView charts in my analysis.
✅LIKE AND COMMENT MY IDEAS✅

Gold long from 3344Looking for longs at around this region.
Waitinng for asian session to open and then i will see if it sweeps the 3340 level or it does reverse from here without sweeping ,regardless longs look good from here.

shorti see a very good sell on XAUUSD and it might be ranging between the accending channel which is good for scalping but since it's Friday i'm not taking any trades

Will Gold Make a New High Amid Prospect of Sep Fed Rate Cut?Fundamental approach:
- Gold gained this week, supported by renewed trade tensions following new US tariffs on major partners and rising expectations of a Fed rate cut in Sep.
- Safe-haven demand strengthened after weak US NFP data heightened concerns about economic growth and reinforced market bets on monetary easing, while US President Trump's tariff announcements drove risk aversion.
- Comments from Fed officials signaled openness to policy adjustments, keeping investors focused on future rate moves even as the US dollar softened and global equities stabilized.
- XAUUSD could remain resilient if upcoming US labor and inflation data continue to disappoint.
Technical approach:
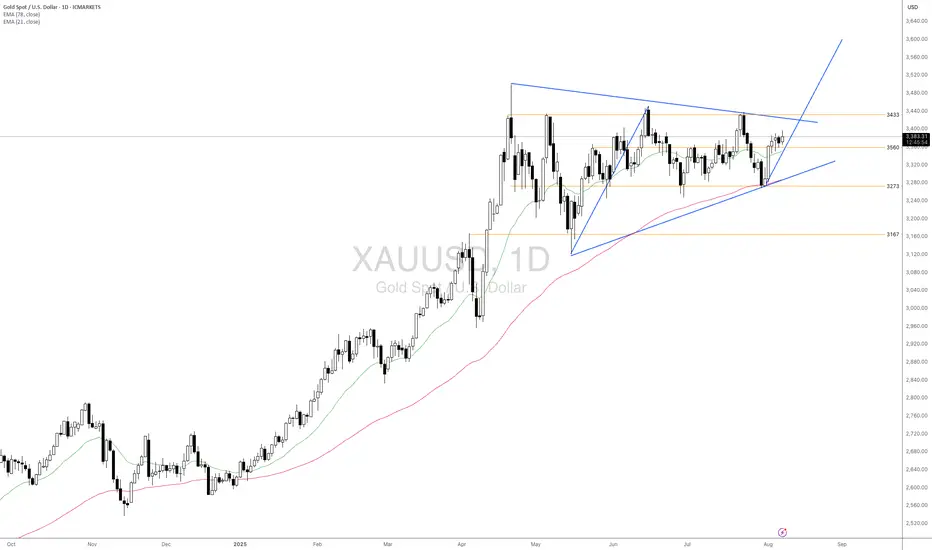
- XAUUSD fluctuates within a broad range. The price is forming a big Triangle Formation, awaiting an apparent breakout to determine the next movement.
- If XAUUSD breaches above the Triangle Pattern and the resistance at 3433, the price may continue to advance with the measured target at 3600.
- On the contrary, closing below support at 3560 may prompt XAUUSD to continue range-bound movement by retesting support at 3273.
Analysis by: Dat Tong, Senior Financial Markets Strategist at Exness
XAU/USD Technical Analysis (1H Chart)Based on the 1-hour chart, XAU/USD is currently at a critical juncture, presenting a potential short-selling opportunity. The analysis is based on a confluence of technical factors.
Key Observations:
Minor Bearish Trend: The price is trading within a well-defined descending channel, indicating a short-term bearish trend. The market has been forming a series of lower highs and lower lows since the peak around the 06:00 mark on August 6th.
Fibonacci and Trendline Confluence: The current price is testing a significant resistance zone. This area is a cluster of multiple technical indicators:
Descending Trendline: The price is directly touching the upper boundary of the bearish channel, which is acting as dynamic resistance.
Fibonacci Retracement: The price has retraced up to the 0.618 Fibonacci level, a key area where sellers often step in to push the price back down.
Moving Averages: The price is trading below the faster-moving averages (red, green, blue lines), which are also beginning to slope downwards, adding to the bearish sentiment.
Trade Scenario:
The chart highlights a potential short (sell) trade setup:
Entry: Around the current price level (~3,372.130), capitalizing on the resistance from the trendline and Fibonacci cluster.
Stop Loss: Placed above the recent swing high and the resistance zone, around 3,378.000. This protects the position against a breakout above the channel.
Take Profit: Targeted at a lower support level, around 3,338.000.
Conclusion:
The outlook for XAU/USD in the short term is bearish. The price is facing strong resistance at the confluence of the descending trendline and the 0.618 Fibonacci level. As long as the price remains below this resistance cluster, a continuation of the downward move towards the target of 3,338.000 is likely. A break and close above the 3,378.000 level would invalidate this bearish scenario.

Gold still Trading in Bullish territoryTechnical analysis: No strong Bullish impulse regarding yesterday's U.S. session opening, as Gold didn’t extended recovery candles and finally invalidated both Resistances in one hit / try (I cannot treat #3,382.80 as an breakout since strong Volatility Gold is Trading under). This is a typical sign that the market should continue consolidating, waiting for a catalyst to extend Buying motion. Since Gold is Buying every Bottom since #2023 Year as fractal which is repeated #3 times statistically, every variance that Gold repeats #3 times or more, it becomes a cycle which every Gold Trader should take into consideration. As Fed commentary usually arise Buyers on the aftermath - Gold continues the Buying sentiment, engages the consolidation Rectangle (lately #5-session consecutive run of #20 point Trading on average), then engages the steeper decline. Regarding all mentioned above, I can expect Trading to be performed above #3,377.80 - #3,382.80 hard Resistance zone where Gold can engage the consolidation Rectangle above (Stabilization area as I prefer calling it), and then again deliver Lower High’s extension once local High's are Priced in. Fundamentally, the Risk-off sentiment that DX Investors had these past few sessions should fade away after this result as Investors will remove capital from riskier assets such as DX and Bond Yields, and can go back to safe-haven metals such as Gold with confidence. Meaning that if DX continues to lose value after NFP debacle, Bond Yields should benefit along with the Stock markets, which can kick-start the Buying sequence on Gold, and vice-versa.
My position: I will keep Buying every dip on Gold from my key entry points / #3,357.80 is one of them expecting final push above the Resistance zone towards #3,400.80 benchmark.

Gold Trade Plan 11/08/2025Dear Traders,
Market will be Range , and i expect price move between 3255-3280 Today,
No News ,No big movement !!
Regards,
Alireza!

Roadmap to 3982: Key Long Entries and Profit ZonesThe initial long entry zone is between 3290 and 3275 .
From this range, an uptrend is expected to begin, targeting 3416 , which is our first exit point to close the initial long position.
After that, we wait for the next long entry , ideally around 3333 to 3319 . A new upward movement from this range is expected to reach 3455 . At this level, we continue to hold the position while placing the stop loss at the entry level to protect profits.
The next take profit target is 3650 , which may be reached by the end of 2025 or in 2026.
The final target is 3982 , which is likely to be hit in 2026, as the market may not have enough strength to reach it in 2025.

Gold Trade Plan 08/08/2025Dear Trader,
The price has reached a very important zone, and I expect a correction at least to the 3350 zone. If 3350 is broken, I anticipate a move to the 3300 zone.
Regards,
Alireza!

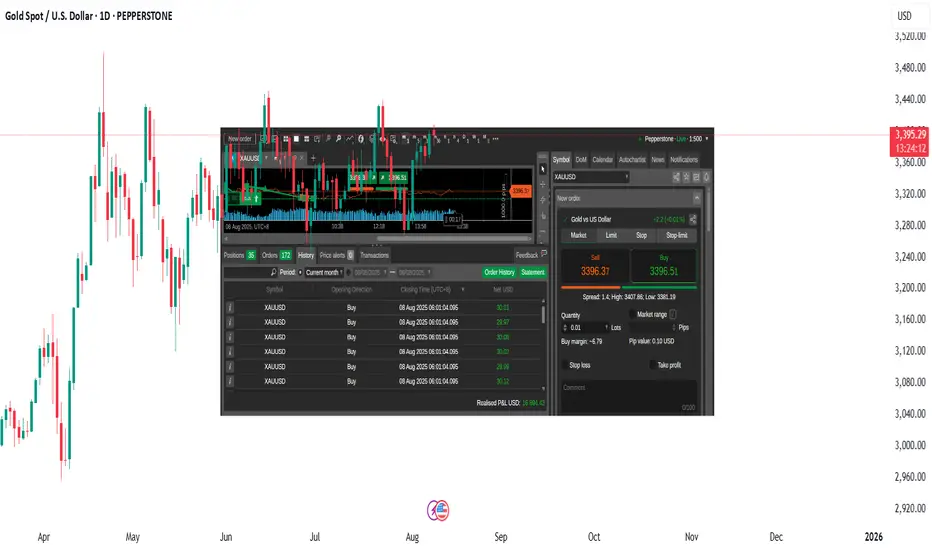
Up 16K USD Profit For The Month On XAUUSD Momentum TradingXAUUSD is again making these ranges as it goes up. If you can identify these ranges then you can do a short trade on the resistance levels and a long trade on support levels. XAUUSD is trending up overall but if you are a trend-follower then you will have a hard time timing your entries just because of the ranges XAUUSD is making. It will go up to 3,400 then go back down to 3380 then back again to 3,400 then down again to 3375. Momentum trading is the best approach. You short the tops. Go long on bottoms. Get in, get out. I currently have 16,894 usd realized profit on XAUUSD this month doing momentum trading. I'm trading a live account. FED will probably cut rate soon and there will be a lot of bullish predictions on XAUUSD but I highly suggest to just trade the chart. Do not have any opinion on where the market or the price will go. Let the price move and just react. No one can predict the market. Trade your chart. May you trade well.