Today's bulls sprint to 3400
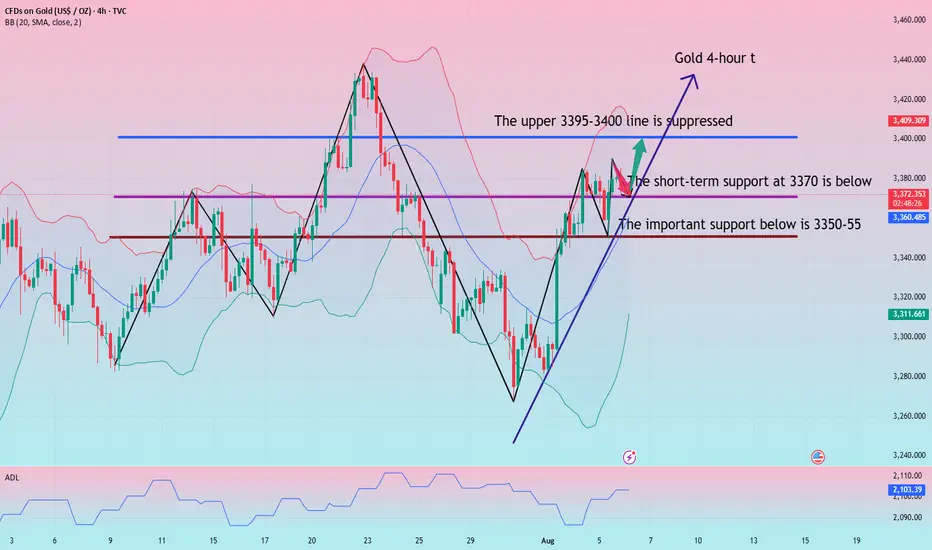
Based on the 4-hour chart, short-term support is currently at 3370, with 3350 being the dividing line between bullish and bearish strength. If the daily chart stabilizes above this level, the bullish trend remains unchanged. However, caution should be exercised when entering short positions against the trend until the daily chart breaks below 3350. I will update you on the specific trading strategy during the trading session.
Gold Trading Strategy:
Go long on gold dips to 3370-73, and add to your long position on dips to 3350-55. Set a stop-loss at 3343, and target 3390-3395. Hold if it breaks above this level.
XAUUSD trade ideas
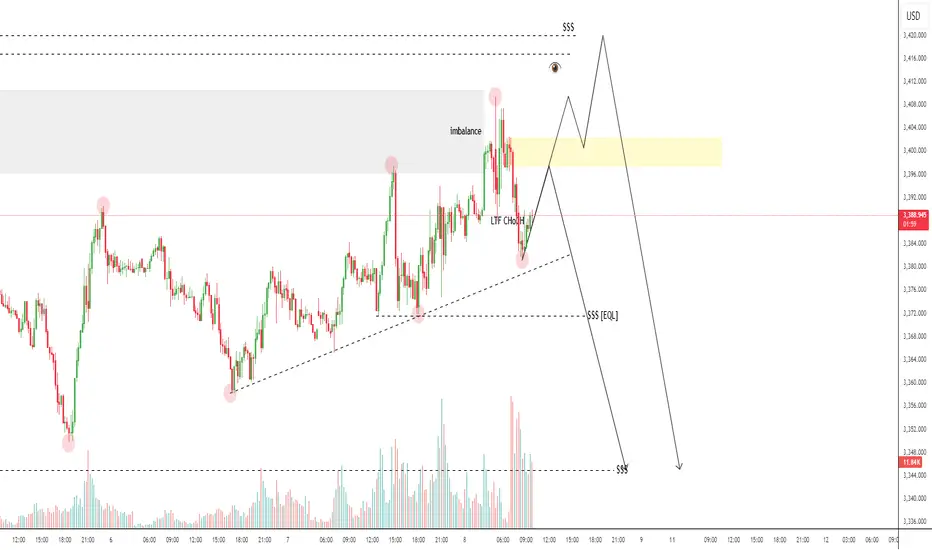
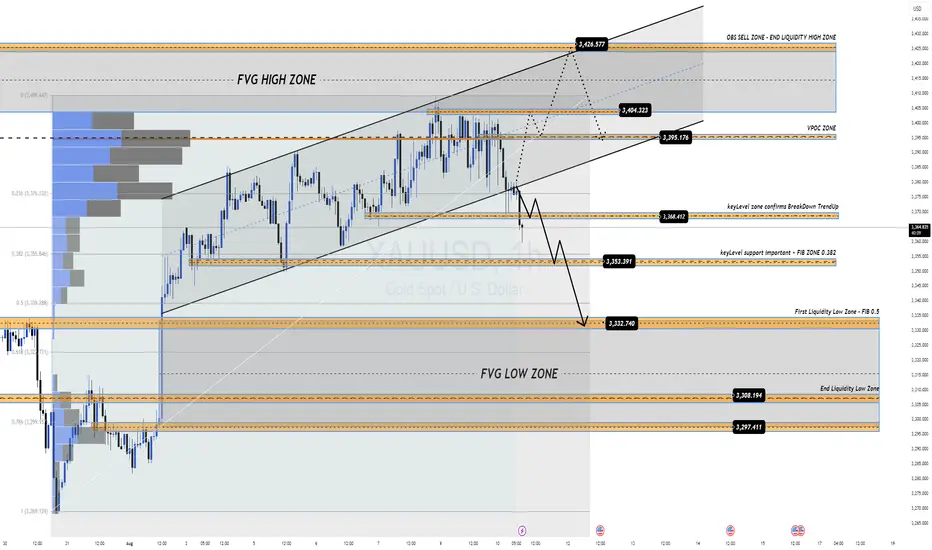
Gold Market Insight – Daily FlowGold market mitigated daily supply at 3389, triggering a price plunge aimed at clearing imbalance through the 3332 zone. This move reflects the bearish reaction to overhead supply and the market’s intent to correct inefficiencies before any potential reversal.
🟡 Key Zones:
Supply Mitigated: 3389
Imbalance Targeted: 3332
Watch for: Buyer reaction near 3332 for signs of bullish defense or continuation toward lower demand zones. follow for more insights , comment and boost idea

Gold - Breakout and retest of a bullish FlagBullish flag break out and price is in a demand zone. As long as the demand holds, pressure will be to the upside.

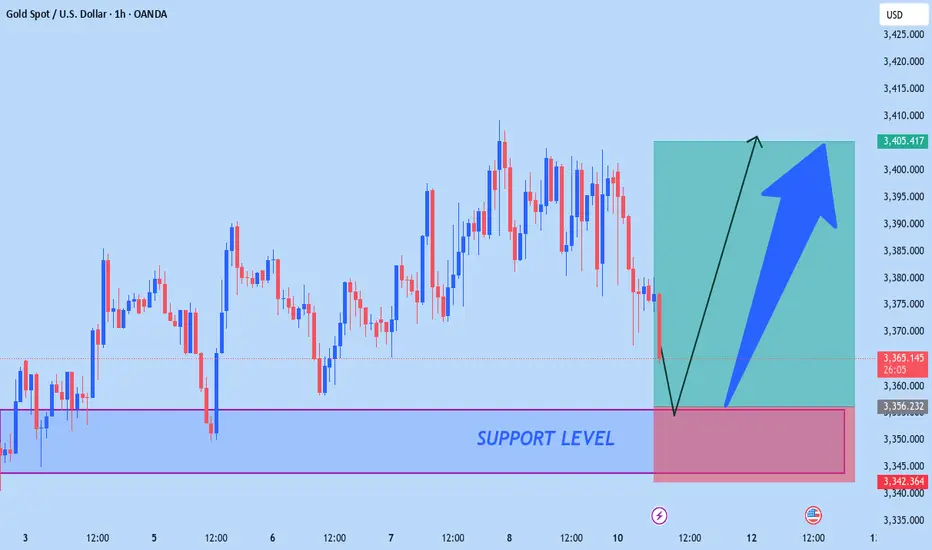
XAUUSD CAN FLY HIGHAccording to H1 analysis Gold market is in falling pressure from morning so wait for good opportunity market will be back from SUPPORT LEVEL if you want to go LONG position then go from SUPPORT LEVEL it is best for you use proper money management
TRADE AT YOUR OWN RISK
REGARD ALBERT
Gold (XAU/USD) Technical Analysis – August 11, 2025📊 Gold (XAU/USD) Technical Analysis – August 11, 2025
As anticipated in my previous analysis, gold dropped precisely from the midline of the channel and the descending trendline, showing a strong bearish rejection. Currently, the price is hovering near the $3,338 support.
🔹 Bullish Scenario:
If this support holds and we see strong bullish confirmation candles, gold could start a rebound. The first upside target is $3,359, followed by $3,370 and $3,375, which aligns with the broken ascending pink trendline, suggesting a potential pullback retest. If this level is broken, the next target will be the descending blue trendline.
🔹 Bearish Scenario:
If the $3,338 support breaks, the next key level to watch is $3,332, followed by $3,312 and finally the channel bottom support.
📌 Summary:
Gold is now at a critical decision point. Watch for confirmation signals at $3,338 to determine whether we get a bullish pullback or further downside movement.

Strike with precision and win in the gold trading market!Gold continues to fluctuate in an upward structure, with lows gradually rising, showing that the bulls are still in a dominant position. The current key support has moved up to the 3360 line. Before this position is effectively broken, the overall idea is to maintain a low-long strategy. It should be noted that the current market has been consolidating at a high level for three consecutive days, and has the basis for further strengthening. It is not advisable to wait for a sharp pullback at this time, but to pay attention to the continuity opportunities of direct pull-ups. It is recommended to seize the strong continuation opportunities in the current period in terms of operations, and strategically postpone it to the European and American trading sessions for simultaneous execution. Specifically pay attention to the long order layout opportunities in the support area of 3375-3360, and the upper resistance is around 3390-3405. Overall, we should flexibly participate in the high-altitude and low-long rhythm in this range. It is recommended to wait and see in the middle position, chase orders cautiously, and wait patiently for key points to enter the market.

GOLD H4 | Could the price reverse from here?XAU/USD is reacting off the sell entry at 3,382.85, which is a pullback resistance and could reverse from this level to the take profit.
Stop loss is at 3,432.37, which is a swing high resistance.
Take profit is at 3,333.65, which is a pullback support that is slightly above the 50% Fibonacci retracement.
High Risk Investment Warning
Trading Forex/CFDs on margin carries a high level of risk and may not be suitable for all investors. Leverage can work against you.
Stratos Markets Limited (tradu.com ):
CFDs are complex instruments and come with a high risk of losing money rapidly due to leverage. 65% of retail investor accounts lose money when trading CFDs with this provider. You should consider whether you understand how CFDs work and whether you can afford to take the high risk of losing your money.
Stratos Europe Ltd (tradu.com ):
CFDs are complex instruments and come with a high risk of losing money rapidly due to leverage. 66% of retail investor accounts lose money when trading CFDs with this provider. You should consider whether you understand how CFDs work and whether you can afford to take the high risk of losing your money.
Stratos Global LLC (tradu.com ):
Losses can exceed deposits.
Please be advised that the information presented on TradingView is provided to Tradu (‘Company’, ‘we’) by a third-party provider (‘TFA Global Pte Ltd’). Please be reminded that you are solely responsible for the trading decisions on your account. There is a very high degree of risk involved in trading. Any information and/or content is intended entirely for research, educational and informational purposes only and does not constitute investment or consultation advice or investment strategy. The information is not tailored to the investment needs of any specific person and therefore does not involve a consideration of any of the investment objectives, financial situation or needs of any viewer that may receive it. Kindly also note that past performance is not a reliable indicator of future results. Actual results may differ materially from those anticipated in forward-looking or past performance statements. We assume no liability as to the accuracy or completeness of any of the information and/or content provided herein and the Company cannot be held responsible for any omission, mistake nor for any loss or damage including without limitation to any loss of profit which may arise from reliance on any information supplied by TFA Global Pte Ltd.
The speaker(s) is neither an employee, agent nor representative of Tradu and is therefore acting independently. The opinions given are their own, constitute general market commentary, and do not constitute the opinion or advice of Tradu or any form of personal or investment advice. Tradu neither endorses nor guarantees offerings of third-party speakers, nor is Tradu responsible for the content, veracity or opinions of third-party speakers, presenters or participants.

The best ambush point for short positions below gold 3400.The daily structure of gold still maintains a bullish dominant pattern. The upper target is the upper Bollinger band of 3400. If it breaks through this position, the upside space will be further opened up. The 4-hour Bollinger band is gradually closing, and the price is fluctuating in the range of 3400-3360. In the short term, it is still treated with range thinking. Before an effective breakthrough, the operation can adopt a high-altitude and low-long strategy. Gold is currently at a critical node of change. If it rises and falls in the evening, it may release a temporary peak signal. The area below 3400 is expected to become an opportunity for the layout of medium-term short positions. The overall recommendation is to remain cautious, respond flexibly to changes in rhythm, and strictly control risks.
Gold operation suggestion: You can continue to try short selling in the 3390-3400 range, with the target at 3380-3370.

GOLD Short tradeOANDA:XAUUSD Short trade, with my back testing of this strategy, Short correction.
This is good trade.
Don't overload your risk like Greedy Gambler!!!
Be disciplined trader.
Use proper risk management
Looks like good trade.
Lets monitor.
Use proper risk management.
Disclaimer: only idea, not advice

Grasp the trend accurately and have a crazy weekend!After testing the 3380 support level several times in a row today, gold maintained an oscillating upward trend. Today's layout of 3380 repeatedly went long, and 3400 shorts were all successfully closed with profits, with a total profit of 580pips. Currently, gold is oscillating at a high level in the 3404-3380 range. The possibility of a direction choice cannot be ruled out in the evening. If the market continues to be bullish in the evening, it is necessary to pay attention to whether the price will fall below 3380 when it tests the support level for the third time. If the support level is effectively broken, it is expected to fall to the key support level of 3370. If the price firmly stands above the 3400 mark, it may continue to test 3410. If there is no breakthrough either above or below, it will still maintain a range of oscillations, and the idea of selling high and buying low will be the main focus.

What does it matter if every step is just right?Today's gold fluctuation rhythm is basically consistent with our prediction. The rhythm from entry to profit-taking is clear, and the strategy is executed decisively. First, we decisively arranged long orders at the 3365-3370 line, and successfully took profit at the target line 3375, earning 150pips of profit. Then we decisively reversed and arranged short orders at 3375. The market fell back to around 3360 as expected, and realized 150pips of profit again. In the third round of operations, long orders were entered again near 3352, and the price rose smoothly to 3370 to take profit again. The overall rhythm was tight and profits were steadily pocketed. At present, gold has rebounded to around 3380-3385. We have deployed a new round of short orders in advance and will wait for the price to drop before arranging long orders. Overall, gold is in a volatile rhythm. Even if there is still room for upward movement in the future, it is likely to undergo a round of technical retracement adjustments first.
Gold Bulls Unshaken, 3400 in FocusGold prices retreated from a high of 3385 today, currently hitting a low near 3358. How far will gold fall? Are the bears back in control? I'm not worried about a gold pullback, but rather a lack of one, because only a pullback can provide a good entry opportunity. Clearly, I remain bullish on gold and optimistic about it reaching the 3400 mark.
Because gold fell all the way to around 3358, some voices in the market began to tout the strong return of the bears, but I remained unmoved. When many people were once in self-doubt, I was quietly taking advantage of the gold pullback to accumulate funds in batches and pick up bargains. We can clearly see that gold did not destroy the bullish structure during the decline, and as gold rebounded, the 3360-3350 area has become a dense trading area, indicating strong buying support. After the technical top and bottom conversion, it has become a relatively solid support area. It may be difficult for gold to fall below this support area in the short term.
So, why has gold repeatedly encountered resistance and retreated? I believe that gold has encountered resistance and retreated in the 3385-3390 area many times in order to repeatedly test the effectiveness of support and consolidate the strength of support. It is also to increase liquidity during the retreat period, thereby accumulating more upward momentum so that gold can rise further and break through the 3400 mark.
So I still hold a long position in gold, and I have not lost confidence in the gold bulls. On the contrary, I still expect that gold will be able to hit 3400 in one fell swoop after repeatedly testing the support, or even continue to rise to the 3420-3430 area.

What you see are fluctuations, what I see are opportunities!Gold prices are rising as expected, with long positions perfectly fulfilled and periodic profits successfully secured. Currently, prices are once again encountering resistance at 3390. A clear bearish engulfing pattern has formed on the short-term hourly chart, suggesting weakening short-term momentum and increasing risk of a pullback. From a cyclical perspective, today marks the fifth trading day of gold's rebound, and technically, a periodic adjustment is necessary. A break below 3370 today will essentially confirm the establishment of a short-term top, and the market structure may shift into a phase of decline. Regarding trading recommendations, we recommend continuing to short on rallies around 3390 as a key resistance level, with short-term targets focused on 3370-3360. A subsequent break below this level with significant volume could open up further downside potential. Market sentiment is shifting rapidly at this time, so it is crucial to strictly enforce risk management discipline, avoid blindly chasing orders, and maintain a flexible and forward-looking strategy.

Gold Price Action Breakdown Key Liquidity Sweep + RB ReactionClean gold as price respected the Monday Rejection Block and swept key liquidity zones just as mapped. In this breakdown, I explain the logic behind the move, what I was expecting, and what actually played out.
💡 If you enjoy these trade breakdowns and want to go deeper into mindset, risk, and precision strategy I share extra lessons, insights, and psychology tips over on the blog. Just check the link in bio/profile for more.
Stay sharp and focused. Less is more. 🎯

GOLD ROUTE MAP UPDATEHey Everyone,
What a PIPTASTIC finish to the week! 🚀. We tracked the move down with precision durung the week and then rode the momentum right back up.
Yesterday, we confirmed the swing range activation and bounce, and that bullish follow through carried beautifully into today, completing our Bullish Target at 3348. Just perfect execution all around.
BULLISH TARGET
3348 - DONE
BEARISH TARGETS
3328 - DONE
EMA5 CROSS AND LOCK BELOW 3328 WILL OPEN THE FOLLOWING BEARISH TARGET
3305 - DONE
EMA5 CROSS AND LOCK BELOW 3305 WILL OPEN THE SWING RANGE
3289 - DONE
3267 - DONE
We will now come back Sunday with a full multi timeframe analysis to prepare for next week’s setups, including updated views on the higher timeframes, EMA alignments, and structure expectations going forward.
Thanks again for all your likes, comments, and follows.
Wishing you all a fantastic weekend!!
Mr Gold
GoldViewFX

XAUUSD: Adjustment Phase and Future OutlookHello everyone, today let's analyze the current movements of XAUUSD.
Currently, gold has gone through a period of adjustment, as the bulls were unable to push the price above the 3,400 USD level. Market instability has caused gold to pause its upward trend and enter a liquidation phase.
This adjustment reflects a cautious sentiment from investors in Asia. The 3,400 USD level remains a significant barrier, and this has become even clearer with factors such as weak data from China (PPI -3.6%) and uncertainties surrounding US-China trade talks putting pressure on gold's price. Additionally, expectations regarding the US inflation report and uncertainty in the semiconductor policy are hindering gold’s upward momentum. These factors reduce gold’s appeal as a safe-haven asset.
The key focus now is the trading range between 3,400 and 3,350 USD. Before further upward movement, the market may need to test this support level again.
We are now witnessing a retest of 3,358 USD with a false breakout, and the market’s response at this level is relatively weak. In the short term, gold may continue to adjust towards 3,350-3,345 USD. However, if the bulls can maintain the price above this level, a recovery seems a plausible scenario.
What are your thoughts on gold’s ability to maintain above the current support level? Could the market soon rebound and resume its upward trend?

XAU/USD -4H- ELLIOT WAVE LONG SETUPWave count shows a clean completion of WXYXZ on the downside, followed by impulsive waves (1)-(2)-(3).
Price is currently retracing into the expected wave (4) correction zone between 3,325 and 3,345, aligned with OB + FVG.
A new rally toward wave (5) targeting 3,478 USD is expected after the correction completes.
🔹 Buy Zone: 3,325 – 3,345
🛡️ SL: 3,310
🎯 TP: 3,478
📈 Buy Confidence: 91%
⚠️ Pure technical view. Not financial advice.
#Gold #XAUUSD #ElliottWave #WaveAnalysis #Forex #TechnicalAnalysis #TradingView

Will We See a Break Down or a Sharp Rebound to Key Resistance?XAUUSD – Will We See a Break Down or a Sharp Rebound to Key Resistance? | MMFlow Trading 🔥
Market Overview
Gold dropped sharply at the start of the week as profit-taking hit the market and late-week FOMO buyers from last week were stopped out.
Buy-side momentum has clearly slowed, and sellers are waiting for a confirmed breakdown from the rising channel to target lower liquidity zones around 335x and 333x.
At present, price is reacting around the 336x – 337x key support with an H1 long-wick candle showing buying pressure.
Trading Outlook
We need a clear breakdown confirmation (candle close with volume) before executing a short entry.
If price holds and fails to break, we could see a rebound back towards major resistance zones 339x – 340x – 342x.
This week is loaded with high-impact USD data – CPI & PPI – both strong inflation indicators that could put short-term pressure on gold if data comes out USD-positive.
📌 Trading Plan
BUY SCALP
Entry: 3353 – 3351
Stop Loss: 3345
Targets: 3358 → 3362 → 3366 → 3370 → 3375 → 3380
BUY ZONE
Entry: 3332 – 3330
Stop Loss: 3325
Targets: 3336 → 3340 → 3345 → 3350 → 3360 → 3370 → 3380
SELL SCALP
Entry: 3394 – 3396
Stop Loss: 3400
Targets: 3390 → 3385 → 3380 → 3370 → 3360
SELL ZONE
Entry: 3425 – 3427
Stop Loss: 3430
Targets: 3420 → 3415 → 3410 → 3405 → 3400 → 3390 → 3380
⚠ Risk Management Notes
This is a high-impact news week – expect false breakouts before and after CPI/PPI releases.
Avoid oversized positions into news; keep risk tight.
If price breaks above 3430 with strong volume, the current sell setup is invalid → wait for a new market structure before re-entering.
Weekly Analysis on GOLDFor next week trading session i will be waiting for buy trade set up since market is still in a strong bullish trend.

XAUUSD Bearish SMC Analysis – Institutional RejectionXAUUSD Bearish SMC Analysis – Institutional Rejection from Supply Zone
Gold (XAUUSD) is showing a clear bearish structure after rejecting a major supply zone at premium pricing. This setup is aligned with Smart Money Concepts (SMC) and reflects how institutions manipulate liquidity and order flow before major price moves.
🔍 Market Structure Context:
The market had been trending upward with higher highs and higher lows, until it approached a key premium supply zone near $3,420.
At this level, price stalled, creating internal Equal Highs (liquidity) — a common trap used by institutions to grab orders before reversing.
🔄 Change of Character (CHoCH):
A clear CHoCH was printed when price broke below the most recent higher low, signaling a shift from bullish to bearish structure.
This change marked the first early signal that institutional order flow has flipped bearish, and distribution is underway.
📉 Break of Structure (BOS):
Following the CHoCH, the market confirmed intent with a clean BOS to the downside.
This structural break confirms bearish control and validates short bias.
🧲 Liquidity Engineering:
Equal Highs were swept at the top, indicating a liquidity grab before institutions drove price downward.
This move traps breakout buyers and provides large players with sell-side execution at premium pricing.
🧱 Fair Value Gap (FVG) & Supply Zone Mitigation:
After BOS, price retraced into a Bearish Fair Value Gap (FVG) and the origin of the supply zone, offering a high-probability entry.
The rejection from this zone showed imbalance was respected and no bullish continuation existed — further validating the short setup.
🔍 Confluences for the Bearish Bias:
Confluence Confirmation
CHoCH Structure flipped bearish
BOS Bearish continuation confirmed
Liquidity Sweep Equal highs taken
FVG Retest Smart Money re-entry signal
Supply Zone Mitigation Institutional reaction confirmed
📘 Educational Summary:
This setup exemplifies a complete Smart Money bearish reversal model:
Premium pricing ✅
Liquidity taken ✅
Structure flipped (CHoCH + BOS) ✅
Supply & FVG respected ✅
It reflects how institutions build positions quietly, using engineered liquidity to trap retail traders, and then drive price with high-volume imbalance moves.

Wyckoff distribbutes GoldThis analysis relies on the Richard Wyckoff trading model to explain the ongoing activity in the price of Gold, XAUUSD, claiming a potential shorting of the precious metal.

Gold mapping for next weekGold is going down. Gold Major trend is Changing to bearish, lets see are Gold going down after grab liquidity