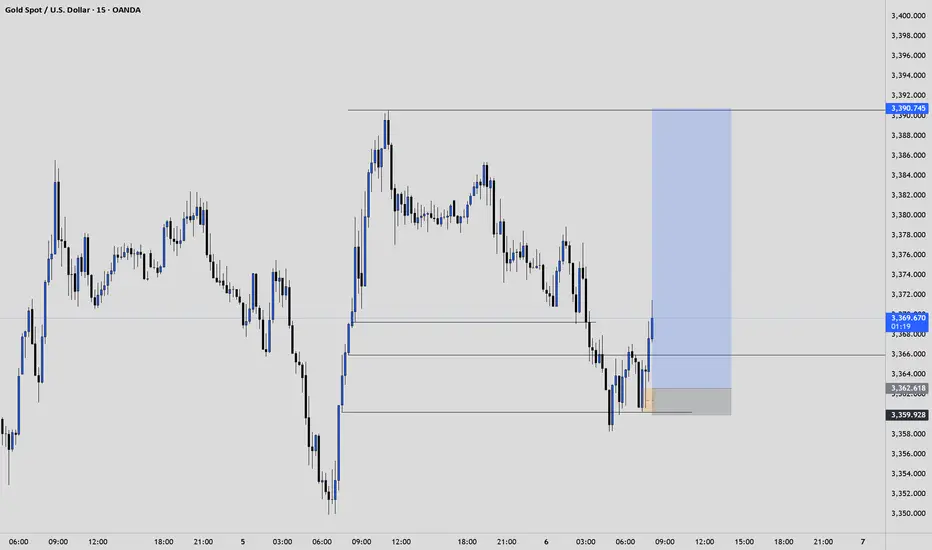
Gold Bulls Unshaken, 3400 in FocusGold prices retreated from a high of 3385 today, currently hitting a low near 3358. How far will gold fall? Are the bears back in control? I'm not worried about a gold pullback, but rather a lack of one, because only a pullback can provide a good entry opportunity. Clearly, I remain bullish on gold and optimistic about it reaching the 3400 mark.
Because gold fell all the way to around 3358, some voices in the market began to tout the strong return of the bears, but I remained unmoved. When many people were once in self-doubt, I was quietly taking advantage of the gold pullback to accumulate funds in batches and pick up bargains. We can clearly see that gold did not destroy the bullish structure during the decline, and as gold rebounded, the 3360-3350 area has become a dense trading area, indicating strong buying support. After the technical top and bottom conversion, it has become a relatively solid support area. It may be difficult for gold to fall below this support area in the short term.
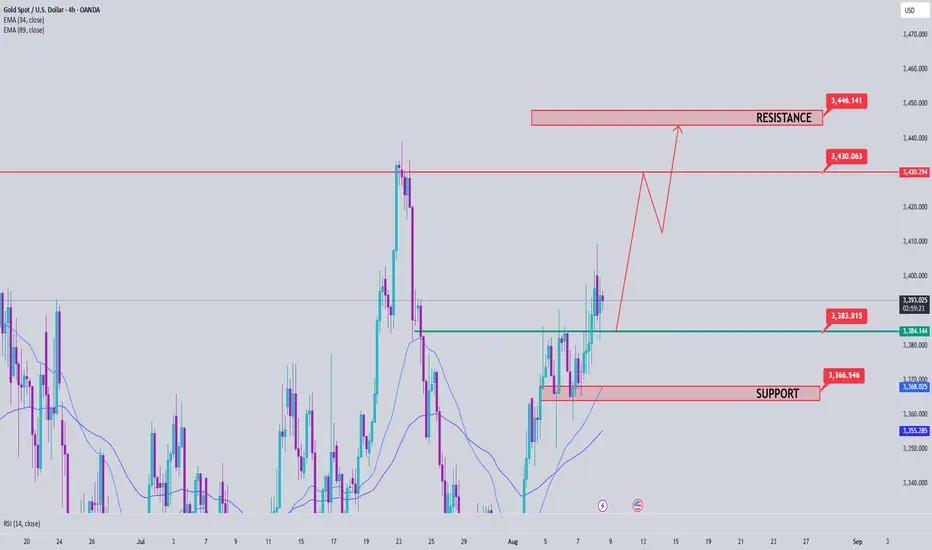
So, why has gold repeatedly encountered resistance and retreated? I believe that gold has encountered resistance and retreated in the 3385-3390 area many times in order to repeatedly test the effectiveness of support and consolidate the strength of support. It is also to increase liquidity during the retreat period, thereby accumulating more upward momentum so that gold can rise further and break through the 3400 mark.
So I still hold a long position in gold, and I have not lost confidence in the gold bulls. On the contrary, I still expect that gold will be able to hit 3400 in one fell swoop after repeatedly testing the support, or even continue to rise to the 3420-3430 area.
XAUUSD trade ideas

What you see are fluctuations, what I see are opportunities!Gold prices are rising as expected, with long positions perfectly fulfilled and periodic profits successfully secured. Currently, prices are once again encountering resistance at 3390. A clear bearish engulfing pattern has formed on the short-term hourly chart, suggesting weakening short-term momentum and increasing risk of a pullback. From a cyclical perspective, today marks the fifth trading day of gold's rebound, and technically, a periodic adjustment is necessary. A break below 3370 today will essentially confirm the establishment of a short-term top, and the market structure may shift into a phase of decline. Regarding trading recommendations, we recommend continuing to short on rallies around 3390 as a key resistance level, with short-term targets focused on 3370-3360. A subsequent break below this level with significant volume could open up further downside potential. Market sentiment is shifting rapidly at this time, so it is crucial to strictly enforce risk management discipline, avoid blindly chasing orders, and maintain a flexible and forward-looking strategy.

Gold Price Action Breakdown Key Liquidity Sweep + RB ReactionClean gold as price respected the Monday Rejection Block and swept key liquidity zones just as mapped. In this breakdown, I explain the logic behind the move, what I was expecting, and what actually played out.
💡 If you enjoy these trade breakdowns and want to go deeper into mindset, risk, and precision strategy I share extra lessons, insights, and psychology tips over on the blog. Just check the link in bio/profile for more.
Stay sharp and focused. Less is more. 🎯

XAUUSD: Adjustment Phase and Future OutlookHello everyone, today let's analyze the current movements of XAUUSD.
Currently, gold has gone through a period of adjustment, as the bulls were unable to push the price above the 3,400 USD level. Market instability has caused gold to pause its upward trend and enter a liquidation phase.
This adjustment reflects a cautious sentiment from investors in Asia. The 3,400 USD level remains a significant barrier, and this has become even clearer with factors such as weak data from China (PPI -3.6%) and uncertainties surrounding US-China trade talks putting pressure on gold's price. Additionally, expectations regarding the US inflation report and uncertainty in the semiconductor policy are hindering gold’s upward momentum. These factors reduce gold’s appeal as a safe-haven asset.
The key focus now is the trading range between 3,400 and 3,350 USD. Before further upward movement, the market may need to test this support level again.
We are now witnessing a retest of 3,358 USD with a false breakout, and the market’s response at this level is relatively weak. In the short term, gold may continue to adjust towards 3,350-3,345 USD. However, if the bulls can maintain the price above this level, a recovery seems a plausible scenario.
What are your thoughts on gold’s ability to maintain above the current support level? Could the market soon rebound and resume its upward trend?

XAUUSD Bearish SMC Analysis – Institutional RejectionXAUUSD Bearish SMC Analysis – Institutional Rejection from Supply Zone
Gold (XAUUSD) is showing a clear bearish structure after rejecting a major supply zone at premium pricing. This setup is aligned with Smart Money Concepts (SMC) and reflects how institutions manipulate liquidity and order flow before major price moves.
🔍 Market Structure Context:
The market had been trending upward with higher highs and higher lows, until it approached a key premium supply zone near $3,420.
At this level, price stalled, creating internal Equal Highs (liquidity) — a common trap used by institutions to grab orders before reversing.
🔄 Change of Character (CHoCH):
A clear CHoCH was printed when price broke below the most recent higher low, signaling a shift from bullish to bearish structure.
This change marked the first early signal that institutional order flow has flipped bearish, and distribution is underway.
📉 Break of Structure (BOS):
Following the CHoCH, the market confirmed intent with a clean BOS to the downside.
This structural break confirms bearish control and validates short bias.
🧲 Liquidity Engineering:
Equal Highs were swept at the top, indicating a liquidity grab before institutions drove price downward.
This move traps breakout buyers and provides large players with sell-side execution at premium pricing.
🧱 Fair Value Gap (FVG) & Supply Zone Mitigation:
After BOS, price retraced into a Bearish Fair Value Gap (FVG) and the origin of the supply zone, offering a high-probability entry.
The rejection from this zone showed imbalance was respected and no bullish continuation existed — further validating the short setup.
🔍 Confluences for the Bearish Bias:
Confluence Confirmation
CHoCH Structure flipped bearish
BOS Bearish continuation confirmed
Liquidity Sweep Equal highs taken
FVG Retest Smart Money re-entry signal
Supply Zone Mitigation Institutional reaction confirmed
📘 Educational Summary:
This setup exemplifies a complete Smart Money bearish reversal model:
Premium pricing ✅
Liquidity taken ✅
Structure flipped (CHoCH + BOS) ✅
Supply & FVG respected ✅
It reflects how institutions build positions quietly, using engineered liquidity to trap retail traders, and then drive price with high-volume imbalance moves.

Wyckoff distribbutes GoldThis analysis relies on the Richard Wyckoff trading model to explain the ongoing activity in the price of Gold, XAUUSD, claiming a potential shorting of the precious metal.

Gold mapping for next weekGold is going down. Gold Major trend is Changing to bearish, lets see are Gold going down after grab liquidity
Latest Gold Price Update TodayHey everyone! Let’s take a closer look at what’s happening with gold today.
Over the past week, the global gold market experienced dramatic swings. Prices tumbled following cautious remarks from Federal Reserve Chair Jerome Powell, only to rebound sharply after disappointing U.S. employment data.
On Wednesday, the Fed held interest rates steady, and Powell stated, “We haven’t made any decisions for September.” Though brief, that statement hinted that a rate cut isn’t guaranteed — dashing investor hopes and sending gold to its lowest level in four weeks.
But by Friday, the narrative flipped. A weaker-than-expected jobs report triggered a powerful rally. Within just two minutes of the data release, gold surged by $30, closing the week at $3,361 — a gain of over 2% in a single day.
These moves highlight just how sensitive gold is to Fed signals. A slight shift in tone or a single data point can spark major volatility.
From a technical perspective, falling U.S. Treasury yields have allowed XAU/USD to regain bullish momentum, as the market reassesses Fed rate expectations after the weak NFP print. If gold successfully breaks out of its current channel after a short-term pullback, the next target could be $3,400 — or even higher.
Do you agree with this outlook? Share your thoughts in the comments.
Good luck and happy trading!
GOLD (XAU/USD) Weekly Open Analysis – H2 Structure# 🟡 GOLD (XAU/USD) Weekly Open Analysis – H2 Structure
**Date:** 2025/08/11
**Timeframe:** 2H (Heikin Ashi)
**Style:** Smart Money Concept (SMC) + Supply/Demand + Price Action
---
## 📊 Market Context
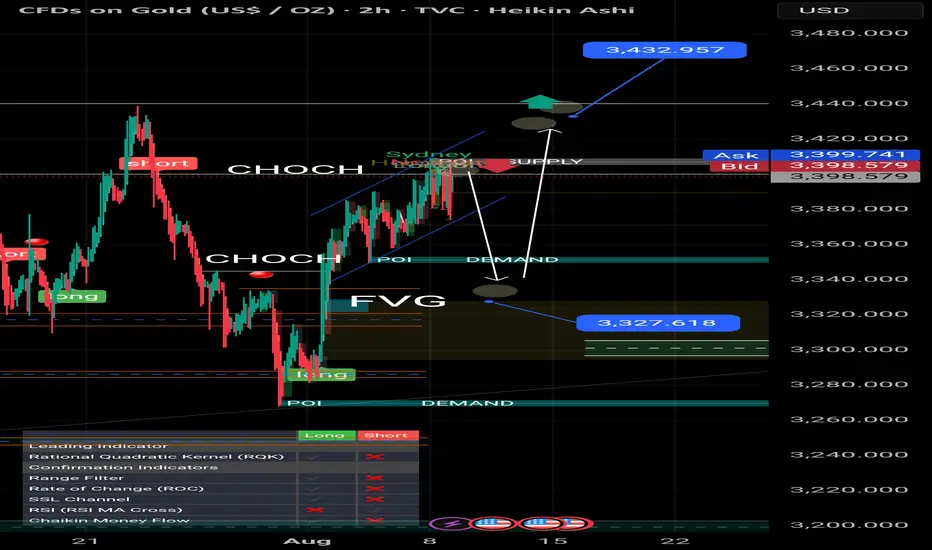
At the weekly open, gold price has started trading above the **upper parallel channel** where last week's close was printed. This level acts as a short-term **bullish bias zone**.
Simultaneously, the **Dollar Index (DXY)** opened at lower levels, showing signs of weakness. Historically, a falling DXY often supports upward movement in gold, and we may see a reaction as mapped in the chart.
---
## 🔍 Key Technical Levels
- **Upper CHOCH Breakout Zone:** ~**3,399 – 3,400**
- **Major Supply Zone:** ~**3,440 – 3,445**
- **Demand Zone #1:** **3,345 – 3,350** (POI)
- **Demand Zone #2:** **3,320 – 3,330** (FVG completion)
- **Final Demand Floor:** **3,260 – 3,265**
---
## 📈 Bullish Scenario (Primary)
1. **Condition:** CHOCH breakout above **3,400** with a bullish BOS confirmation.
2. **Entry Zone:** Retest near **3,399 – 3,402** after breakout.
3. **Targets:**
- 🎯 TP1: **3,420**
- 🎯 TP2: **3,432**
- 🎯 TP3: **3,445** (Major Supply)
4. **Invalidation:** Close back below **3,395** after breakout attempt.
---
## 📉 Bearish Scenario (Alternative)
1. **Condition:** Price fails to break the upper CHOCH and rejects from **3,399 – 3,400**.
2. **Expected Move:** Drop towards **Demand Zone #1** (**3,345 – 3,350**).
3. **If Demand #1 Fails:** Continuation towards **Demand Zone #2** (**3,320 – 3,330**).
4. **Final Target in Deep Drop:** **3,260 – 3,265** (lowest demand line in chart).
---
## ⚠️ Analysis Validity
> This analysis remains valid **as long as the upper CHOCH is not broken to the upside**.
> If the CHOCH breaks and a bullish BOS forms, the bearish path will be invalidated, shifting the focus to the upside targets.
---
📌 **Note:** Always combine with DXY monitoring – a significant DXY rally could limit gold’s bullish potential.
#XAUUSD #GoldAnalysis #SMC #SupplyDemand #CHOCH #BOS #TradingView
Smart Money Concept (SMC)📉 Bearish Analysis XAU/USD – SMC
🔹 1. Previous Market Structure
• Price was respecting a train line (trendline) which was broken aggressively, confirming a Break of Structure (BOS).
• After that, the market created a fake out above the resistance zone, grabbing liquidity from early buyers.
🔹 2. Signs of Weakness
• A clear rejection at the resistance zone, showing that buyers lost control.
• The train line break also signals a Change of Character (ChoCh), suggesting the beginning of a bearish swing.
🔹 3. Prior Mitigation Completed
• Price already mitigated key zones, including the 1H Order Block (OB-1H) and previous 1H Fair Value Gap (FVG).
• A new bullish FVG was formed but seems to have been rejected, adding to the bearish pressure.
🔹 4. Trade Plan
• Entry: Rejection after the fake out within the red supply zone
• Target: Support zone between 3,355 – 3,352, where liquidity is likely resting
• Stop Loss: Above resistance and the last BOS to avoid being caught by manipulation
💡 Summary for your caption:
“Price broke the trendline and showed clear weakness at resistance, leaving behind unmitigated interest at lower levels. The FVG rejection suggests institutional intent. High-probability short setup targeting the support zone.” GOOD LUCK TRADERS.. ;)

Gold support has been confirmed, buy with confidenceThe most anticipated outcome for the gold market this week is tomorrow's CPI data. After today's pullback during the Asian and European trading sessions, the current price has reached support levels. Before the CPI release, I believe volatility will be minimal, with a high probability of limited fluctuations.
The chart shows that 3350 is a key support level. After several hours of testing, 3350 has stabilized, so we can buy at this level, with the initial target being 3360, followed by 3380.
When Ego Takes Over, Your Account Pays the Price Revenge Trading – When Ego Takes Over, Your Account Pays the Price 💔
Traders, be honest…
How many times have you taken a painful SL, and before you could even breathe, your finger was already clicking “Buy/Sell” without a second thought?
In your head: “I’ll get it back right now… the market can’t do this to me!”
And then…
🔻 A candle goes straight against your position.
🔻 SL beeps again.
🔻 Your account balance drops faster than your mood.
That’s Revenge Trading – it sounds fierce, but in reality, it’s just an emotional storm pulling you further away from shore.
1️⃣ The Sweet but Deadly Psychological Trap
After a loss, your brain refuses to accept reality. It pushes you into the “must recover immediately” mode.
You throw discipline out the window – no setup, no plan.
You increase your lot size recklessly – “Just one win and I’ll be back.”
And… the market doesn’t care if you’re mad or not.
The danger is, at that moment, you’re no longer trading with logic — you’re trading with a wounded ego.
2️⃣ The Downward Spiral
Lose one trade → frustration.
Jump into a revenge trade → bigger lot size.
Lose again → account drains faster.
Emotions spiral out of control → random clicking.
Account blown.
It’s like standing at the edge of a cliff — you could step back and be safe… but you jump, thinking there’s a cushion down there.
3️⃣ How to Cut the Revenge Trading Cycle Before It Eats You Alive
Step away from the charts immediately after a losing streak — go for a walk, exercise, do something unrelated to trading.
Set a daily/weekly loss limit (e.g., -2R) and stick to it.
Journal your emotions after each trade to spot when revenge impulses start creeping in.
Trade smaller when you return — the goal now is to recover your mindset, not your money.
Remind yourself: “The market will always be here. My capital and mental state won’t wait for me.”
4️⃣ MMF’s Note to You
Revenge trading is not strength — it’s weakness in disguise.
It doesn’t help you beat the market; it just helps the market beat you faster.
Keeping a cool head is what keeps a trader alive in the long run.

Sell gold We are expecting more sell in CPI
Trend already breaks and support level gonna weak
It's tha just my view not exact analysis

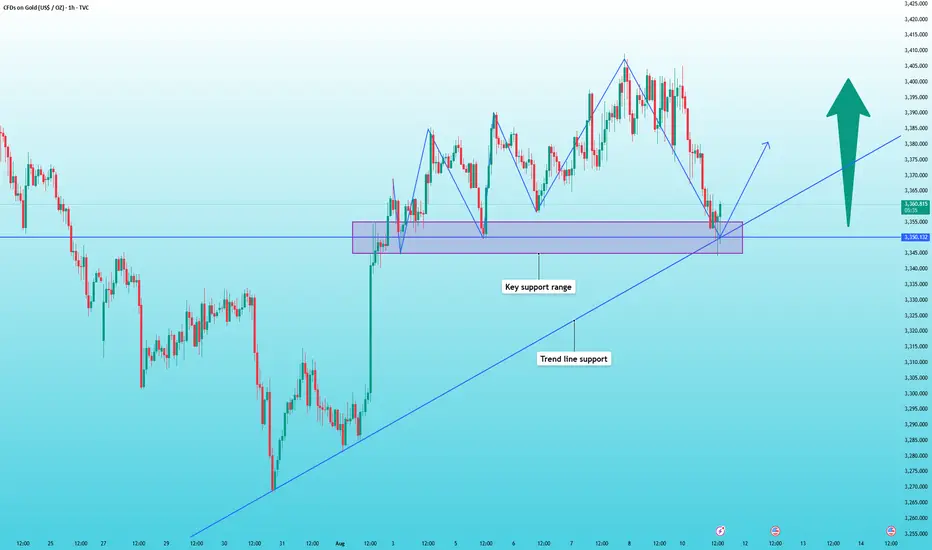
Gold Trading Strategy August 8XAUUSD – Bullish Breakout from Triangle Pattern
Gold has officially broken the upper boundary of the triangle accumulation pattern, confirming the continuation of the uptrend. This bullish momentum is heading directly towards the 3430 area, and if the buying pressure is maintained, the 3445 level is completely within reach.
Today is Friday, the closing day of the weekly candle, so the oscillation amplitude is usually stronger and the price can easily approach new peaks. Observation shows that the buying pressure in the US session has been maintained continuously in recent days - this supports the strategy of BUYing now and holding until the US market opens.
Support zone: 3385 – 3365 – 3333
Resistance zone: 3419 – 3431 – 3445
Gold - The diligent top formation!🏆Gold ( TVC:GOLD ) finished the bullrun:
🔎Analysis summary:
For the past 10 years, Gold has been trading in a very strong expected bullrun. Just like we witnessed it in 2011, a 10 year bullrun is followed by a shorter term bearmarket. Gold is starting to lose its strength, which is a clear sign of weakness and the beginning of a bearish reversal.
📝Levels to watch:
$2.800
SwingTraderPhil
SwingTrading.Simplified. | Investing.Simplified. | #LONGTERMVISION

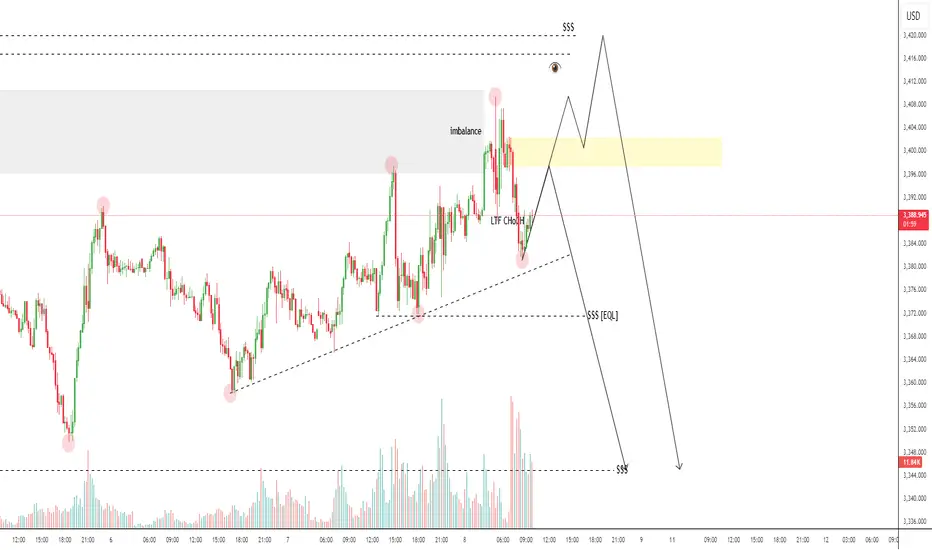
XAUUSD - 4/8/25Theres alot happening that is influencing Gold. But just following the market structure, we see a HTF BoS towards more bearish action. However friday's news did bring a big push up with huge imbalance in the Dollar as well as Gold.
I identified the zone that broke structure above and looking for price to touch this zone before going back down to take out any imbalance. t
The current TP is quite way down at the moment targeting the HTF equal low liquidity, but I will trail my SL.
if this Zone that broke structure is taken out then my bias will shift to bullish trades to retest the ATH.

Financial markets are set to receive a slew of important newDomestic gold prices fell due to the impact of world gold prices. In the international market, after closing the week at a high level, today's gold price suddenly reversed and plummeted when opening the new trading week.
Gold prices fell contrary to the forecast of analysts and investors when they expected the precious metal to continue to increase this week.
This week, the market is waiting for a lot of economic information such as the meeting to announce Australia's interest rate decision; the US consumer price index (CPI) report for July; the US producer price index... The data of this information is expected to affect the gold price.
This morning, the USD index (DXY) in the international market recovered to 98.1 points, also creating pressure to reduce gold prices.

XAU/USD – Bearish Momentum Building: Circle 2 Top In?OANDA:XAUUSD
We have now completed a 1-2-3-4-5 move to the downside (in white), followed by a counter-correction in the form of an A-B-C.
This may have already completed our yellow (Circle) Wave 2 🟡 — though it’s not confirmed just yet.
We still have two potential resistance levels at 3400 and 3418 that could serve as final topping points for Circle 2.
Today, we can also observe a break of structure with the white trendline being broken, adding further confirmation to the bearish outlook 🔻.
I am now tracking my 1-2-3-4-5 structure in yellow, which should unfold into Circle Wave 3 🟡.
Bias remains bearish, and I expect this move to develop in line with the yellow projection already shown on my chart.
If price breaks decisively above our Fibonacci resistance, the alternative scenario would be an ABCDE triangle formation that has potentially been forming over the past months — in that case, I’ll post a dedicated update 📌.
For now, I’m actively looking for sell setups and have already entered short positions ✅.

XAUUSD Potential buy and sell zone!XAUUSD Potentially coming for a dipper pullback as upon crossing the daily high we can see XAUUSD started reject from higher price and continue to drop to this daily and weekly support and may continue to drop.
It is possible for the market to potentially bounce off the weekly support as the market is moving up with a stronger momentum

XAUUSD LongElite Analysis (Published this after execution)
Price took previous session low
Went to lower time frame to look for confirmations to upper liquidity pools
Confirmed 10m BOS
Found a 1m OB
Checked all confirmations and executed
Targeting upper liquidity pools
Elliott Wave Analysis – XAUUSD August 12, 2025
1. Momentum Analysis
• D1 Timeframe: Momentum is declining → the downtrend remains intact. It may take another 2–3 daily candles for price to reach the oversold zone and potentially reverse.
• H4 Timeframe: Momentum is rising → from now until the U.S. session, price may either retrace upwards or move sideways.
• H1 Timeframe: Momentum is preparing to turn down → a minor pullback could occur in the short term, so this move should be monitored.
________________________________________
2. Elliott Wave Structure
• The green wave structure in the form of an ending diagonal may have been completed. This could mean that Wave 5 or Wave C (black) has formed.
• Personally, I do not want to see the Green 5-Wave Structure end with an ending diagonal at this stage because:
o If this is an impulsive uptrend structure, we are only at Wave 1 of the larger degree.
o An ending diagonal in Wave 5 (black) indicates weak buying pressure, which is not ideal when price hasn’t broken the previous high to confirm a new trend → increasing the probability that this is a corrective wave.
• Looking at the current downward wave structure, I tentatively label it as five black waves 1-2-3-4-5. The current slight rebound is expected to be Wave 4, which could take the form of either a Flat or Triangle.
• Wave 4 targets:
1. 3358
2. 3364
• If price breaks 3381, the current 1-2-3-4-5 bearish count will be invalidated (Wave 4 would overlap Wave 1). In that case, the structure could turn into a corrective ABC or a new 5-wave advance.
• With a Wave 4 target at 3364, the projected Wave 5 target would be 3323.
________________________________________
3. Combining Momentum & Wave Structure
• D1 downtrend → supports the scenario of another drop, forming Wave 5.
• H4 rising + H1 declining → could indicate Wave 4 forming as a triangle, with the key signal being that the current drop does not break 3342.
o If 3342 breaks, Wave 5 may already be in play, targeting 3323.
• Since H4 momentum is still rising, there remains a chance that price breaks above 3381, which would require a full recount—possibly turning into an ABC correction or a 5-wave rally.
________________________________________
4. Trading Plan
• If Wave 4 forms as a triangle → the 3358 area is a good sell zone, or wait for a breakout below 3342.
• Limit Sell Order:
o Entry: 3364 – 3366
o SL: 3374
o TP1: 3342
o TP2: 3333
o TP3: 3323

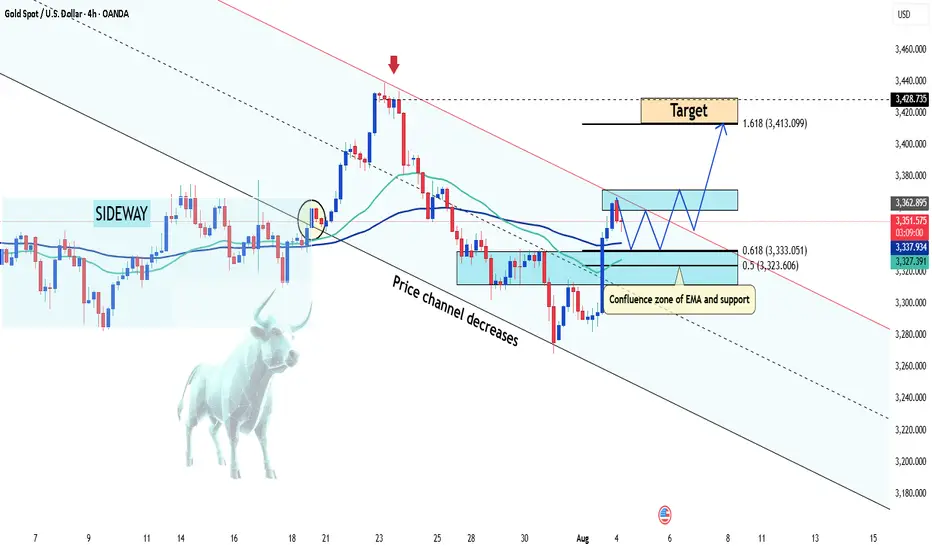
XAU/USD Bullish Bounce from Demand Zone !Gold (XAU/USD) on the 4H chart is showing a potential bullish reversal setup. Price has pulled back into a Fair Value Gap (FVG) and high supply/demand zone near 3,329–3,315, aligning with the 0.382–0.5 Fibonacci retracement.
Key Points:
Support Zone: 3,329–3,315 (demand + FVG).
Bullish Rejection Expected: Price may bounce from this zone, targeting upper resistance levels.
Upside Targets:
TP1: 3,356
TP2: 3,375
TP3: 3,440–3,459 (major resistance)
Invalidation: A daily close below 3,315 could open room for deeper downside toward 3,278–3,245.
Indicators: EMA(9) and Ichimoku showing potential for trend resumption if price closes above 3,362.
Overall, the chart suggests a buy setup on bullish confirmation, aiming for the 3,375–3,459 zone.

The Golden Wedge – Prelude to a Silent Collapse1. Chapter: The Plot Twist – The Traitorous Funnel (Rising Wedge)
A new and extremely sneaky pattern has emerged in the golden constellation.
My eyes are sharper than a hawk’s, and what I’ve spotted might just be the key to today’s entire story. This isn’t just technical analysis anymore—this is a psychological thriller.
Forget the comfortable parallel channel!
Gold has wandered into a rising wedge, one of the most deceptive traps in the world of chart patterns.
What’s a rising wedge?
Imagine the bulls charging up a narrowing mountain pass. At first, they’re full of energy, but as the walls close in, they lose momentum, get out of breath, and their excitement fades. Each new high is just slightly higher than the last. The power fades.
And that’s the trap: Even though the structure points upward, it’s a classic bearish reversal pattern.
It’s like a wolf in golden sheep’s clothing.
Statistically, it breaks down more often than up, and usually with a sharp move.
And it fits perfectly with the end of wave 5, just as I mentioned yesterday.
This is what we call an ending diagonal—the textbook sign of a fading trend. A final push... that’s not really a push anymore.
2. Chapter: The Evidence
A massive red neon sign is flashing on the trend strength and RSI indicators: BEARISH DIVERGENCE!
What does this mean? While the price keeps climbing to new highs, the indicator (RSI) has already started pointing downward.
And let’s not forget — on the 1-hour chart, there’s barely a trace of trend strength left.
The momentum has already left the building. To me, that’s a strong sign the bulls’ party might soon come to an end.
🔮 My Take – Place Your Bets on Collapse?
Opening a long position now?
That would be like buying a ticket for a sequel to the Titanic, called “Unsinkable 2 – This Time We Really Mean It.”
Sure, price might go a bit higher, but the iceberg (breakdown) is already visible on the horizon.
Opening a short position?
Logically, it’s the move that fits the script.
But a wise trader never shoots blindly.
The keyword here is: CONFIRMATION.
The Entry Command:
Don’t short until price breaks below the lower support line of the wedge. Wait for a candle to close below that rising support line—that’s your green light for entry!
Target: The first logical target after a breakdown would be the base of the wedge, around the Wave 4 low, which sits in the 3,340–3,350 zone.
Not financial advice, but that’s the setup I’m watching like a hawk.
From here on, the analysis continues in my native language – Hungarian
A csillagtérképen egy új, és rendkívül alattomos jelenséget fedeztem fel. A szemem élesebb, mint egy sólyomé, mert amit észrevettem az a kulcsa az egész mai történetnek. Ez a regény ma egy igazi pszicho-thriller lesz!
1. Fejezet: A Cselekmény Fordulata – Az Áruló Tölcsér (Az Emelkedő Ék)
Felejtsük el a biztonságos, párhuzamos csatornát! Az arany behajtott egy emelkedő ékbe, ami a technikai alakzatok egyik legalattomosabb csapdája.
Mi az az emelkedő ék? Képzeld el, hogy a bikák egy egyre szűkülő, meredek hegyi szurdokban rohannak felfelé. Az elején még nagy volt a lendület, de ahogy a falak közelednek, egyre jobban lelassulnak, elfogy a levegő, és a lelkesedésük is. Újabb és újabb csúcsokat érnek el, de minden egyes csúcs csak egy kicsivel van magasabban, mint az előző. A mozgásból lassan elfogy az erő.
A csapda természete: Bár az alakzat felfelé mutat, ez egy tipikus medvés (bearish) fordítós alakzat. Olyan, mint egy farkas báránybőrben. A statisztikák szerint az esetek többségében lefelé szokott kitörni, és gyakran heves esés követi.
Ez a jelenség tökéletesen illik az 5-ös hullám végére, amiről beszéltem tegnap. Ezt hívják "befejező diagonálnak", ami a trend kifulladásának klasszikus jele. Ez a végső-roham, ami már nem is igazi roham. Az idő majd megmondja mennyire gondoltam jól.
2. Fejezet: A Bizonyítékok
A Trend erő és RSI indikátoron is egy hatalmas, vörös neonfelirat villog: MEDVÉS DIVERGENCIA!
Mit jelent ez? Miközben az árfolyam még felfelé halad, újabb csúcsokra mászik, az indikátorok (az RSI) már rég lefelé tartanak. Arról nem is beszélve, hogy 1 órás charton Trenderőnek nyoma nincs.
Az erő már rég elhagyta a támadást. Ez egy erős bizonyíték arra, hogy a bikák partijának hamarosan vége.
Szerintem... – Fogadjunk az Összeomlásra?
Vételi (Long) pozíciót nyitni? Most longot nyitni olyan lenne, mint jegyet venni a Titanicot is gyártó cég legújabb, "Garantáltan Elsüllyeszthetetlen 2" nevű hajójára. Lehet, hogy megy még egy kicsit felfelé de a jéghegy (a lefelé kitörés) már ott van a láthatáron.
Eladási (Short) pozíciót nyitni? A forgatókönyv alapján ez a logikus lépés. De egy jó stratéga sosem lő vaktában. A kulcsszó a MEGERŐSÍTÉS!
A Belépési Parancs: Nem kezdünk el shortolni, amíg az árfolyam a biztonságot nyújtó ékben van. Megvárjuk, amíg egyértelműen és határozottan letöri az ék alsó, emelkedő vonalát. Az a gyertya, amelyik ez alatt a vonal alatt zár, az a mi belépési parancsunk!
Célpontok: A kitörés után az első logikus célár az ék kiindulási pontja, vagyis a 4-es hullám alja, a ~3,340-3,350-es zóna.
Nem bef. tanács, de én ezt fogom csinálni.
