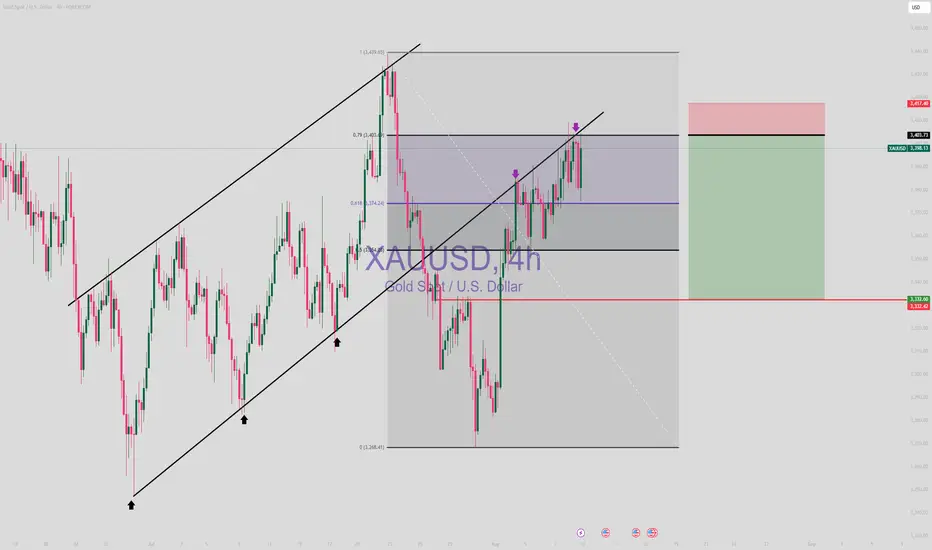
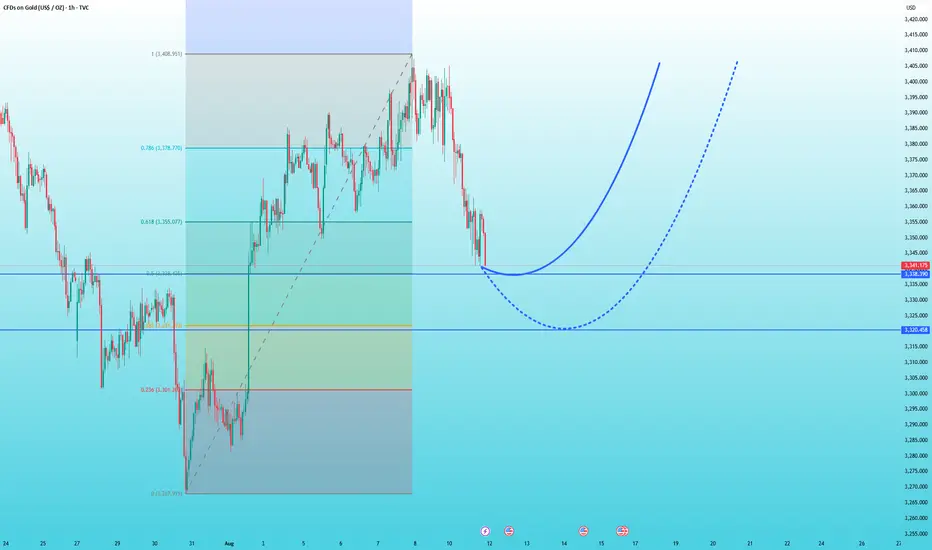
XAUUSD (GOLD) SHORT
We looking to sell Gold its at 79.0 which is last resistance zone Of fibonacci.
Last resistance zone.
Price has been rejecting below Support. only break above invalidates sells
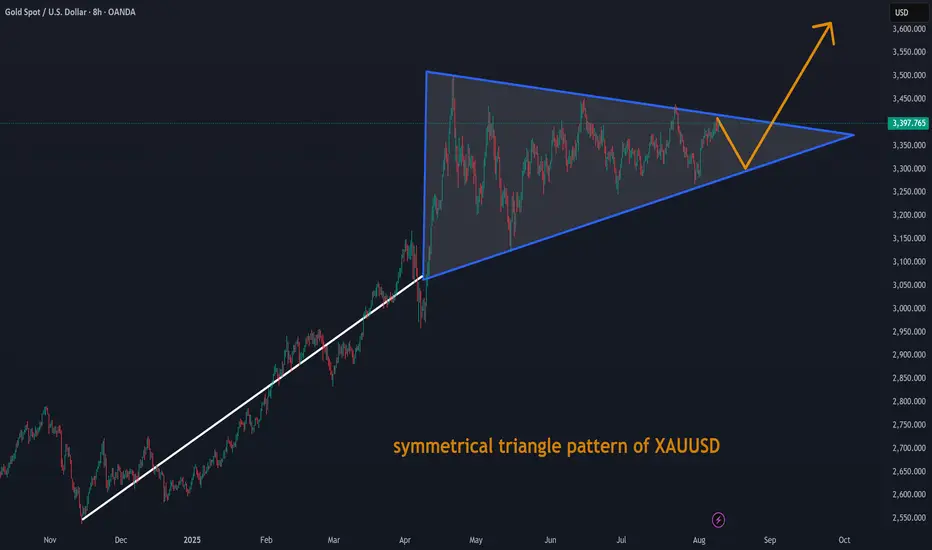
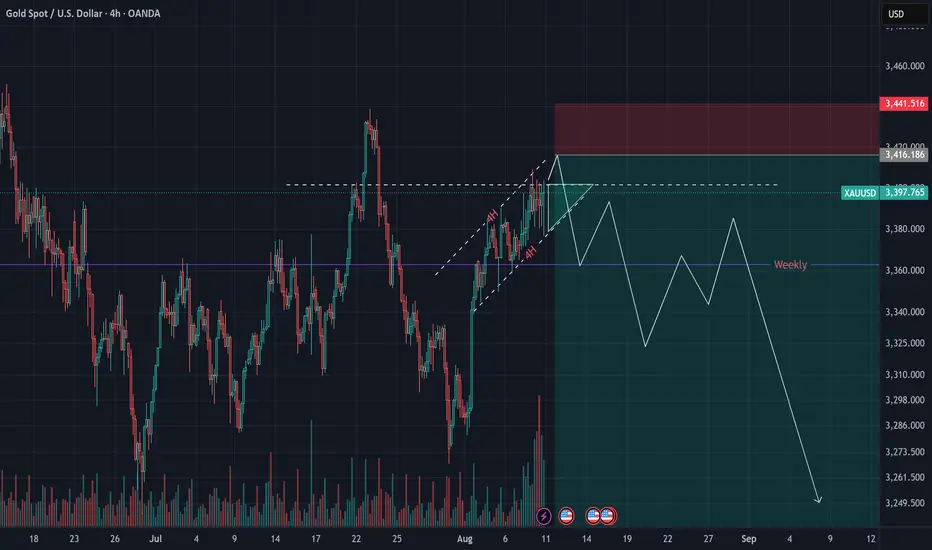
XAUUSD trade ideas
symmetrical triangle pattern of XAUUSDsymmetrical triangle pattern of XAUUSD. It is consolidating in narrow area within Trangle.
#XAUUSD ALMAZOV PROJECTION D1 - H1In daily trading, the price is in its fifth bullish nesting, not yet breaking through the start limit, but pushing for a breakout-type bullish trend. We move down to H1 to look for continuation bullish cycles.
On H1, the second bullish nesting, OK, the trident formation, point 5, bounces off Shum. Therefore, we look for a rebound from the downward swing, starting and F61.8 zones for buys, SL at X.

XAUUSD / GOLDPOTENTIAL sell setup during newyork session .
sell zone: 3365-3368 //3368-3372
potential target: friday opening price or friday daily low
not financial advice. follow at own risk.. Don't all in.

XAUUSD needs retest before swing highM30-H1 TIMEFRAME SETUP
Currently we have range of 3345-3380 area also we have proper CHOCH on H4 at 3335 support area
What possible scenarios we have ?
• If market remains low 3372-3378 then you can scalp a sell trades towards 3360-3350 area which I take sell with minimal risk.
• secondly I wait for drop to my Buying area where I will buy XAUUSD in dips and my optimal target will be 3402-3410.
Additional Tip:
Market is on bullish Bias ,above 3385 no sell Trade .
#XAUUSD
Will Gold Break Out on Tariff and Fed Uncertainty?Gold’s price action is currently fluctuating above the trendline connecting higher lows from May 2025, potentially aiming for the trendline from December 2024, which aligns with the 2025 peak at 3,500.
A firm hold above the 3,400 and 3,450 levels could accelerate a move back toward the 3,500-record, with potential for further gains toward new highs at 3,780 and 4,000, respectively.
On the downside, a close below 3,340 may lead to a pullback to 3,280 for a possible rebound, or even a deeper retracement toward 3,230 and 3,130.
- Razan Hilal, CMT
GOLD Will Go Up! Buy!
Take a look at our analysis for GOLD.
Time Frame: 2h
Current Trend: Bullish
Sentiment: Oversold (based on 7-period RSI)
Forecast: Bullish
The market is approaching a key horizontal level 3,372.49.
Considering the today's price action, probabilities will be high to see a movement to 3,395.61.
P.S
Please, note that an oversold/overbought condition can last for a long time, and therefore being oversold/overbought doesn't mean a price rally will come soon, or at all.
Disclosure: I am part of Trade Nation's Influencer program and receive a monthly fee for using their TradingView charts in my analysis.
Like and subscribe and comment my ideas if you enjoy them!

Elliott Wave Analysis – XAUUSD August 12, 2025
1. Momentum Analysis
• D1 Timeframe: Momentum is declining → the downtrend remains intact. It may take another 2–3 daily candles for price to reach the oversold zone and potentially reverse.
• H4 Timeframe: Momentum is rising → from now until the U.S. session, price may either retrace upwards or move sideways.
• H1 Timeframe: Momentum is preparing to turn down → a minor pullback could occur in the short term, so this move should be monitored.
________________________________________
2. Elliott Wave Structure
• The green wave structure in the form of an ending diagonal may have been completed. This could mean that Wave 5 or Wave C (black) has formed.
• Personally, I do not want to see the Green 5-Wave Structure end with an ending diagonal at this stage because:
o If this is an impulsive uptrend structure, we are only at Wave 1 of the larger degree.
o An ending diagonal in Wave 5 (black) indicates weak buying pressure, which is not ideal when price hasn’t broken the previous high to confirm a new trend → increasing the probability that this is a corrective wave.
• Looking at the current downward wave structure, I tentatively label it as five black waves 1-2-3-4-5. The current slight rebound is expected to be Wave 4, which could take the form of either a Flat or Triangle.
• Wave 4 targets:
1. 3358
2. 3364
• If price breaks 3381, the current 1-2-3-4-5 bearish count will be invalidated (Wave 4 would overlap Wave 1). In that case, the structure could turn into a corrective ABC or a new 5-wave advance.
• With a Wave 4 target at 3364, the projected Wave 5 target would be 3323.
________________________________________
3. Combining Momentum & Wave Structure
• D1 downtrend → supports the scenario of another drop, forming Wave 5.
• H4 rising + H1 declining → could indicate Wave 4 forming as a triangle, with the key signal being that the current drop does not break 3342.
o If 3342 breaks, Wave 5 may already be in play, targeting 3323.
• Since H4 momentum is still rising, there remains a chance that price breaks above 3381, which would require a full recount—possibly turning into an ABC correction or a 5-wave rally.
________________________________________
4. Trading Plan
• If Wave 4 forms as a triangle → the 3358 area is a good sell zone, or wait for a breakout below 3342.
• Limit Sell Order:
o Entry: 3364 – 3366
o SL: 3374
o TP1: 3342
o TP2: 3333
o TP3: 3323

Gold can continue to rise, the correction is short-livedLast week, news of US tariffs on gold caused market volatility, sending gold prices surging to a high of 3,408.
Gold prices continued to fall today, dropping from the opening price of 3,400 to around 3,340. This $60 drop appears to be a response to the White House's clarification that the gold tariff information was false, as well as the reduction in risk aversion caused by the resumption of Russia-Ukraine negotiations on the 15th of this month.
However, regarding the gold tariff issue, my view is that the US's intention in imposing tariffs on gold is to disrupt the existing pricing mechanism, leaving it with complete control over the final price and price. While the US is not currently imposing tariffs, there's no guarantee that they won't be levied later or through other channels.
Furthermore, the resumption of Russia-Ukraine negotiations is merely a meeting between Trump and Putin on the 15th, with Ukraine and the EU once again excluded. This type of negotiation isn't very substantial, as this has happened before. Therefore, the idea that the end of the Russia-Ukraine conflict will lead to a significant drop in gold prices is not currently plausible.
Thus, from a macroeconomic perspective, the overall trend of gold remains unaffected, and the overall bullish trend remains.
I think there will not be much room for decline in this correction before the CPI data. For the support below, we can first look at the 3338 support level, and then the 3320 support level. As long as these two points stabilize, you can buy with confidence, because once there is a rebound, the profit space will be very considerable.
Huang cannot break through 3400, and the bearish trend begins
💡Message Strategy
The gold market has been volatile recently, with price fluctuations weighing on the nerves of global investors. Gold prices saw a significant decline on Monday (August 11th), with market attention focused on the US-Russia talks regarding the Ukraine conflict and the upcoming release of US Consumer Price Index (CPI) data.
These two major events not only have implications for the direction of geopolitical developments but may also provide important clues to the Federal Reserve's interest rate policy, thereby influencing the future trend of gold prices.
📊Technical aspects
Gold bulls rebounded under pressure, retreating to the 3400 level before ultimately breaking down. Gold bulls have lost their initiative, the rebound is weak, and the price continues to fall, breaking new lows. Gold has now reached scenario 2, which we discussed yesterday, at 3350, and is poised for further declines.
Gold's 1-hour high trading volume zone finally broke below, breaking the oscillation pattern. This means the high-level box has formed a short-term top structure, and the resistance at the high level has become very heavy.
At this point, it's no longer advisable to blindly chase gold prices; a bearish outlook on a pullback is the prevailing trend.
💰Strategy Package
Short Position:3360-3365,SL:3380,Target: 3330

SMART MONEY CONCEPT (SMC)📉 Bearish Analysis XAU/USD (15M)
In this analysis, we apply Smart Money Concepts to identify a potential bearish continuation.
1️⃣ Market Context
• Price began with a bullish phase that ended in the resistance zone, leaving clear ChoCh and BOS structures.
• A fake out broke the trendline, signaling manipulation before a directional shift.
2️⃣ Consolidation Phase
• The market entered a 15M consolidation, creating liquidity traps on both sides.
• A rejection formed at the top, confirming the intention to keep price within the range.
3️⃣ Break and Manipulation
• The support break combined with a fake out suggests buyers were trapped before the real drop.
• Price is now pulling back into the rejection zone, where we look for the optimal short entry.
4️⃣ Bearish Projection
• From the rejection zone, we expect price to resume its bearish momentum toward the distribution zone, aligned with the current market structure.
🎯 Trade Plan:
• Entry: At the rejection zone after the pullback.
• Stop Loss: Above the last relevant high.
• Take Profit: Extended to the marked distribution zone.

XAUUSD Analysis todayHello traders, this is a complete multiple timeframe analysis of this pair. We see could find significant trading opportunities as per analysis upon price action confirmation we may take this trade. Smash the like button if you find value in this analysis and drop a comment if you have any questions or let me know which pair to cover in my next analysis.

Gold (XAU/USD) Analysis – August 10, 2025We’ve been waiting for gold to break above the 3400 level for quite some time.
Despite multiple tests and deep wicks into this zone,
I don’t expect the coming week to bring a fresh high for gold.
With price compression between 3390 – 3400,
I anticipate that the market will be selling gold this week.
We should also expect a stop hunt on sellers before the drop.
My preferred short entry zone remains 3415 – 3430,
with a probable target around 3200,
making this risk-reward setup attractive.
XAUUSD Sell setup 09/08/25Bearish reversal (rising wedge/exhaustion): a rising wedge (higher highs + rising lower highs in a narrowing range) on a weekly chart after a big run can be a reversal or deep retracement signal
Follow risk management
Risk no more than 1%

XAUUSD 4H SMART MONEY CONCEPT ANALYSIS Market Structure Overview:
Price recently swept sell-side liquidity below the 3280s area and reacted from a 4H demand zone. We are now seeing a bullish retracement into a higher time frame premium zone (red supply area).
🔍 Key SMC Concepts Applied:
✅ Liquidity Sweep – Price grabbed liquidity below the 3280 support (equal lows), then aggressively pushed up.
✅ Breaker Structure (BOS) – Minor bullish BOS formed as price broke short-term highs after the liquidity sweep.
✅ Market Inefficiency – There’s a fair value gap and imbalance between 3,380 and 3,420.
✅ Supply Zone in Premium – Red zone (3,400–3,430) marks a previously unmitigated 4H supply area. Ideal zone for smart money to re-enter shorts.
📌 Current Expectation:
We expect price to tap into the red premium zone, where:
Liquidity above recent highs will be engineered and swept.
Institutional orders are likely resting for short entries.
Price may reverse sharply from that level, targeting the unmitigated green demand zone at 3,200–3,220.
💡 Entry Plan (Sell Setup):
🔼 Wait for price to trade into 3,400–3,430 supply.
🔁 Look for change of character (CHOCH) on lower timeframes (15M or 1H).
🔻 Enter short on confirmation.
🛑 SL: Above 3,435 (just beyond the liquidity).
🎯 TP1: 3,280 (structure level).
🎯 TP2: 3,200 (discount demand zone).
🕒 Timeframe Reference:
4H for overall structure, confirmation on 15M/1H after supply tap.
🧲 Liquidity Map:
Buy-side liquidity above 3,390s (target for bulls before reversal).
Sell-side liquidity resting below 3,250 and deeper around 3,200.
🔑 Summary:
"Smart money is driving price back into premium for efficient distribution. Bears are likely to step in after liquidity is swept above recent highs. Patience is key—let price reach your area of interest before executing."
#XAUUSD #SMC #SmartMoneyConcepts #LiquiditySweep #SupplyAndDemand #GoldAnalysis #InstitutionalTrading #PremiumToDiscount #TradingView

Gold Consolidates at High Levels. Waiting for a New Trend?Gold barely held the 3360 level on Wednesday and will remain in the 3360-3380 consolidation range outlined by Quaid.
Quaid considers Thursday to be a more important day. From a timing perspective, today may impact whether gold can continue its upward trend. However, it is possible that the market could continue its consolidation today. One thing is that the daily line must close above 3360, then the subsequent rise in gold will continue.
On the contrary, if it closes below 3360, then the rise will definitely not be able to continue in the short term. In the short term, gold may remain above 3370 today.
We can see that 3375-3370 is an important support, but the daily line has not yet stabilized above 3380, so the upward space has not yet been opened. If the daily chart can stabilize above 3380, then a test of 3400-3410 is in the cards.
Trading strategy:
Buy between 3365-3370, stop loss at 3355, profit range 3380-3390-3400.
Gold XAUUSD Analysis 06.08.2025Entry: 3373–3378 (on retracement into 1H supply zone)
Stop Loss: 3385 (above recent swing high)
Take Profit: 3352 (targeting previous low / 1H demand)
Bias: BearishRRR: ~2.5:1
Analysis:
Price showed strong rejection from the 3373–3378 supply zone. Expecting a pullback into this area before continuation lower. Bearish structure remains intact with clean lower highs. Plan is to sell the retracement, with SL above 3385. Targeting 3352, which aligns with prior demand and liquidity.
Kindly show support by following liking and commenting your favourite pair for analysis.

Gold opening within range H1-H4 TIMEFRAME SETUP
Currently XAUUSD is following the rising channel along with flag pattern although I expecting market will fall from 3405-3410 zone.
What possible scenarios we have ?
• Market has to gives closing of H4 below 3390 for the implusive drop ,also I'm on holding sell trade above 3400 and my Targets are 3383 then 3370
• secondly If gold breaks to 3370-3375 then market will retest 3345-3335 zone and where I will wait for my Buying fir swing trades.
Additional Tip:
Above 3410 no sell Trade our rising channel will be invalid till 3425 as Per SMC (BOS & CHOCH)

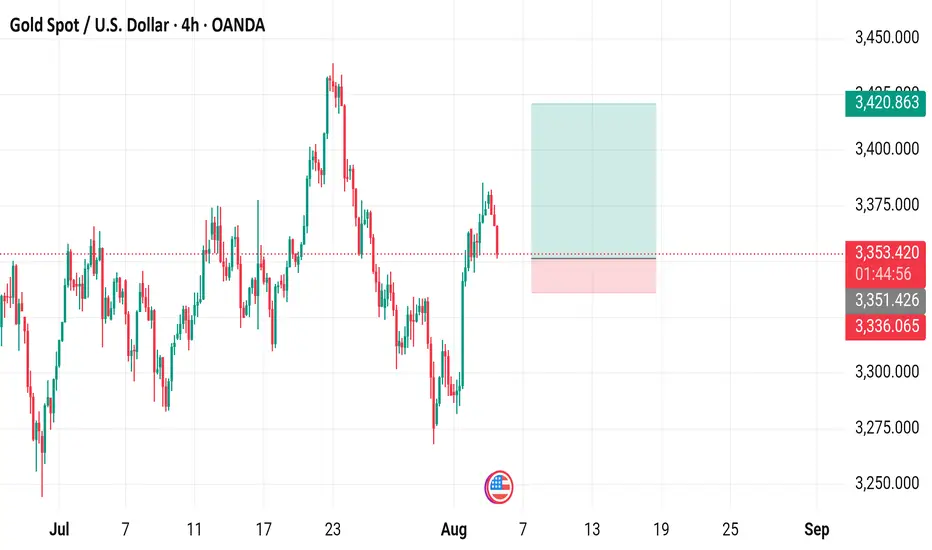
Gold Spot / U.S. Dollar (XAU/USD) - 4 Hour Chart (OANDA)4-hour chart from OANDA shows the recent price movement of Gold Spot (XAU/USD), currently at $3,353.240, down $20.395 (-0.60%). The chart highlights a sell price of $3,353.010 and a buy price of $3,353.450, with a shaded area indicating a support/resistance zone around $3,351.426 to $3,353.240. The data reflects trading activity from July to early September 2025.

GOLDPreferably suitable for scalping and accurate as long as you watch carefully the price action with the drawn areas.
With your likes and comments, you give me enough energy to provide the best analysis on an ongoing basis.
And if you needed any analysis that was not on the page, you can ask me with a comment or a personal message.
Enjoy Trading ;)

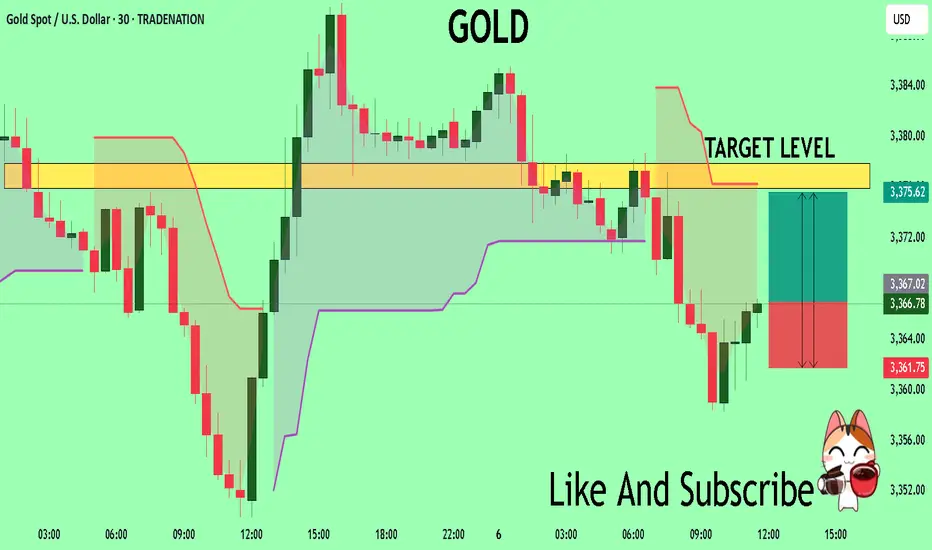
GOLD What Next? BUY!
My dear friends,
Please, find my technical outlook for GOLD below:
The price is coiling around a solid key level - 3366.7
Bias - Bullish
Technical Indicators: Pivot Points Low anticipates a potential price reversal.
Super trend shows a clear buy, giving a perfect indicators' convergence.
Goal - 3375.9
Safe Stop Loss - 3361.7
About Used Indicators:
The pivot point itself is simply the average of the high, low and closing prices from the previous trading day.
Disclosure: I am part of Trade Nation's Influencer program and receive a monthly fee for using their TradingView charts in my analysis.
———————————
WISH YOU ALL LUCK
August 6, 2025 - XAUUSD GOLD Analysis and Potential OpportunitySummary:
We’re still in a bullish market, with no signs of a major reversal and last month’s low still holding. The overall strategy remains buying on dips. On the upside, 3390 is the key resistance to watch today — if broken, the next target is the 3400 psychological level. However, if 3400 is rejected again, it may offer a high-risk-reward short setup. On the downside, 3350 remains the most critical support zone for now.
📍 Key Levels to Watch:
• 3434 – Resistance
• 3420 – Resistance
• 3405 – Resistance
• 3400 – Psychological resistance
• 3390 – Intraday key resistance
• 3375 – Support
• 3371 – Support
• 3365 – Support
• 3350 – Psychological support
• 3345 – Support
📈 Intraday Strategy
SELL below 3375, targeting 3371, then 3365, 3358, 3350
BUY above 3385, targeting 3390, then 3394, 3400, 3405
👉 If you find this helpful or traded using this plan, a like would mean a lot and keep me motivated. Thanks for the support!
Disclaimer: This is my personal view, not financial advice. Always use proper risk control.
