Buy gold near 3381, target 3399-3438Gold Market Analysis:
Gold's daily chart shows, as we previously discussed, a period of significant volatility within a high range. The previous non-farm payroll data and a series of other data points haven't triggered a major rally in gold. This period of volatility on the daily and weekly charts has lasted for four months. Gold needs a breakout in the future. Whether it breaks above or below, it will likely trigger a massive unilateral move. New traders fear unilateral moves, while experienced traders fear volatile trading. Large unilateral moves will likely take advantage of new traders, so it's crucial to establish stop-loss orders on each trade. In the short term, gold is currently rising in a wave structure. Yesterday, the US market reached 3408. The 3438 to 3450 range on the analysis chart is a barrier. Selling will require a major rebound here. I predict several more upward rallies today, so the short-term strategy for today is to buy low. The 4H chart of gold clearly shows a major upward and downward movement. Therefore, if it approaches the resistance range again, there's a possibility of a dip or reversal. The 1H chart reached 3370. If this level isn't broken today, we'll continue to buy. If it does, we'll adjust our strategy. We already bought at 3383 in the Asian session. Be mindful of volatile markets; wait and see, not rush into them. Gold trading in the Asian session between 3383 and 8370 presents buying opportunities.
Support is at 3383-3380, with strong support at 3370. Resistance lies at 3408 and 3438, with 3383 being the dividing line between strength and weakness.
Fundamental Analysis:
The tariff war has been the most significant fundamental factor impacting gold recently, but it will support it in the long term. This surge in gold prices is driven by Trump's renewed efforts, and the Federal Reserve's future monetary policy remains a key focus.
Trading Strategy:
Buy gold near 3381, target 3399-3438
XAUUSD trade ideas

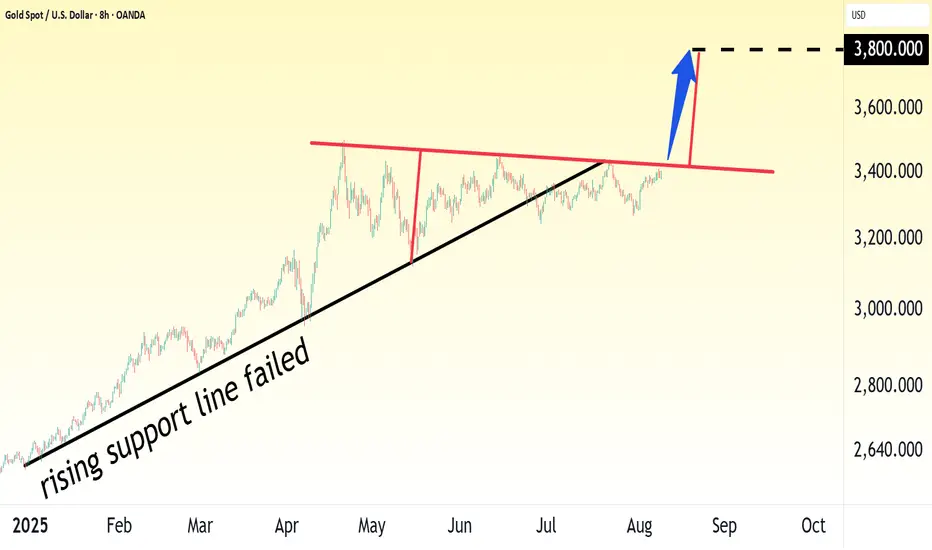
Gold prices continue to rise, and the next target is $3800!The gold chart made VERY simple.
$3800 target POSSIBLE once we get a confirmed continuation breakout.

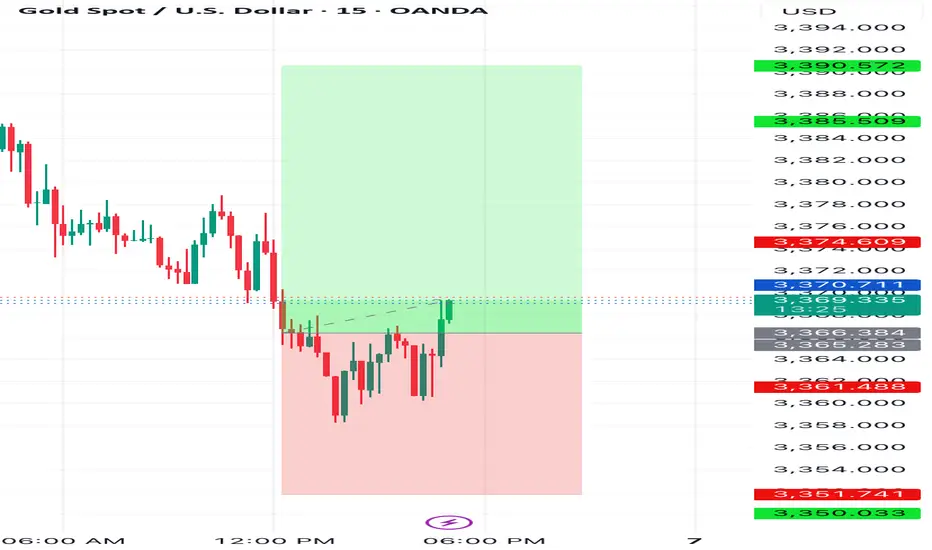
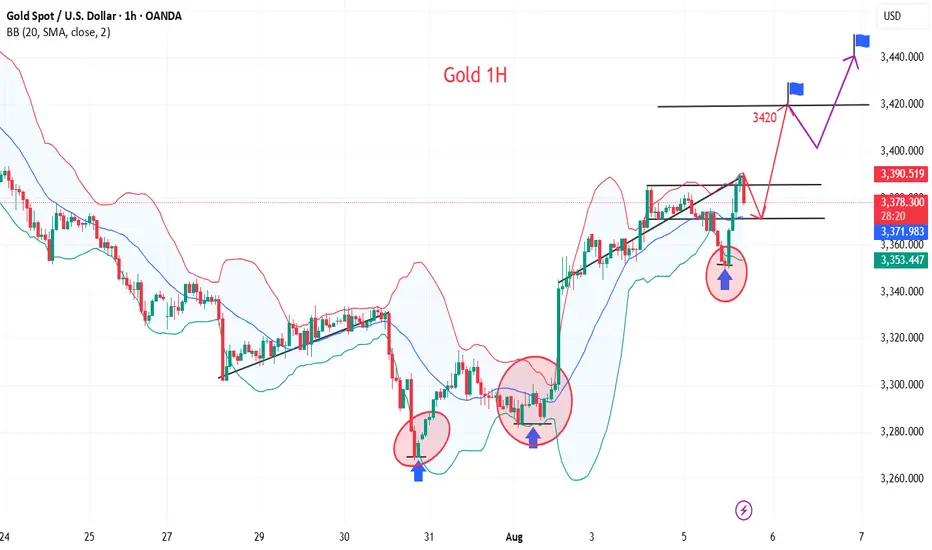
Minor Bullish Signs Inside Gold’s Bearish Range▋Observation & Meanings:
▪Price is currently trading within a broader range.
▪After touching the bottom of that range, price bounced and took out the prior high — signaling a potential minor uptrend beginning to take shape within the range.
▋Critical Questions:
🔹 Is the surge reliable?
▪Rather than reacting to a surge, it’s more constructive to wait for a clear uptrend. A valid uptrend only takes shape when price starts forming higher lows .
▪Also, recent behavior within the range suggests bearish pressure remains. Tops are rejected sharply, while bounces from the bottom are slower and more choppy.
🔹 What opportunities might be next?
1. A potential long trade toward the top of the range:
▪Look for price to pull back, form a higher low, then push through the previous high in one clean move.
▪The opportunity comes when the price retests the prior high, confirming a resistance-turned-support level.
▪Interesting finding: $3,387 might act as a strong resistance level . The last two bounces from
the bottom of the range both advanced about the same distance before pulling back. Could this time play out the same way?
2. Short opportunities inside the range:
▪This aligns with the current bearish skew .
▪Potential setups to watch for:
- A consolidation that breaks to the downside.
- When price drops through the bottom of the range without hesitation or buildup, it reinforces the bearish bias .
▋Mental Notes:
▪Range-bound markets can still provide opportunity — if you're clear about risk and structure.
▪Don’t predict the price, trade the price. Have a plan, but not blindly follow.
▪The market will always find ways to surprise. Stay open and follow the flow.
If you find the analysis helpful, drop a 🚀 to show some support — always open to thoughts and discussion!
▋Not Financial Advice:
The information contained in this article is not intended as, and should not be understood as financial advice. You should take independent financial advice from a professional who is aware of the facts and circumstances of your individual situation.

Gold Eliot analysis My predictions about gold in previous years have been quite accurate and calculated. Currently, I think a wave 4 correction, which is a micro-wave, is taking place. As we can see, this micro-wave will probably decrease between $2,700 and $3,000 and then advance to targets above $4,000. Majid Babaei Tehran August 1404

How to seize the best entry point for gold?Gold continued its bullish trend from last Friday, rising to a high of 3385 yesterday. However, the upward momentum failed to sustain, and new highs were not reached during today's Asian and European trading sessions. The short-term bullish trend has ended, and the market is showing signs of correction. Currently, gold is facing downward pressure in the short term, and the short-term trend is volatile. Strategically, we can watch for a rebound to the 3375-3385 area during the European trading session and try to participate in short-term short selling. The target is below 3365-3355. The long-term structure remains bullish. Therefore, if the price falls back to the 3355-3340 area and stabilizes, we can still consider entering long positions to continue the medium-term uptrend. In terms of trading, we should pay attention to the rhythm of the market, betting on rebound resistance with short-term short positions and then going long on dips, maintaining flexibility.

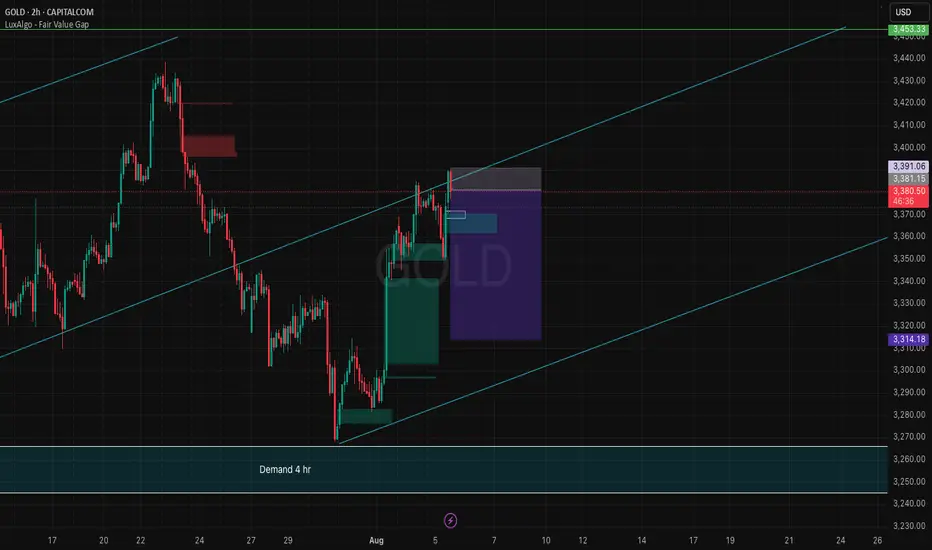
GOLD TO FILL THE IMBALANCE/BSL As the gold was touched the demand zone and fvg at the level of 3400/3419 we will see the trend reversal towards the imbalance/fvg with the buyside liquidity to be taken out.
We can set the trade when it will retest the demand zone again.

Daily gold analysisDaily gold analysis
A long position with the target and stop loss as shown in the chart
The trend is up, we may see more upside
All the best, I hope for your participation in the analysis, and for any inquiries, please send in the comments.
He gave a signal from the strongest areas of entry, special recommendations, with a success rate of 95%, for any inquiry or request for analysis, contact me
Gold Outlook This is my personal conviction on golds outlook \, anything can happen, always remember I do not won the market
GOLD Breakdown: Key Levels, Smart Money Trap & Price RecapHere's a full breakdown on GOLD covering the major levels I'm watching today, what the market did yesterday, and a key trap that many traders fall for.
This video is for educational purposes only and based on my personal trading plan.

Gold breaks through 3400 and is about to challenge a new high
💡Message Strategy
Fundamental Analysis: The Macro Environment and Policy Expectations Are Intertwined
From a fundamental perspective, the recent trend in gold prices is driven by multiple factors. First, rising expectations for a September Federal Reserve rate cut have become a key factor supporting gold prices. Last Friday's US non-farm payroll data, which fell short of expectations and saw a significant downward revision from the previous reading, fueled market concerns about an economic slowdown and pushed US Treasury yields lower.
The increased expectations for a rate cut have reduced the upside potential for the US dollar and US Treasury yields, indirectly providing support for gold.
In terms of market sentiment, a rebound in global stock markets has weakened gold's safe-haven demand. The MSCI World Index snapped a six-day losing streak, with the Asia-Pacific Index rising 0.6%. Japan's Nikkei 225 rose 280 points on Tuesday. Europe's STOXX 50 and STOXX 600 indices both rose approximately 0.4%. The UK's FTSE 100 approached its all-time high of 9,150 points. The three major US stock indices performed particularly strongly on Monday, with the S&P 500 rising 1.5%, the Dow Jones Industrial Average soaring 585 points, and the Nasdaq Composite Index rising 1.9%.
The recovery of risk appetite has made investors more inclined to chase high-yield assets, and the attractiveness of gold has temporarily declined.
📊Technical aspects
Technically, gold is likely to continue trading in a narrow range between its 50-day and 100-day moving averages. Key support levels at $3,350 and resistance at $3,385 will be the focus of near-term bull-bear trading. A breakout from fundamental data or news could signal a clearer trend for gold prices.
In the long term, slowing global economic growth, central bank gold purchasing, and persistent geopolitical risks will continue to provide structural support for gold.
If the bulls can regain their footing on the bottom of the ascending triangle pattern and break through the resistance level of $3,380, gold prices are expected to further challenge $3,440 and even retest the historical high.
💰Strategy Package
Long Position:3370-3375,SL:3350,Target: 3400-3420
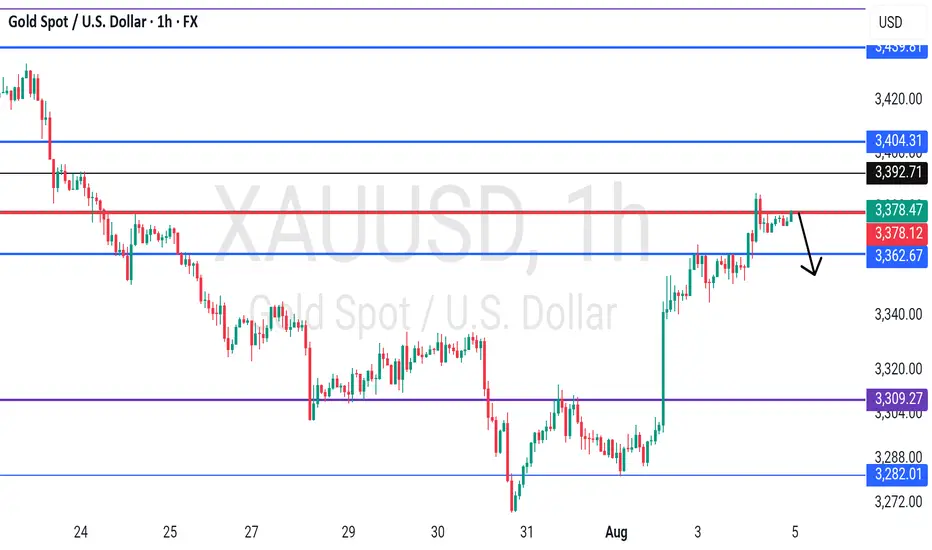
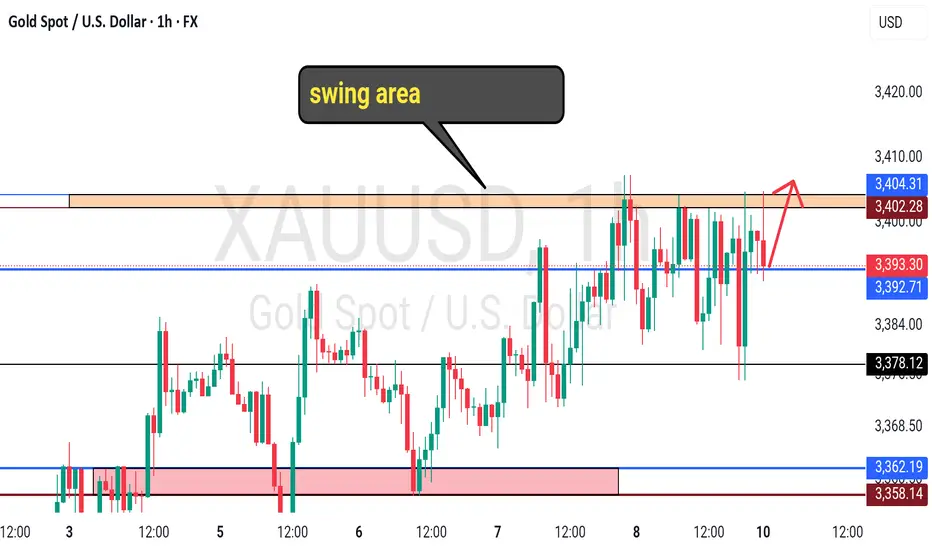
Gold in Tight Range – Breakout Above 3402 or Below 3383?GOLD – Market Overview
Gold is currently consolidating within the 3402 – 3384 range, awaiting a breakout for the next directional move.
Technical Outlook
Bullish Scenario:
A 1H close above 3402 would likely extend the bullish trend toward 3418 and 3436, with further potential toward 3447.
Bearish Scenario:
A 1H close below 3383 could trigger a move down to 3365, and possibly 3348.
🔹 Pivot Line: 3408
🔹 Resistance: 3418 – 3436 – 3447
🔹 Support: 3383 – 3365 – 3348

xau usd a probable scene Market can sweep its trend line liquidity and could take another buy entry at the given level.. and also can go to the target ...its just for an educational and study purpose , i dont recommend to take trade at this point. just watch and see
GOLD - at resistance ? Whats next ??#GOLD... market just reached at his current resistance area and that is 3378-79
Keep close and if market holds the cdrop expected from here.
Good luck
Trade wisely
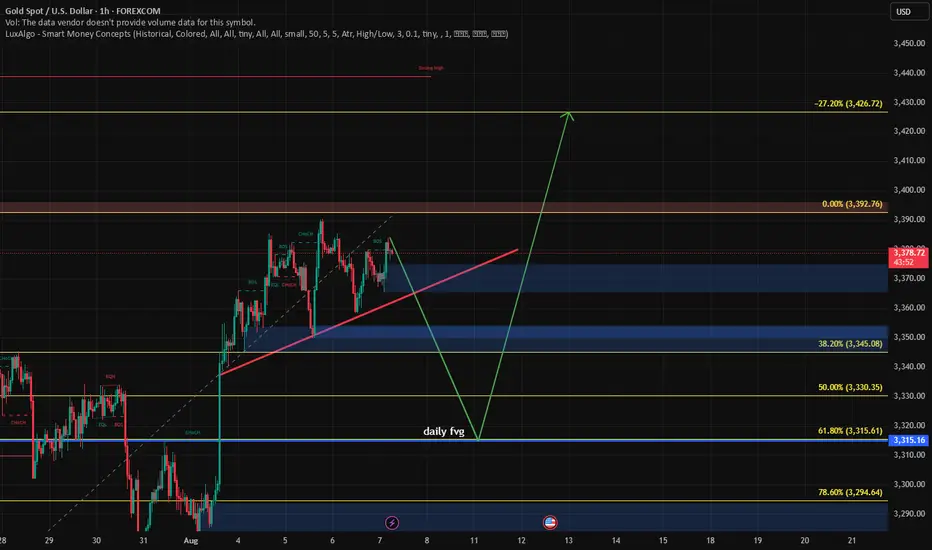
XAUUSD (GOLD): Bullish Impulsive Move Up Friday! Wait For Buys!In this Weekly Market Forecast, we will analyze the Gold (XAUUSD) for the week of Aug 4 - 8th.
Gold is bullish on the Monthly, Neutral on the Weekly, Bullish on the Daily.
The aggressive move higher after bad job numbers caused a shift in the market from bearish to bullish on the D1 time frame.
Be wary of the pullback, as that move is likely to be corrected, but that would set up a great long opportunity!
Enjoy!
May profits be upon you.
Leave any questions or comments in the comment section.
I appreciate any feedback from my viewers!
Like and/or subscribe if you want more accurate analysis.
Thank you so much!
Disclaimer:
I do not provide personal investment advice and I am not a qualified licensed investment advisor.
All information found here, including any ideas, opinions, views, predictions, forecasts, commentaries, suggestions, expressed or implied herein, are for informational, entertainment or educational purposes only and should not be construed as personal investment advice. While the information provided is believed to be accurate, it may include errors or inaccuracies.
I will not and cannot be held liable for any actions you take as a result of anything you read here.
Conduct your own due diligence, or consult a licensed financial advisor or broker before making any and all investment decisions. Any investments, trades, speculations, or decisions made on the basis of any information found on this channel, expressed or implied herein, are committed at your own risk, financial or otherwise.

Discipline Ends Where Hope Begins“The moment you start hoping… you’ve already left your plan behind.”
Most traders think they lose because the market “turned against them.”
But in reality — it’s when their mind turned against their rules.
Hope is silent at first.
It whispers when your stop loss is near:
“Just a little more room…”
It whispers when price is almost at your target:
“Maybe it can go further…”
In both cases, it’s the same enemy wearing two masks.
And the instant you listen — discipline ends .
Here’s the paradox:
Hope feels good.
Discipline feels hard.
But in trading, the thing that feels hard is the thing that saves you.
Rules are the antidote to hope.
You don’t “feel” your way through a trade.
You execute your way through it.
Some of the most dangerous trades aren’t the obvious losses —
They’re the ones you “saved” by breaking your rules.
Because now, you’ve trained your mind that hope works.
Until it doesn’t. And when it fails… it takes everything.
What I’ve shared here is only a fragment of the psychology I’ve written about in The Chart is the Mirror .
The deeper process — how to replace hope with pure, unshakable execution — is something I’ve reserved for readers who truly want to rewire their trading mind.
📘 Shared by @ChartIsMirror
Comment below if this hits home for you. Or tell me — which part of trading psychology should I uncover next?

GOLD - at support ? What's next??#GOLD... Perfect move as per our video analysis and now market just at his current immediate supporting level.
That is 3392-93
Keep close and if market hold it in that case we can expect bounce otherwise not..
NOTE: we will go for cut n reverse below 3392-93 on confirmation.
Good luck
Trade wisely
Gold consolidates amid Fed speculation and political uncertaintyGold prices advanced during the North American session as market participants increasingly speculate that the Federal Reserve (Fed) may initiate rate cuts at its upcoming September meeting.
Bullion has been in recovery mode since last Friday, after the July Nonfarm Payrolls (NFP) report revealed significant downward revisions to May and June figures. The labor market surprise led investors to begin pricing in a 25 basis point rate cut, reviving demand for non yielding assets like gold.
Adding to the dovish narrative, Tuesday’s ISM Services PMI showed a deceleration in business activity, falling short of economists’ expectations. Meanwhile, June’s trade deficit narrowed, according to data from the Commerce Department, pointing to mixed signals from the US economy.
Political uncertainty at the Fed is also in focus. The resignation of Governor Adriana Kugler has opened the door for President Donald Trump to appoint a successor. Importantly, the vacancy also paves the way for Trump to potentially nominate a new Fed Chair.
On the trade front, new tariffs set to take effect on August 7 are expected to range between 10% and 41%, according to recent announcements. Research from Yale’s Budget Lab shows the average US tariff rate has risen to 18.3%, marking the highest level since 1934, further fueling concerns about inflation and global growth.
Technically, gold appears poised to challenge the $3,400 level, supported by safe haven demand and softer macro data. However, the rebound in US Treasury yields and strengthening of the US dollar could limit further upside, especially after bullion touched an eight day high of $3,390.
Looking ahead, markets will closely monitor upcoming US Jobless Claims, Consumer Sentiment figures, and comments from Fed speakers, all of which could provide further insight into the central bank’s next policy move.
The forecasts provided herein are intended for informational purposes only and should not be construed as guarantees of future performance. This is an example only to enhance a consumer's understanding of the strategy being described above and is not to be taken as Blueberry Markets providing personal advice.

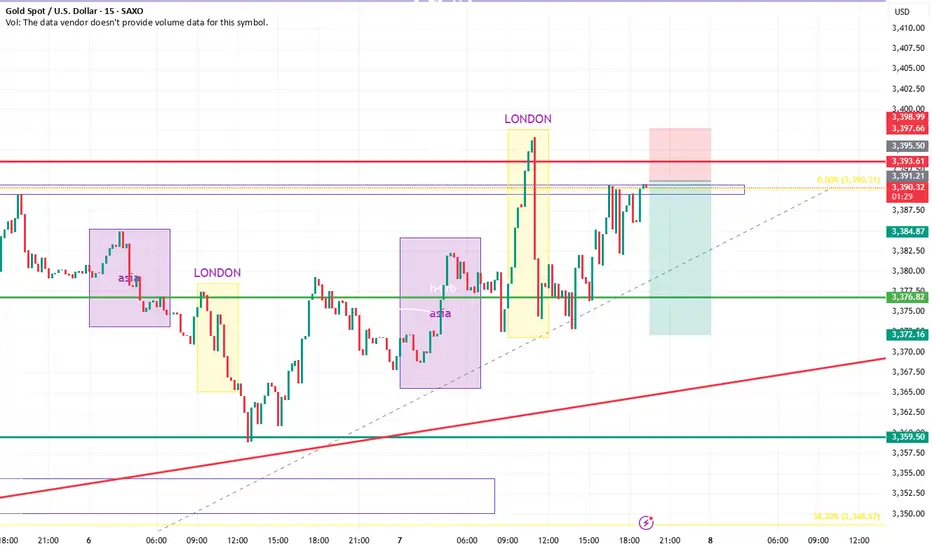
Smart Money Concept (SMC)📉 XAU/USD Bearish Analysis – SMC
🔹 1. Market Context
The price has completed mitigating key areas and has shown rejection at the resistance zone, leaving signs of exhaustion in the bullish structure.
🔹 2. Creation of the 1H FVG
A Fair Value Gap (FVG) has developed on the 1-hour timeframe to the downside. This liquidity gap typically acts as a magnet for the price, increasing the probability of a downward continuation.
🔹 3. Price Structure
• BOS (Break of Structure) confirming a bearish reversal
• Previous fake out absorbing liquidity from buyers
• Rejection at resistance and breakout of support
🔹 4. Zones of Interest
• Entry: Rejection at the resistance zone
• Target: OB-1H at levels of 3,352–3,355
• Stop Loss: Above resistance to protect against a fake out
🔹 5. Expectation
The price could continue to fall, filling the FVG and seeking to completely mitigate the 1H Order Block, aligned with institutional bearish intentions.
⸻
💡 Summary:
“With the creation of the 1H FVG and the mitigation of previous zones, the scenario shows a high probability of a bearish movement towards the OB-1H. Strategy based on structure, liquidity, and institutional mitigation.” GOOD LUCK TRADERS…;)

Gold’s Uptrend Faces Critical Test at Channel ResistanceThe current price action on GOLD remains confined within a well-defined ascending channel, reflecting a steady bullish structure. Recent bounces from the lower boundary have reinforced buyers’ confidence, while sellers have struggled to push the market below key support levels.
However, despite the upward structure, momentum is showing early signs of fatigue as the price approaches the channel’s upper boundary. Without a decisive breakout, the probability of a temporary pullback or consolidation phase increases substantially.
This is a sensitive zone for new entries without confirmation. A clean breakout above the channel could trigger fresh buying pressure, but a failure here may trap late buyers and lead to a sharp retracement. Patience remains essential — wait for a confirmed break or rejection before committing to a position.

08/08/25 Gold Swing Levels08/08/25 levels are marked; expecting an up trend
Always, price action determines trade.
Trade parameters
Entry on 5 min chart
Sl: 30-50pips
TP: 2-4x SL

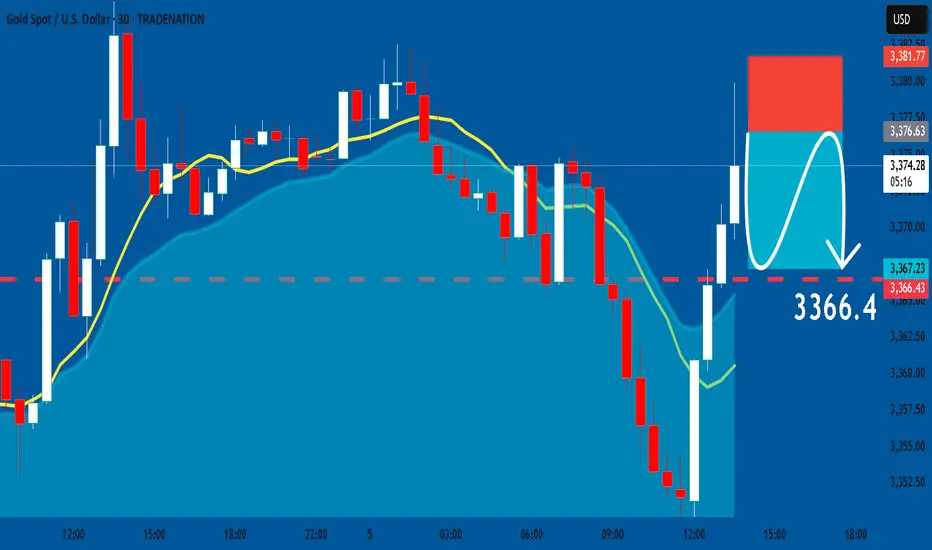
GOLD: Short Signal with Entry/SL/TP
GOLD
- Classic bearish setup
- Our team expects bearish continuation
SUGGESTED TRADE:
Swing Trade
Short GOLD
Entry Point - 3376.5
Stop Loss - 3381.7
Take Profit - 3366.4
Our Risk - 1%
Start protection of your profits from lower levels
Disclosure: I am part of Trade Nation's Influencer program and receive a monthly fee for using their TradingView charts in my analysis.
❤️ Please, support our work with like & comment! ❤️