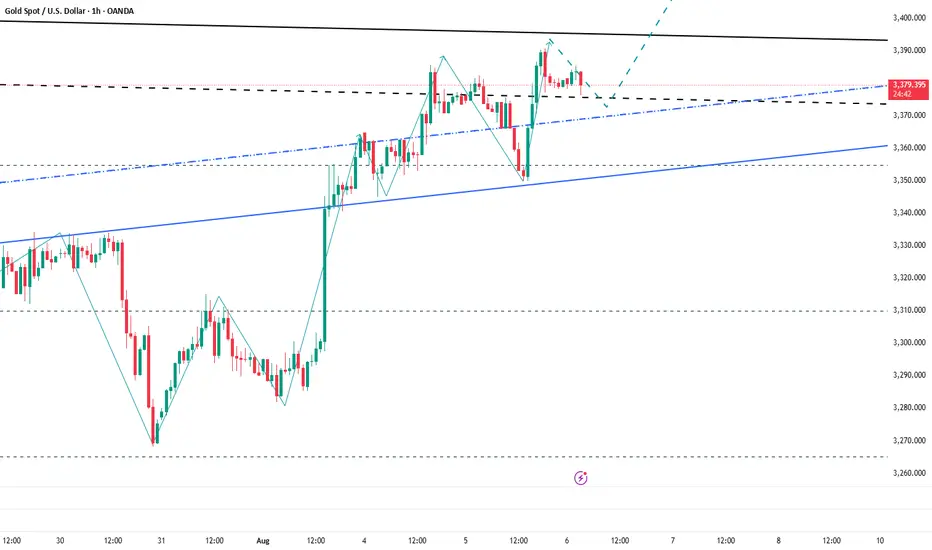
my opinion about next move gold h1 tf let see my opinion about next move gold h1 tf let see if you need any think about our analysis coments right this chart
XAUUSD trade ideas

Mechanical vs. Anticipation Trades: The Fine LineWhen traders talk about discipline, they often refer to following rules — sticking to a plan, being methodical, and avoiding emotional decisions. But there's a subtle and powerful difference between being rule-based and being blindly mechanical. And even more, there's a moment in every trader’s process where discipline demands adaptation.
Let’s look at a recent trade on Gold to understand this better.
On Thursday, I published an analysis on Gold stating that the recent breakdown of support had turned that zone into resistance. A short entry from that level made sense.
It was mechanical, clean, and aligned with what the chart was showing at the time.
And, at first, it worked. Price rose into the resistance area and dropped. Perfect reaction. Textbook setup. Confirmation. The kind of trade you want to see when following a rule-based system.
But then something changed.
Price came back. Quickly.(I'm talking about initial 3315-3293 drop and the quick recover)
So, the very next rally pushed straight back into the same resistance area, hmmm...too simple, is the market giving us a second chance to sell?
That was the first sign that the market might not respect the previous structure anymore.
It dipped again after, but the second drop was different: slower, weaker, choppier.
That told me one thing: the selling pressure was fading.
So I shifted. From mechanical execution to anticipatory mindset.
This is where many traders struggle — not because they don’t have a system, but because they don’t know when to let go of it. Or worse: they abandon it too quickly without cause.
In this case, the evidence was building. The failed follow-through. The loss of momentum. The compression in structure. All signs that a reversal was brewing.
Rather than continuing to blindly short, referring to a zone that no longer held the same weight, I started looking for the opposite: an upside breakout and momentum acceleration.
That transition wasn’t based on emotion. It was based on market behavior.
________________________________________
Mechanical vs. Anticipation: What’s the Real Difference?
A mechanical trade is rule-based:
• If X happens, and Y confirms, then enter.
• No need for interpretation, no second guessing.
• It can (in theory) be automated.
An anticipatory trade is different:
• It’s about reading intent in price action before confirmation.
• Higher risk usually, but higher reward if you’re right.
• Can’t be automated. It requires presence, experience, and context.
And the tricky part? Often, we lie to ourselves. We say we’re "mechanical" while actually guessing. Or we think we’re being smart and intuitive, when in fact, we’re being impulsive.
The key is awareness.
In my Gold ideas, the initial short was mechanical. But the invalidation came quickly — and I was alert enough to switch gears. That shift is not a betrayal of discipline. It’s an upgrade of it.
________________________________________
Final Thoughts:
Discipline is not doing the same thing no matter what. Discipline is doing what the market requires you to do, without emotional distortion.
And that, often, means walking the fine line between the setup you planned for, and the reality that just showed up.
Disclosure: I am part of TradeNation's Influencer program and receive a monthly fee for using their TradingView charts in my analyses and educational articles.

Bullish Momentum Builds: Gold Set to Challenge 3400 and BeyondAlthough gold encountered resistance again near 3385 in the short term, the retracement has not been effectively continued so far, and the downward momentum is not particularly strong. Gold has always remained above the 3375-3365 area, with strong buying support below and the market bearish sentiment is not serious. In comparison, the bulls still have a considerable advantage!
The current gold price structure clearly maintains a strong bullish trend. With gold reclaiming the 3375-3365 area yesterday, bullish sentiment has further strengthened. As gold's center of gravity shifts upward, multiple strong support areas have formed below, limiting any potential pullbacks and further supporting its upward trajectory. Therefore, as long as gold can maintain above the 3375-3365 area, I believe that gold will definitely refresh the short-term high of 3390 again, and is expected to launch a strong impact on the 3400 mark, and may even continue to the 3420-3430 area.
So for short-term trading, I don’t have much desire to short gold for the time being. I am happy to watch for opportunities to enter long positions after gold retreats to the 3375-3365 area!
Is it good to enter now for a long on $GOLD?TVC:GOLD The risk reward is not great if i enter into long at these level. I would rather wait for a pullback to weekly 50% range or a break and retest on the high as annotated to enter. Let me know your thoughts.

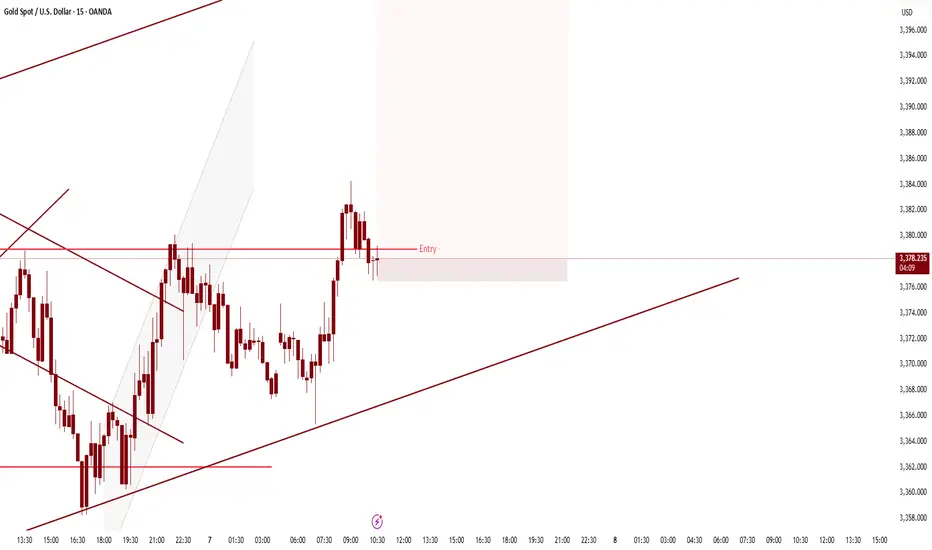
XAUUSD 15m Short – Rejection from Supply ZoneGold (XAUUSD) is showing clear signs of rejection from a lower time frame supply zone near 3,377. After a sharp rally, price tapped into the resistance and failed to break higher, forming a potential bearish setup.
Entry: ~3,377 (supply zone rejection)
Stop Loss: Above 3,385 (structure break invalidation)
Take Profit: Around 3,350 (previous demand zone)
This is a classic short setup following a liquidity sweep and bearish engulfing confirmation. Risk-to-reward is favorable, and price is respecting the intraday range structure.
⚠️ Always follow your risk management plan.
📊 Strategy: Price Action + Supply & Demand

Gold structure 1H timeframe for Aug 2025The Gold 1H timeframe looks like a rectangle pattern structure for Aug 2028, looks at the key point ABCD direction plan

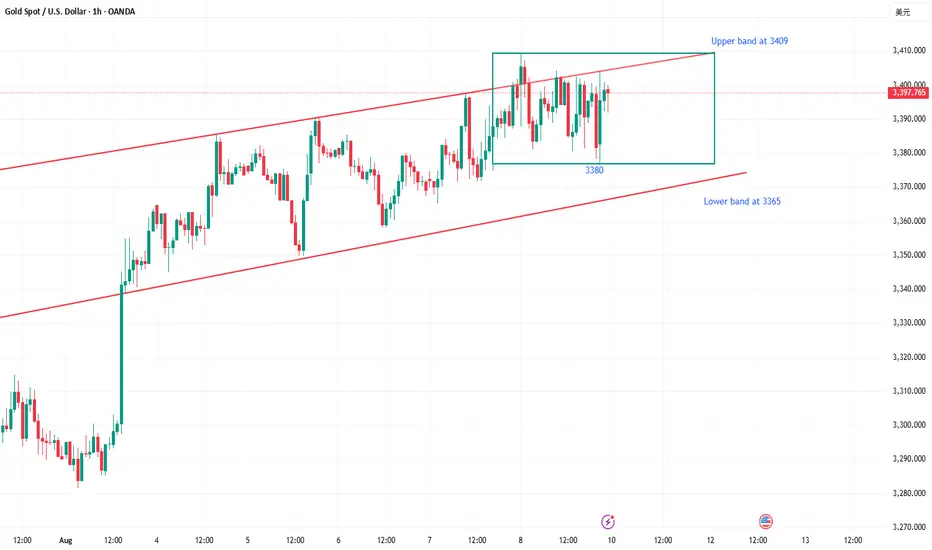
Bullish momentum remains. New catalysts?Next week's risk events:
1. US July CPI data and Reserve Bank of Australia interest rate decision
2. US July PPI and initial jobless claims
3. US July retail sales, core retail sales, and the University of Michigan preliminary consumer confidence index.
The market will focus on whether the impact of tariffs begins to show up in inflation data and whether consumer spending data confirms economic resilience. A mild reading would reinforce expectations of a rate cut, positive for US stocks and gold. An unexpectedly high inflation rate could delay the Fed's pace of easing, weighing on risk assets and supporting the US dollar.
Gold's continued rise this week is a continuation of the strong non-farm payroll report. Although there have been slight dips along the way, it has stabilized above the mid-line, and the upward resistance has been fluctuating. Therefore, there is a high probability of further breakouts next week.
Judging from the 1-hour line, each decline was not sustained, and then buying intervened and the market began to rise sharply, so the current big cycle is still bullish, but it is not certain that the upward trend will break out next week without a major positive push. Only if it holds above the 3410 level and allows for extended correction time will new momentum emerge next week to continue its breakout trend.
Trading Strategy:
Short around 3405, stop loss at 3415, profit range 3380-3370
Long around 3375, stop loss at 3365, profit range 3390-3400-3410.

XAUUSD GOLD H1 ANALYSIS BUY NOW 3365 XAUUSD (Gold) Trade Update:
Gold is currently a buy at 3365, with an upside target of 3420. The support area is at 3348, while the resistance is seen around 3380. Traders who have been following my analysis are advised to hold their positions strongly and stay confident in the setup. This move aligns with the ongoing bullish momentum, so stay focused and manage your trades accordingly.

XAU BULLISH 0708025XAUUSD is currently in a strong uptrend on both the primary and secondary waves. The minor trend has broken out of its previous bearish trend.
Stop Loss (SL) and Take Profit (TP) levels are as shown in the image.
GOLD Resistance Ahead!
HI,Traders !
#GOLD keeps growing
Locally but a strong horizontal
Resistance is ahead at 3443.87
So after the retest we will
Be expecting a local
Bearish pullback !
Comment and subscribe to help us grow !

Ascending triangleIt seems probable that gold resolves to the upside from here based on the ascending triangle.

XAUUSD Gold Intraday Setup 8 Aug 2025Price is currently respecting the ascending trendline and a nearby demand zone around 3385. If price holds above this level, a potential long setup may develop.
Entry: Around 3385 (upon confirmation of support holding)
Stop Loss: Below 3375 (invalidate if this low breaks)
Target: Previous swing high near 3409
The setup aligns with the ongoing bullish structure. Monitor price action near the trendline for confirmation before entering.

SMART MONEY CONCEPT (SMC)📉 Análisis Bajista XAU/USD – SMC
🔹 1. Market Context
Price completed the mitigation of the 4H FVG, closing the previous bullish cycle. This opens the door for a new bearish impulse, as there is no remaining imbalance to fill in that zone.
🔹 2. Structure Shift
• Trendline break confirming loss of bullish momentum
• Clear ChoCh and BOS after the break
• Strong rejection at the resistance zone
🔹 3. Entry Zone
• 15M Order Block (OB-15M) marked as optimal sell entry after rejection
• Entry aligned with bearish structure confirmation
🔹 4. Target
• Aiming for the support zone, where resting liquidity is likely to be taken
• Stop Loss placed above resistance to protect from potential fake outs
💡 Summary:
Bullish cycle completed → structure shift → resistance rejection → bearish projection towards support with high probability. GOOD LUCK TRADERS… ;)

August 8, 2025 - XAUUSD GOLD Analysis and Potential OpportunitySummary:
Price is hovering near a key inflection zone. 3388 acts as the current bull-bear dividing line. If price holds below it, bearish momentum may continue. If price breaks above 3395, bulls could regain control. Until then, watch for rejection near resistance and possible long setups near the lower support band. Patience is key — wait for confirmation around the outlined levels.
📍 Key Levels to Watch:
• 3408 – Resistance
• 3402 – Resistance
• 3397 – Resistance
• 3388 – Bull-bear dividing line
• 3375 – Support
• 3365 – Support
• 3350 – Psychological support
• 3345 – Support
• 3334 – Support
📈 Intraday Strategy
SELL below 3387, targeting 3385, then 3380, 3375, 3370
BUY above 3395, targeting 3397, then 3402, 3408, 3410
👉 If you find this helpful or traded using this plan, a like would mean a lot and keep me motivated. Thanks for the support!
Disclaimer: This is my personal view, not financial advice. Always use proper risk control.

Report - 8 August, 2025EVENT OVERVIEW & MARKET REACTIONS
President Trump’s decision to double existing tariffs on Indian imports—from 25% to a total of 50%—has escalated geopolitical tensions, especially as the justification centers on India’s continued purchase of Russian oil. This marks a significant deterioration in U.S.-India relations, which had been relatively stable despite differences in trade and defense procurement. New Delhi responded sharply, denouncing the tariffs as “unfair” and “unreasonable.” Market reaction in India was immediate, with the Nifty 50 falling 1.2% intraday and the rupee weakening slightly against the dollar, reflecting investor nervousness over geopolitical risk.
In the U.S., equity markets shrugged off the geopolitical risk, buoyed by strong corporate earnings and major announcements like Apple’s $100bn domestic investment to relocate manufacturing and circumvent tariffs. The S&P 500 and Nasdaq gained 0.7% and 1% respectively. Apple shares rose 5.8% after the White House praised its reshoring strategy, helping mask broader anxieties. The dollar index (DXY) fell 0.4% as markets increased bets on imminent Fed rate cuts. U.S. 10-year Treasury yields rose 4bps to 4.23%, suggesting some reallocation from bonds into equities despite Fed dovish expectations.
Oil markets remained volatile but ultimately firmed slightly, as traders weighed OPEC+'s impending production increases against longer-term structural demand from India and China. Crude oil held near $78/barrel, while gold remained elevated at $2,072/oz, underscoring lingering investor caution amid geopolitical and monetary uncertainty.
STRATEGIC FORECASTS
The doubling of tariffs on India is not just a bilateral issue—it is a strategic signal. Trump is making it clear that U.S. allies who defy his energy sanctions regime will be punished economically, regardless of shared democratic values. This recalibration raises risks of fragmentation among the so-called "Indo-Pacific Quad" and undermines the credibility of U.S.-India defense cooperation, which had recently expanded under frameworks like iCET (Initiative on Critical and Emerging Technology).
In the near term, India will likely seek to diversify its export markets while doubling down on domestic resilience policies. However, the Modi administration will also be under pressure from global investors—particularly those supporting the "China+1" strategy—to maintain open channels with Washington. The Apple announcement only intensifies pressure on India, as it highlights the cost of geopolitical non-alignment.
Elsewhere, geopolitical instability continues to compound: Berkshire Hathaway shares are underperforming as Warren Buffett exits; UK-China relations are fraying over embassy construction; and Switzerland continues to reel from a 39% tariff shock. These converging flashpoints are indicative of a more transactional, power-politics-driven global order in which traditional alliances no longer guarantee trade security.
FISCAL AND POLITICAL IMPLICATIONS
Trump’s tariff war is no longer just about economic protectionism—it is now a tool of direct foreign policy coercion. The targeting of India, despite its status as the fifth-largest economy and a major U.S. trade partner, shows a willingness to weaponize the U.S. consumer market against strategic allies. For India, this is politically damaging. The Modi government had made substantial diplomatic overtures to Washington and is now politically cornered between maintaining sovereignty in energy policy and sustaining access to its largest export market.
For the U.S., there are short-term political gains. Trump’s base is likely to support these aggressive moves as evidence of “economic patriotism,” and domestic reshoring by companies like Apple lends weight to his industrial revival narrative. However, the long-term cost could be a more fractured, de-dollarized trading world, with allies exploring new coalitions that reduce exposure to U.S. leverage.
RISKS
Geopolitical Fracture: The breakdown in U.S.-India ties could ripple through other Indo-Pacific partnerships, weakening containment strategies against China.
Investor Sentiment in India: With India now seen as a target rather than a partner, capital inflows could slow, especially in high-growth sectors like electronics manufacturing.
Commodities Volatility: Continued weaponization of oil trade—whether through tariffs or sanctions—keeps crude markets vulnerable to shocks.
Policy Overreach: Trump’s escalating use of trade tools risks overplaying U.S. leverage, potentially provoking multilateral backlash or retaliatory coalitions.
OPPORTUNITIES
U.S. Tech Reindustrialization: Apple’s $100bn commitment shows companies can turn geopolitical headwinds into domestic capex tailwinds—bolstering U.S. factory growth.
Gold as Safe Haven: With the Fed likely to ease and global risks rising, gold is well-positioned to continue attracting risk-averse capital.
Currency Arbitrage: USD weakness opens the door for tactical positioning in high-yield currencies like INR and BRL—if investors can hedge policy volatility.
Reshoring Supply Chains: The shift of production from India, China, and Southeast Asia to U.S. and Mexico-based facilities presents a logistics and construction boom in North America.
ASSET IMPACT OUTLOOK
XAUUSD (Gold)
Safe-haven demand is strong amid worsening U.S.-India relations and fears of sanctions spillovers. Real yields are falling; Fed dovishness supports further upside.
S&P 500
Strong corporate earnings and reshoring announcements are temporarily offsetting macro fears. But any further escalation in tariffs could pressure margins and global exposure.
USDJPY
As the dollar softens on dovish Fed bets and rising geopolitical risk, JPY gains as a safe-haven. Yen could strengthen further if bond volatility stabilizes.
DXY (US Dollar Index)
Despite strong U.S. equities, softer data and rising expectations for rate cuts are pushing the dollar lower. DXY could test 101 in coming weeks.
Crude Oil (Brent/WTI)
Volatile. OPEC+ supply increases are counterbalanced by continued demand from India and fears of sanctions. Oil likely range-bound $75–$82 near term.
Dow Jones
Blue-chip industrials may benefit from reshoring and stimulus bets, though tariff risks remain. Broad market support from positive earnings surprises.
INR (Indian Rupee)
Facing downside pressure from geopolitical risk premium, outflows, and weaker confidence in export stability. May weaken toward 84.5 per USD short term.

XAUUSD The beginning of large-scale growthCurrent picture and structure
The instrument is trading in a narrow range of $3,360-3,375, demonstrating low volatility - ADX is at the low of 2025, which confirms consolidation
The price is held inside a long-term ascending channel, with an increase of about 27% since the beginning of 2024
Indicators and signals
RSI (14): around 58-59, indicates moderate overbought, but remains in the bullish momentum zone
Stochastic (%K ~61%) and MACD (value ~3.8): Buy signals - short-term upward momentum is confirmed
ADX (14): around 23-24 - range, weak trend without a clear direction
Moving averages on different timeframes give a common signal indicator "Strong Buy" in daily and weekly frames
Support and resistance levels
Key support:
$3,360 — current lower stop range
$3,330–3,293 — swing low zone, critical for short-term sales
Main resistance:
$3,400–3,415 — profit acceptance zone and possible reversal pressure
$3,450 — psychological and technical barrier upon breakout of current zone
It’s that simple to catch the golden trend.On Friday, gold did not break through the highs or the bottoms, and maintained the range of 3400 to 3380, which was in line with our expectations. In the analysis layout on Friday, I made it clear that I would short at the pressure of 3400 during the day, and go long at the support near 3380 before and after the US market, with an overall gain of 580pips. The points were accurate and there was no error. It was proven by strength that in this market, as long as you don’t chase orders, it is relatively easy to make some profits. Don’t always think about betting on the breakout of the market. Wait for the breakout before doing anything. Just do well in the present. It's better to miss than to do it wrong. The key is how you choose. Stability comes first.
Gold continued to close positively on the weekly chart this week, and after hitting the bottom at 3368 and rebounding, it rebounded with large volume. It is in the process of gradually touching the upper track of the range. Normally, there is still room above, and the range pressure is at 3450. Therefore, we will continue to maintain a bullish mindset next week. In the daily cycle, it fluctuated and washed out repeatedly on Friday, and finally closed with a negative cross star. In the short term, it will maintain operation in the small range of 3409-3380. In terms of operation, continue to go high and buy low before the range is broken, and follow the trend after the breakthrough; an upward breakthrough can be seen at 3425 and 3450, and a downward breakthrough can be seen at 3365 and 3345. For the specific operation rhythm, pay attention to the real-time notification at the bottom.
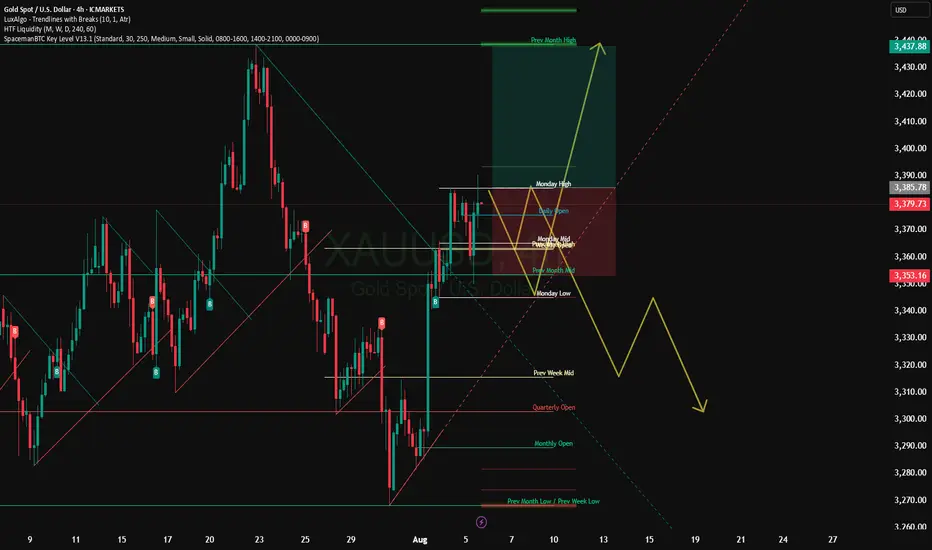
What does the sharp drop in gold prices on Monday mean?
Last week saw a generally volatile rally, with rising lows and higher highs. However, each breakout was followed by a rapid decline. If the decline failed to break the previous low, the market would continue to rise and break the previous high.
This meant a rise of around $40, followed by a $20-30 correction.
The second half of the week saw repeated testing of the 3405 area, with rapid declines following the breakout, keeping the correction within a $30 range.
However, today, Monday, this rhythm was disrupted. Due to the US's frenzy, the price immediately declined after hitting 3405 in early trading, breaking below the 3380 area, which was repeatedly tested last Friday. This area is also the upper limit of the purple channel line and the double line on the hourly chart.
It further declined to the 3367 area, where it experienced a rapid rise and repeatedly tested the 3380-3380 range. 2. Support and Resistance Switching Positions
Before the European session, the decline continued, reaching the 3357-3356 level, expanding the scope of the sweep and the strength of the decline.
At this point, the entire price has returned to the double-line range on the hourly chart.
This brings us to the recent cycle points. The rhythm shift is a two-step process: the first step is a return to the double-line range, and the second step is a breakout of the double-line range.
The first step is now a return to the double-line range, with the upper band at 3380-3382 and the lower band at 3358-3354, where multiple supports are present.
For now, we will focus on the upper and lower bands of this double-line range. We will then focus on the second step of the breakout, switching between spaces and shifting the rhythm.
To elaborate:
1. Rhythm Switching Point: The first step is a return to the double-line range, and the second step is a breakout of the double line. Range
Now we've returned to the double-line range, with resistance at 3380-3382 and support at 3358-3354.
2. The daily chart remains in the range from the lifeline to the upper band. The lifeline at 3356 coincides with the upper double-line lower band, while upper band resistance lies at 3432.
3. The four-hour chart has flattened, showing a sweeping pattern. The lifeline is at 3382, and the lower band and the double-line lower band coincide at 3358-3356. This coincides with the double-line on the hourly chart.
This also corresponds to a shift in space and rhythm:
First, a downward breakout occurs. The four-hour chart opens, and the price breaks below the double-line on the hourly chart, turning it into resistance and guiding a downward trend.
Second, an upward breakout occurs. The four-hour chart breaks through the lifeline, breaking through the double-line on the hourly chart, and moving upward. Switching space, watch the 3405 area upwards. Repeatedly test this area, focusing on this area first. Once it breaks through, then look for a switch.
Thus, for gold today, after a sharp drop at the opening, it entered a dual-line range. During the European trading session, the price fluctuated around this dual-line range. Tentatively, this sweep within the dual-line range will see resistance at 3380-3382 and support at 3358-3356.
Watch for a sweep within this range. Once the price breaks through, look for further switching. Using the principle of equal distance profit margins, consider a halving of approximately $25.
Based on this approach, go long in the 3358-3354 area. Those already in the market should continue holding, with a stop-loss near 3348. The target is 3372, followed by 3380-3382. A breakout will switch space.


GOLD 7.8.25 I see reversal for last NFP bullish momentum. Already in sells and watching. It can take 4H FVG 35-25 and go UP, so lets make it!

XAU / USD 30 Minute Chart Quick Scalp SellHello traders. As per my previous post, gold moved through my area of interest and I took a small micro lot position. Sold from the red line, closed 75% of the trade's profit at the next red line. My remaining 25% of the trade is the runner, and I will let that run for a bit. My Stop loss is at my entry point, so zero loss, profit secured and I am thankful to BIg G. Let's see what the NY open does in a few hours. Be well and trade the trend. More analysis to come.

XAU / USD Daily ChartHello traders. We are at an area of interest for me which is marked on the chart. We can push down to fill that wick, or reject and move back up a bit to take out any existing short positions in profit. I will post a lower time frame chart shortly. We will see Pre NY volume starting in a little under 2 hours. 7:20 am est here in the US is when we someimes see a shift to sometimes partially correct the overnight session's move. Not saying that's what will happen, just explaining what I see happen a lot of the time. Let's see how things play out. Be well and trade the trend. Shout out to Big G.

gold closed bullishgold is still strong in bullish
hence safest trade is still to look for buys until it shows a clear sign of sell.
