GOLD ROUTE MAP UPDATEHey Everyone,
This is a follow-up update on our 1H chart and what can I say, another amazing result!
After hitting our bullish target at 3370 earlier this week, we confirmed the EMA5 cross and lock above 3370 confirming 3392, which I continued to highlight and remind as we bought the dips throughout the week. And today, we finally completed 3392 to perfection.
Next, we’ll be watching for an EMA5 lock above 3392 for a potential continuation. If that fails to lock, we may see some range play between 3392 and 3370.
We will keep the above in mind when taking buys from dips. Our updated levels and weighted levels will allow us to track the movement down and then catch bounces up.
We will continue to buy dips using our support levels taking 20 to 40 pips. As stated before each of our level structures give 20 to 40 pip bounces, which is enough for a nice entry and exit. If you back test the levels we shared every week for the past 24 months, you can see how effectively they were used to trade with or against short/mid term swings and trends.
The swing range give bigger bounces then our weighted levels that's the difference between weighted levels and swing ranges.
BULLISH TARGET
3370 - DONE
EMA5 CROSS AND LOCK ABOVE 3370 WILL OPEN THE FOLLOWING BULLISH TARGETS
3392 - DONE
EMA5 CROSS AND LOCK ABOVE 3392 WILL OPEN THE FOLLOWING BULLISH TARGET
3416
EMA5 CROSS AND LOCK ABOVE 3416 WILL OPEN THE FOLLOWING BULLISH TARGET
3429
EMA5 CROSS AND LOCK ABOVE 3429 WILL OPEN THE FOLLOWING BULLISH TARGET
3439
BEARISH TARGETS
3348
EMA5 CROSS AND LOCK BELOW 3348 WILL OPEN THE FOLLOWING BEARISH TARGET
3328
EMA5 CROSS AND LOCK BELOW 3328 WILL OPEN THE FOLLOWING BEARISH TARGET
3313
EMA5 CROSS AND LOCK BELOW 3313 WILL OPEN THE SWING RANGE
3296
3281
As always, we will keep you all updated with regular updates throughout the week and how we manage the active ideas and setups. Thank you all for your likes, comments and follows, we really appreciate it!
Mr Gold
GoldViewFX
XAUUSD trade ideas

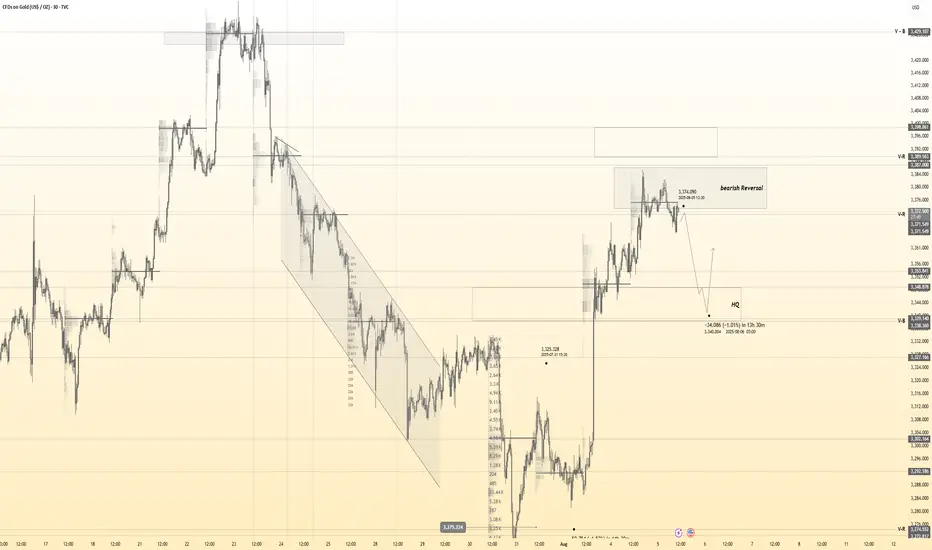
Gold 30Min Engaged ( Bullish Entry Detected )Time Frame: 30-Minute Warfare
Entry Protocol: Only after volume-verified breakout
🩸Bullish Reversal - 3340
➗ Hanzo Protocol: Volume-Tiered Entry Authority
➕ Zone Activated: Dynamic market pressure detected.
The level isn’t just price — it’s a memory of where they moved size.
Volume is rising beneath the surface — not noise, but preparation.
🔥 Tactical Note:
We wait for the energy signature — when volume betrays intention.
The trap gets set. The weak follow. We execute.

DeGRAM | GOLD rebound from the support line📊 Technical Analysis
● XAUUSD is consolidating within a narrowing wedge, holding above the 3,309–3,320 support zone while repeatedly testing the upper boundary.
● A breakout above 3,366 would confirm bullish momentum toward 3,435, with dips likely finding buyers at mid-channel support.
💡 Fundamental Analysis
● Softer US PPI data and declining Treasury yields have renewed interest in non-yielding assets like gold.
● Rising central bank gold purchases in July strengthen medium-term demand prospects.
✨ Summary
Buy above 3,366; target 3,435. Setup remains valid while holding above 3,309.
-------------------
Share your opinion in the comments and support the idea with a like. Thanks for your support!

xauusd (GOLD): a signal Hi guys!
Key Technical Points:
Ascending Channel:
Price action has been moving within a well-defined ascending channel.
Currently, the price has pulled back and is approaching the lower boundary of this channel.
This lower boundary often acts as a support area where buyers might step in.
Support Zone (Red Box):
The red highlighted area, around $ 3,340-$ 3,350 USD, is a key support zone.
This zone aligns w ith the lower boundary of the channel , adding more weight to the support.
Price is currently testing this area, which could act as a springboard for the next upward move.
Resistance Zone (Blue Box):
The upper resistance zone between roughly 3,425 and 3,440 USD is a major target for bulls.
This is a previous high area where sellers might re-enter the market.
-------------------------------------------------------
Trade Idea:
Long Position:
Entry could be considered near the lower boundary of the channel and the red support zone (around 3,340-3,350 USD).
Stop loss placement: Just below the red support zone to limit downside risk.
Target: The upper resistance zone at around 3,425-3,440 USD.

GOLD ROUTE MAP UPDATEHey Everyone,
Another PIPTASTIC day on the charts!!!
After completing our Bullish target 3370 yesterday, we stated that we are now waiting for ema5 lock to confirm gap to 3392.
We got the ema5 lock above 3370 opening 3392. A nice drop into the lower zone just above our bearish gap allowed us to buy dips inline with our plans. We got the push up all the way into 3390 just short of 3392 gap, so this remains open.
We will keep the above in mind when taking buys from dips. Our updated levels and weighted levels will allow us to track the movement down and then catch bounces up.
We will continue to buy dips using our support levels taking 20 to 40 pips. As stated before each of our level structures give 20 to 40 pip bounces, which is enough for a nice entry and exit. If you back test the levels we shared every week for the past 24 months, you can see how effectively they were used to trade with or against short/mid term swings and trends.
The swing range give bigger bounces then our weighted levels that's the difference between weighted levels and swing ranges.
BULLISH TARGET
3370 - DONE
EMA5 CROSS AND LOCK ABOVE 3370 WILL OPEN THE FOLLOWING BULLISH TARGETS
3392
EMA5 CROSS AND LOCK ABOVE 3392 WILL OPEN THE FOLLOWING BULLISH TARGET
3416
EMA5 CROSS AND LOCK ABOVE 3416 WILL OPEN THE FOLLOWING BULLISH TARGET
3429
EMA5 CROSS AND LOCK ABOVE 3429 WILL OPEN THE FOLLOWING BULLISH TARGET
3439
BEARISH TARGETS
3348
EMA5 CROSS AND LOCK BELOW 3348 WILL OPEN THE FOLLOWING BEARISH TARGET
3328
EMA5 CROSS AND LOCK BELOW 3328 WILL OPEN THE FOLLOWING BEARISH TARGET
3313
EMA5 CROSS AND LOCK BELOW 3313 WILL OPEN THE SWING RANGE
3296
3281
As always, we will keep you all updated with regular updates throughout the week and how we manage the active ideas and setups. Thank you all for your likes, comments and follows, we really appreciate it!
Mr Gold
GoldViewFX

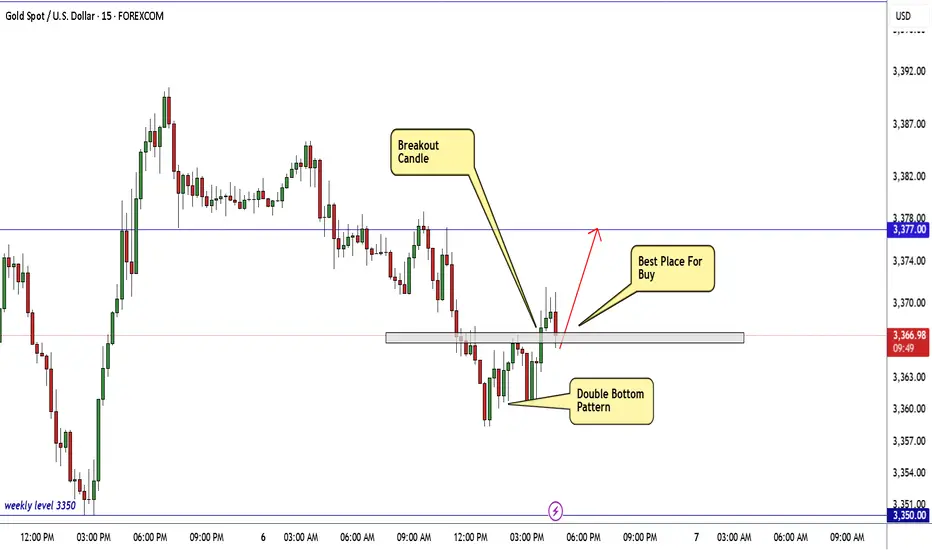
GOLD Ready To Go Up From Current Price , 150 Pips WaitingHere is My 15 Mins Gold Chart , and here is my opinion , we finally above 3365.00 and we have a 30 Mins Candle closure above it And Perfect Breakout , so we have a good confirmation now to can buy it and we can targeting 100 to 150 pips .
Reasons To Enter :
1- New Support Created .
2- Bullish Price Action .
3- Bigger T.F Giving Good Bullish P.A .
4- Clean Breakout .
5- Reversal Pattern .
GOLD Struggles Near 3400 ResistanceGOLD Struggles Near 3400 Resistance
Gold is facing strong resistance around 3400, and the price is hesitating to take clear direction.
Although it looks like gold wants to move higher, selling pressure is holding it back. The price action is forming a wedge pattern, which typically signals a potential drop.
If this pattern plays out, gold could fall.
In my view, this bearish setup will only be invalidated by major market manipulation, because from a broader perspective, there’s no fresh technical or fundamental reason for gold to push higher despite that the bigger trend is bullish.
The real risk isn’t just technical or macro—it’s that gold remains one of the most manipulated assets in the market.
If the price breaks below the resistance zone shown on the chart, the chances of a deeper drop will increase.
Targets: 3350, 3330, and 3294
I'm still more focused on a bearish movement.
You may find more details in the chart!
Thank you and Good Luck!
PS: Please support with a like or comment if you find this analysis useful for your trading day

GOLD (XAUUSD): Support & Resistance Analysis For Next Week
Here is my latest support & resistance analysis for Gold
Support 1: 3380 - 3390 area
Support 2: 3327 - 3358 area
Support 3: 3246 - 3275 area
Resistance 1: 3431 - 3450 area
With a high probability, the market will continue rising to Resistance 1.
❤️Please, support my work with like, thank you!❤️
I am part of Trade Nation's Influencer program and receive a monthly fee for using their TradingView charts in my analysis.

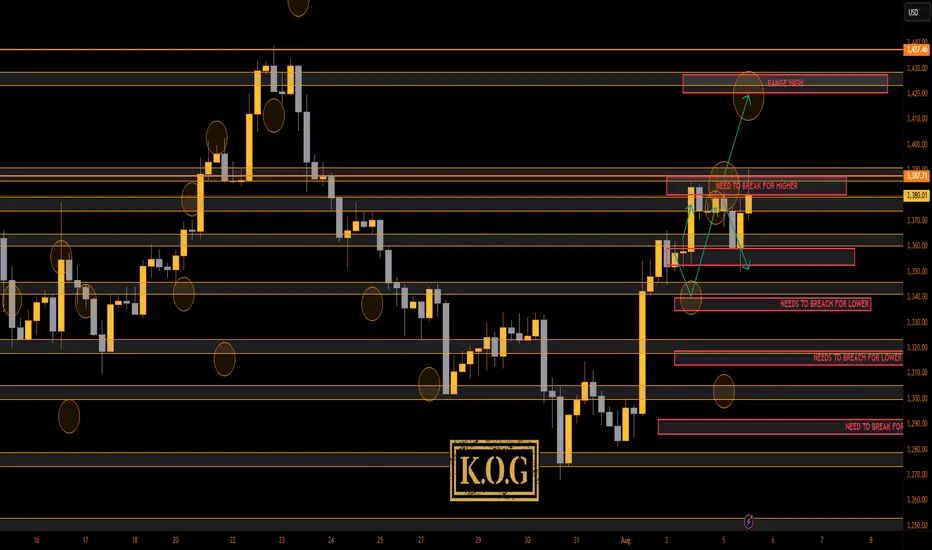
THE KOG REPORT - UpdateEnd of day update from us here at KOG:
As anticipated in the morning review, low volume day which resulted in this range still in play and price just making the sideways up and down move.
That's where we stand at the moment with no break above the red box for higher pricing at the moment. We managed to bag 3 decent set ups of 50pips each but we didn't get the move we wanted.
We have highlighted the key areas now and if you look closely on the hourly, we're in slight triangle formation. The range has also been drawn on the chart so we'll wait for the break out now.
Support here 3365, while resistance stands at the 3385 level.
Not much more to report on gold unless we break above that red box.
As always, trade safe.
KOG

XAUUSDHello Traders! 👋
What are your thoughts on GOLD?
Gold saw a strong rally on Friday following the U.S. Non-Farm Payrolls (NFP) report and is now trading near a key resistance zone.
At this resistance, a short-term pullback is likely as traders lock in profits.
We expect the correction to be contained within key support levels, and if price holds in that zone, the uptrend is likely to resume, targeting new highs.
Will gold resume its rally after the correction? Share your view below! 👇
Don’t forget to like and share your thoughts in the comments! ❤️

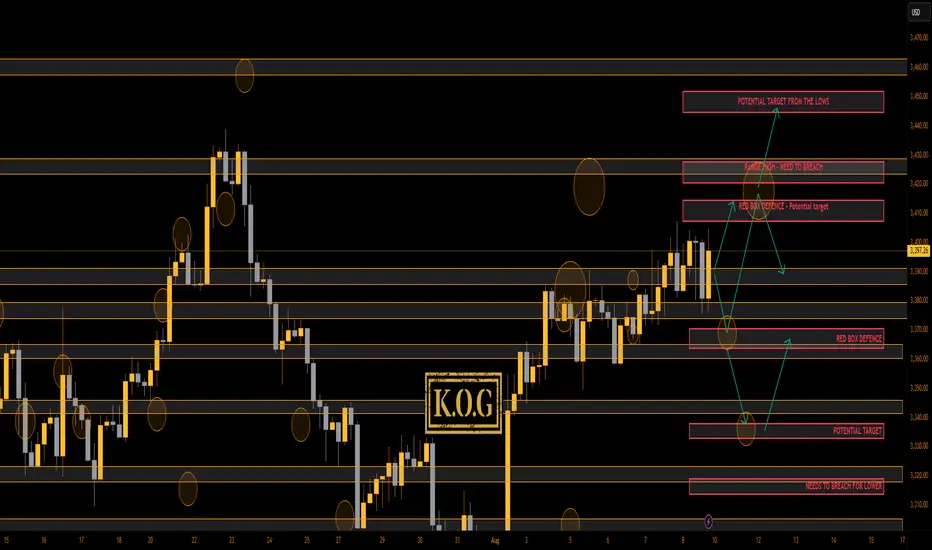
THE KOG REPORT THE KOG REPORT:
In last week’s KOG Report we shared the NFP chart and the KOG Report chart for the wider community. We said we would be looking for price to support below at the red box and then push upside into the higher levels and the red box targets. We also suggested the shorting region and the target level for that trade which as you can see worked well playing level to level, point to point. We also completed all of our target levels without the breach and even though it was choppy, we completed numerous Excalibur targets in Camelot.
A decent week not only on Gold but also the other pairs we trade an analyse.
So, what can we expect in the week ahead?
I have indications of higher pricing, however, how low can the take it before they then attempt higher? For that reason, let’s stick with the 4H as this the most effective for our strategy and analysis and lets look at the key levels!
We have the level above 3408-11 which is a reasonable target for this move, but there is red box defence there which will need to be attempted and broken to go higher. If we resist at that level with extension level 3430-5, there is a chance we can correct the move all the way back down into the 3350-40 levels before we again get an opportunity to capture that long trade!
We have no news tomorrow so again, more of a chop and ranging price action is on the cards, with the support level being 3375-70 for the Asian session and resistance being the 3408-11 level. My Red box indi’s are stretched, my daily liquidity indicator is stretched, so I would say please play caution on the markets as they are extremely fragile at the moment.
KOG’s Bias for the week:
Bullish above 3365 with targets above 3408, 3410, 3415 and above that 3420
Bearish below 3365 with targets below 3359, 3355, 3350 and below that 3345
RED BOX TARGETS: (You can see how effective these are so please make use of these together with the analysis and bias we share. It all goes together, without PRICE ACTION knowledge you only have hope)
Break above 3406 for 3407, 3410, 3420, 3429, 3430 and 3435 in extension of the move
Break below 3395 for 3393, 3385, 3380 and 3370 in extension of the move
Please do support us by hitting the like button, leaving a comment, and giving us a follow. We’ve been doing this for a long time now providing traders with in-depth free analysis on Gold, so your likes and comments are very much appreciated.
As always, trade safe.
KOG
GOLD NEXT MOVE (expecting a bearish move)(08-08-2025)Go through the analysis carefully and do trade accordingly.
Anup 'BIAS for the day (08-08-2025)
Current price- 3390
"if Price stays below 3400, then next target is 3380, 3355 and 3340 and above that 3420 and 3455 ".
-POSSIBILITY-1
Wait (as geopolitical situation are worsening )
-POSSIBILITY-2
Wait (as geopolitical situation are worsening)
Best of luck
Never risk more than 1% of principal to follow any position.
Support us by liking and sharing the post.

GOLD NEXT MOVE (expecting a bearish move)(06-08-2025)Go through the analysis carefully and do trade accordingly.
Anup 'BIAS for the day (06-08-2025)
Current price- 3370
"if Price stays below 3380, then next target is 3360, 3345 and 3330 and above that 3400 and 3440 ".
-POSSIBILITY-1
Wait (as geopolitical situation are worsening )
-POSSIBILITY-2
Wait (as geopolitical situation are worsening)
Best of luck
Never risk more than 1% of principal to follow any position.
Support us by liking and sharing the post.

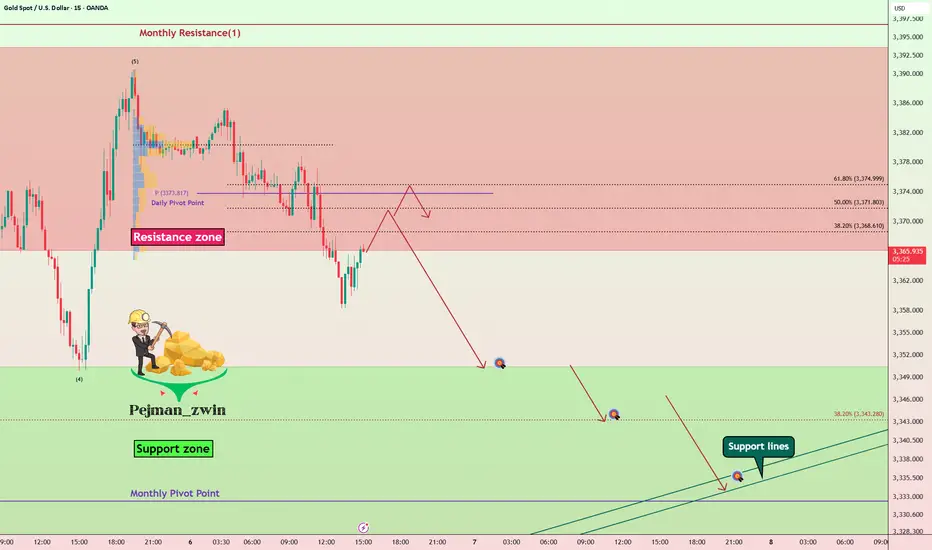
Gold Roadmap — Short termGold ( OANDA:XAUUSD ) rose to $3,383 as I expected in yesterday's idea .
Gold is currently moving in the Resistance zone($3,393-$3,366) .
In terms of Elliott Wave theory , it seems that Gold has completed 5 impulse waves , and we should wait for corrective waves on the 15-minute time frame .
I expect Gold to start declining from one of the Fibonacci levels and fall to at least $3,351 .
Second Target: $3,344
Third Target: Monthly Pivot Point/Support lines
Note: Stop Loss (SL) = $3,392
Gold Analyze (XAUUSD), 15-minute time frame.
Be sure to follow the updated ideas.
Do not forget to put a Stop loss for your positions (For every position you want to open).
Please follow your strategy; this is just my idea, and I will gladly see your ideas in this post.
Please do not forget the ✅ ' like ' ✅ button 🙏😊 & Share it with your friends; thanks, and Trade safe.
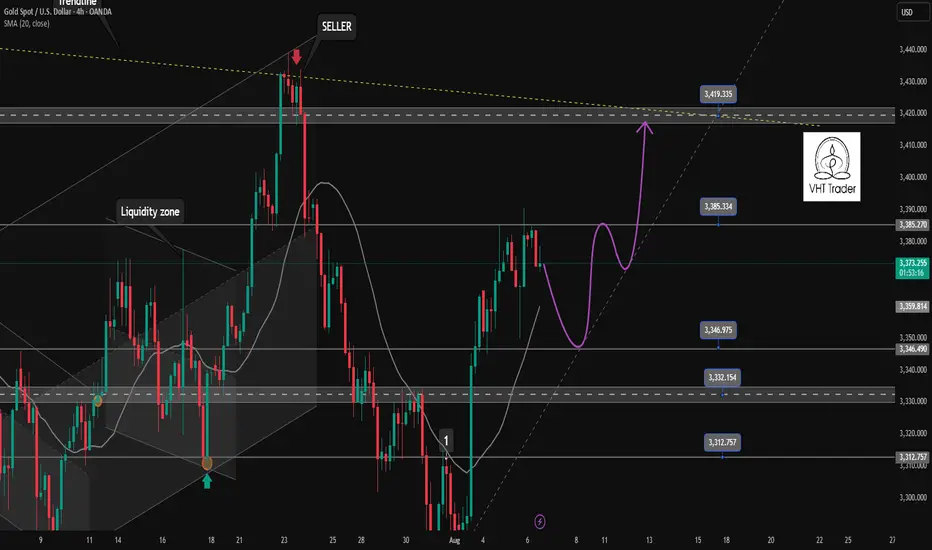
Correction in Tokyo, London session. And return go up in NewYork✏️Gold prices saw some selling pressure in the Tokyo session. Yesterday's US session saw strong buying pressure, leading to a psychological profit-taking session early today. The possibility of a correction in the Asian and European sessions today and the buying pressure will return in the London session. The SELL signal is triggered at the moment and the Target is aimed at the reaction of buyers at the support areas for the BUY strategy.
📉 Key Levels
SELL now 3375 (Scalping)
BUY trigger: Price rejection at the support areas 3346-3333-3315
Target 3420
Leave your comments on the idea. I am happy to read your views.
Range, Gaps, and Whipsaws: Gold Awaits Its Next Big MoveThe final days of last week have been frustrating for Gold traders, to say the least.
Starting Thursday, when the price tested the waters around 3400, we entered a range — but not a calm one. The moves inside this range were sharp and violent: a quick rally to 3400 followed by an equally quick drop to the 3380 zone, and so on.
Even the final hours of Friday mirrored this behaviour, with Gold dipping to 3380 only to recover and close the week near 3400.
The Asian open a few hours ago brought another twist — a gap above 3400 that was quickly filled, followed by continued downside in what could be described as a classic “gap and crap” scenario.
From a chart perspective, the bigger picture is still unclear. We do, however, have two critical levels to watch:
• 3365 → important support
• 3400 → key psychological resistance and technical level
Until we get a clear and decisive break above or below one of these zones, direction remains uncertain.
Personal plan:
• I would avoid trading an immediate breakdown below support today — in such a case, I’d prefer to wait for the daily close before committing.
• On the other hand, if price pushes back towards 3400, I suspect we might finally see a breakout, so I’ll be preparing for long positions in that scenario.
For now, a wait-and-see approach seems most prudent.
Disclosure: I am part of TradeNation's Influencer program and receive a monthly fee for using their TradingView charts in my analyses and educational articles.

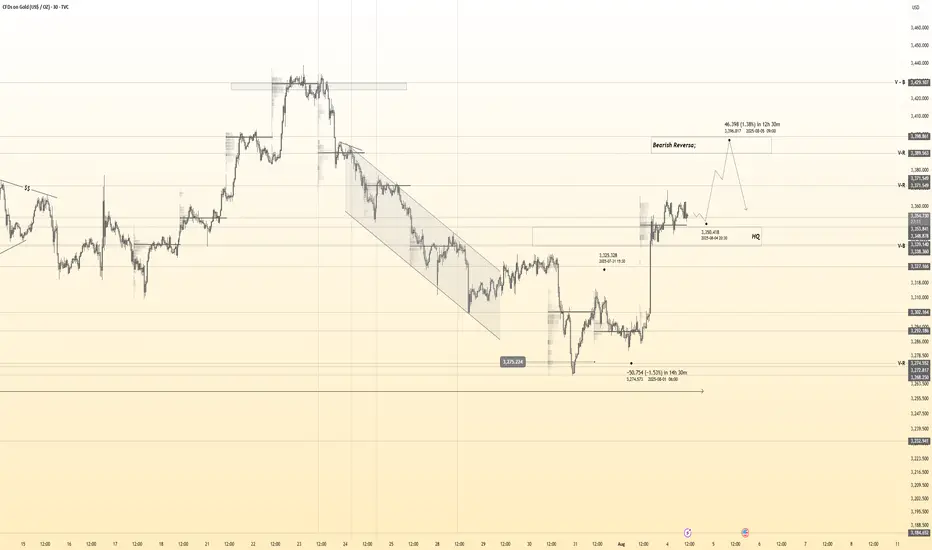
Gold 30Min Engaged ( Bullish & Bearish Entry Detected )Time Frame: 30-Minute Warfare
Entry Protocol: Only after volume-verified breakout
🩸Bullish From now Price - 3354
🩸Bearish Reversal : 3400
➗ Hanzo Protocol: Volume-Tiered Entry Authority
➕ Zone Activated: Dynamic market pressure detected.
The level isn’t just price — it’s a memory of where they moved size.
Volume is rising beneath the surface — not noise, but preparation.
🔥 Tactical Note:
We wait for the energy signature — when volume betrays intention.
The trap gets set. The weak follow. We execute.
The Illusion of ControlThere comes a point in every trader’s journey when you do everything right, and it still goes wrong.
You plan the trade meticulously, plot the levels, define your risk, wait patiently for the setup, and enter with the kind of discipline that would make any textbook proud. You follow your rules. You trust your process. And yet, the market does what it does!
It breaks through your stop as if your risk management was never there. Sometimes it gaps hard against you, leaving no room to act. Sometimes it simply meanders sideways, wearing down your conviction until, exhausted and uncertain, you exit - only to watch the market finally rally the moment you’re out.
This experience is frustrating and discouraging. Yet, for those with enough experience, it's a familiar scenario.
It's not just about losing money, though that definitely stings. This kind of hit really messes with your confidence, throws off your game, and makes you feel disconnected from your work. Before you know it, those sneaky little doubts creep in: Did I miss something? Could I have stopped this? Am I just not good enough at this yet?
So you go back to the charts, really digging into every detail. You watch replays, try out new filters, and pile on more indicators, scrutinizing the trade from every possible angle. You tell yourself this super careful process makes you better, a crucial part of being a professional. But if you're real with yourself, it's more than just getting better. Underneath all this striving for improvement is often a deeper reason: you really want to be in control.
We often discuss risk management, patience, and emotional discipline, yet we seldom acknowledge our deep-seated desire to control the market. We invest countless hours in learning, testing, and refining, expecting our efforts to yield tangible results. When the market doesn't respond as we anticipate, it's disheartening. This is because, at our core, we not only aspire to be skilled traders but also crave the belief that we are truly in command.
The market just does its thing, plain and simple. It doesn't care how much work you put in or how carefully you prepare. It's not about rewarding effort; it just moves. Trying to find a reason for every little change is pointless, like trying to argue with the ocean. You can't outsmart randomness; you can only learn to coexist with it.
The best traders do prepare with care. They’re thoughtful, meticulous, and dedicated. But many cross a subtle line, often unknowingly - the line where preparation morphs into obsession, where working harder becomes an emotional shield, and where we start to believe that if we can just control every input, we can guarantee the output.
This is where it all becomes dangerous. Not financially, necessarily, but psychologically. When your self-worth becomes intertwined with your performance, every loss starts to feel personal. Every drawdown feels like an indictment. You tell yourself you’re striving for excellence, but what you’re really chasing is certainty; and in a domain governed by uncertainty, that’s a recipe for chronic frustration.
The truth is, trading isn't about being right all the time, or even most of the time. The real skill is staying cool when you mess up and not freaking out when things go sideways. You don't have to be perfect; you just need to handle the unknown without needing to control it. You won't pick up this tough lesson from courses, forums, or even tons of practice, unless you're truly reflecting on what you're doing. You learn it by watching winning trades go bad, by handling losses without freaking out, and by being able to stay cool when things get uncomfortable.
You know that annoying feeling we sometimes get? It's usually just fear, popping up as worries about messing things up, looking foolish, or not being quite good enough. When you're trading, these fears can seriously mess with your mind. You might jump into trades too quickly, fiddle with your stop-loss, settle for smaller gains, or just abandon your whole strategy when things get tough. We might try to convince ourselves we're being clever, but typically, we're just trying to escape feeling uncomfortable.
Trying too hard to control the market often hurts your edge. Trading systems usually don't fail because of math errors; they fail because traders don't have the patience to stick with them through tough times and let them do their job.
Every trader eventually faces a fundamental, liberating truth: you are not in control. Once you accept this, you can stop trying to control the uncontrollable and instead concentrate on what you can manage: your risk, routine, discipline, and behavior.
Detaching from the outcome isn't about indifference or a lack of concern; it's about embracing trust. Trust in your preparation. Trust in your edge. Trust in the law of large numbers — that over time, if you execute consistently, the results will follow. Not perfectly, not smoothly, but faithfully.
You build trust over time, often without even realizing it. It's about sticking to your plan even when things aren't going your way, taking losses in stride, and not messing with something that's working, just because it hasn't paid off yet.
Over time, your trading approach transforms. You no longer dwell on every loss or micromanage winning trades. The urge to constantly adjust your system after a bad week/month subsides. Your perspective broadens; you begin to think in terms of years, not just days. This shift cultivates a deeper, process-driven confidence, untethered from mere numbers. You stop striving for absolute control, and in doing so, discover a sense of peace.
True mastery isn't about dominating the market, but rather relinquishing the illusion that you ever could.
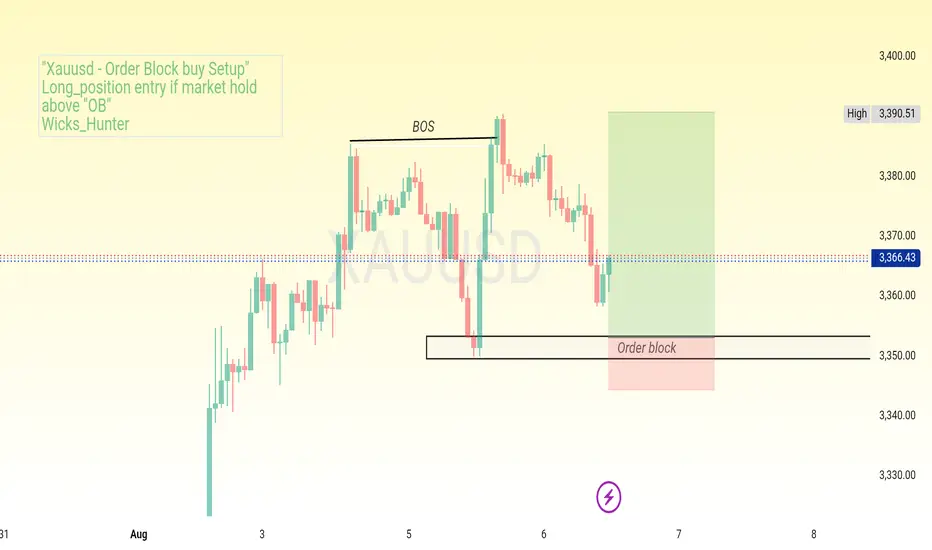
Order Block buy setup
XAUUSD H1 — Order Block Buy Setup 📈"
BOS confirmed .Price retracing to order block (3350–3353).
Looking for bullish reaction to target 3390–3400.
Risk small, aim big.
#XAUUSD #GoldAnalysis #OrderBlock #BOS #PriceAction #SmartMoney #TradingSetup #Forex #Gold #SwingTrade #TechnicalAnalysis #RiskReward #TradingPlane
THE KOG REPORT - UpdateEnd of day update from us here at KOG:
What a mission with gold, swings one way, swing the other, taking liquidity within the range and yet sticking with the illustration posted. We managed to get the move upside, pin point short into the level we wanted and then a bounce from the 3350 level again! We had a target lower, but suggested we wait for the 3370-5 level which we weren't happy with and ultimately broke, only then to give us the long into the LiTE and Excalibur targets and to complete most of the red box targets.
We now have support here at the 3375 level with extension in 3368 which are the levels that need to hold us up, then break the red box and we can attempt the higher levels.
KOG’s bias for the week:
Bullish above 3340 with targets above 3370✅, 3373✅, 3379✅ and above that 3384✅
Bearish on break of 3340 with targets below 3330, 3320 and below that 3310
RED BOXES:
Break above 3365 for 3372✅, 3375✅, 3379✅, 3384✅ and 3390✅ in extension of the move
Break below 3350 for 3346, 3340, 3335 and 3330 in extension of the move
As always, trade safe.
KOG
Gold (xauusd): still bullishHello guys!
Price is moving inside an ascending channel.
Recently bounced from mid-channel support (“last kiss”) and heading toward channel resistance.
Potential upside target: $3,435 zone.
As long as the price stays above mid-line support, bullish momentum remains intact.

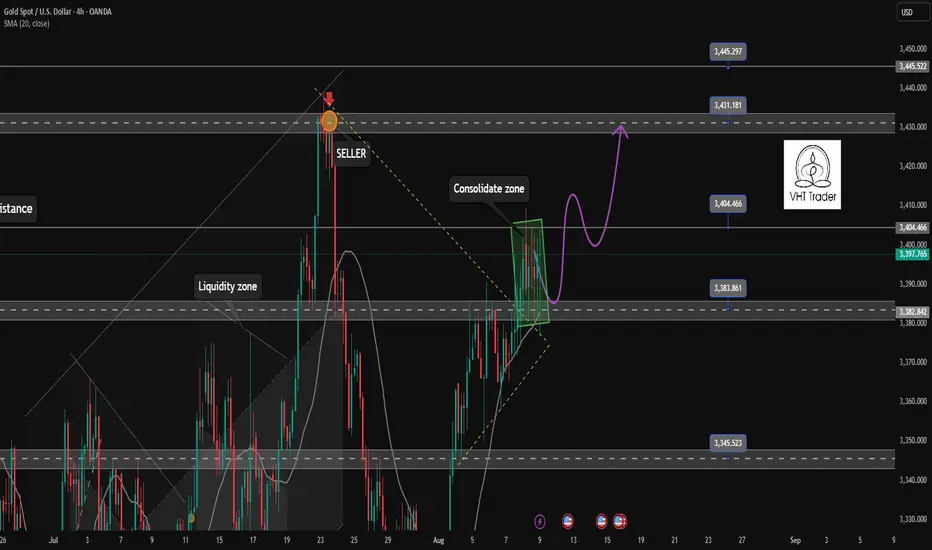
Waiting for new confirmation after 6th day of accumulation✏️Last weekend with a trading day in the accumulation range. Early this week waiting for new momentum to break the accumulation range from 3385 and 3405 to trade on the winning side. When breaking the lower range, a corrective wave will be formed and then create increasing waves to ATH. If breaking the upper range of the accumulation model, buying force can completely push the gold price to approach ATH around 3445 soon.
📉 Key Levels
Support: 3383-3345
Resistance: 3404-3431-3445
BUY Trigger: Price rejection of the candle around support 3383
BUY Trigger: Break resistance 3405
Target 3445
SELL trigger Break and trading bellow 3383
Target 3345
Leave your comments on the idea. I am happy to read your views.
Gold 30Min Engaged ( Bearish & Bullish Entry Detected )Time Frame: 30-Minute Warfare
Entry Protocol: Only after volume-verified breakout
🩸Bearish From now Price - 3373
🩸Bullish Reversal : 3341
➗ Hanzo Protocol: Volume-Tiered Entry Authority
➕ Zone Activated: Dynamic market pressure detected.
The level isn’t just price — it’s a memory of where they moved size.
Volume is rising beneath the surface — not noise, but preparation.
🔥 Tactical Note:
We wait for the energy signature — when volume betrays intention.
The trap gets set. The weak follow. We execute.