"Gold at Crucial $3,407 Resistance — Breakout or Reversal Ahead?Technical Analysis (H4 Chart)
Trend Structure
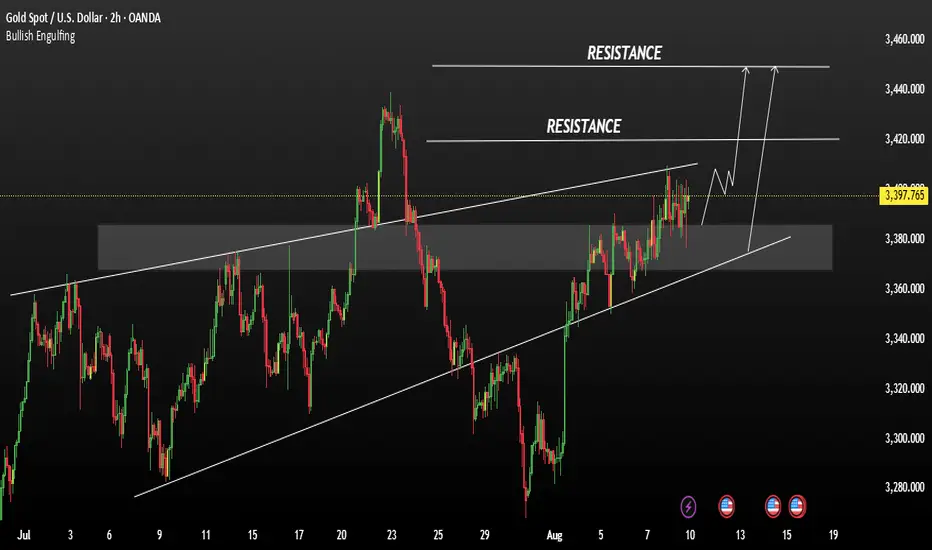
Price is moving inside an ascending channel (black lines).
Currently testing the mid-upper zone of the channel, near $3,400–$3,407 resistance.
Key Levels
Support: $3,380 / $3,340 / $3,300
Resistance: $3,407 / $3,486 / $3,544
Major psychological support at $3,244.
Patterns
Blue arrows mark previous strong rejections from the same resistance zone, suggesting sellers are active there.
Two scenarios drawn:
Bullish breakout → Break above $3,407, retest, then target $3,486–$3,544.
Bearish rejection → Fail at $3,407, break below $3,380 → target $3,300–$3,280 zone.
Trading Bias
Inside the channel → buyers have slight control.
Break below channel → momentum shifts bearish.
Fundamental Analysis
Bullish Factors for Gold:
US Economic Slowdown: Any weak US data (CPI, job numbers) increases the chance of Fed rate cuts → boosts gold.
Geopolitical Risks: Ongoing global tensions keep safe-haven demand strong.
Central Bank Buying: Several emerging market central banks are increasing gold reserves.
Bearish Factors for Gold:
Strong US Dollar: If upcoming US data is strong, USD gains → gold drops.
Rising US Yields: Higher bond yields reduce gold’s appeal.
Risk-On Sentiment: Stock market rallies can pull funds out of gold.
Outlook
Above $3,407 with strong volume → likely bullish toward $3,486 and possibly $3,544.
Failure at $3,407 and break below $3,380 → short-term bearish toward $3,300.
Fundamental triggers will likely be US CPI data and Fed rate outlook in the coming week.
XAUUSD trade ideas

gold closed bullishgold is still strong in bullish
hence safest trade is still to look for buys until it shows a clear sign of sell.

Next Stop 3420? Gold Bulls Push the Limit!Gold has shown a step-by-step rise in the short term, and has stood above 3,400 many times, and the bullish force is relatively strong. However, correspondingly, after gold stood above 3400, it fell under pressure several times, so the shape was not particularly good, which increased the risk of pullback in the short term.
However, we do not need to worry. Gold is still running in an ascending wedge structure. Although it has been under pressure and fallen back several times during the attack on 3400, the bullish structure has not been effectively destroyed so far. Moreover, with the sharp increase in gold buying, the 3380-3370 area below has become an obvious intensive trading area, which has greatly limited the gold retracement space.
In addition, after gold broke through 3340, market sentiment tended to be optimistic. If gold experiences a short-term pullback, more funds will flow into the gold market, especially for those who have missed out on long trades before, who will rush into the gold market even more frantically. Under the resonance of the current technical structure and market optimism, gold still has the potential to hit 3400, and bulls are even expected to stand firm at 3400 and make further efforts.
So in terms of short-term trading, I still advocate that gold pullbacks are buying opportunities. And I cherish the opportunity to enter the market and go long in the 3385-3375 area, and am optimistic that gold will hit 3400 again, and may even continue the bull trend to the 3420-3430 area.
OANDA:XAUUSD FOREXCOM:XAUUSD TVC:GOLD FX:XAUUSD CAPITALCOM:GOLD

XAUUSD – Bearish Rejection at Supply Zone, Eyes on 3345On the 1H chart, XAUUSD is currently testing a strong supply zone around 3,395 – 3,400, coinciding with a visible range high-volume node. Price has shown multiple rejections from this area, suggesting that sellers are stepping in.
Key Observations:
Supply Zone: 3,395 – 3,400 (red zone) – price failing to break and sustain above.
Demand Zone: 3,311 – 3,318 (green zone) – previous accumulation area.
Mid Support: 3,345 – potential first target for short positions.
Market Structure: Multiple lower highs forming near supply; possible double top pattern forming.
Volume Profile: High selling pressure in the current region.
Plan:
Expecting a potential rejection from the supply zone with a move down towards 3,345, and if broken, further downside to the 3,311 demand zone. Stops should be placed above the recent swing high at ~3,400 to protect against false breakouts.
Bearish Confirmation:
Clear rejection candle from supply
Break of minor intraday support at 3,370
Increasing selling volume
Disclaimer:
This is for educational purposes only, not financial advice. Always do your own analysis before entering trades.

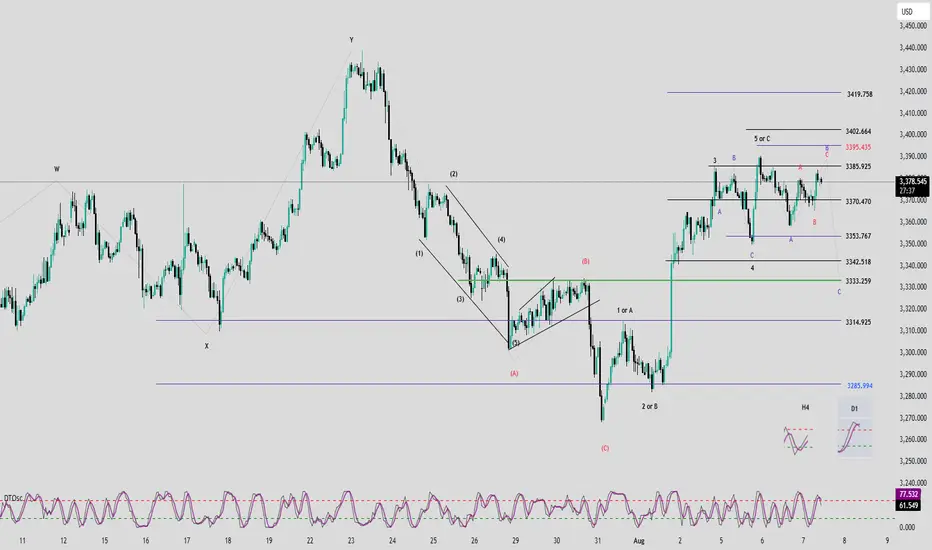
Elliott Wave Analysis – XAUUSD | August 7, 2025📊
________________________________________
🔍 Momentum Analysis:
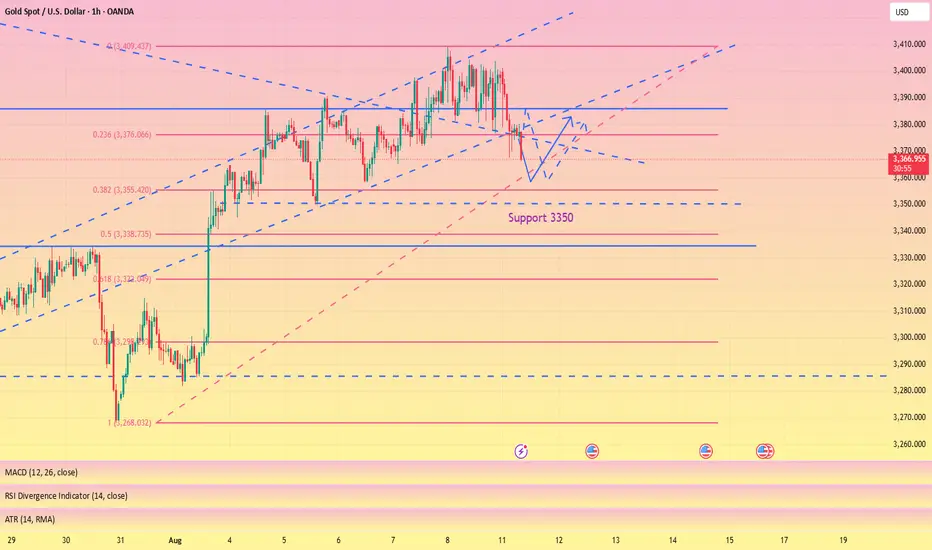
• D1 Timeframe: Daily momentum is turning bearish, signaling that a medium-term downtrend may have already started and could last until mid-next week.
• H4 Timeframe: Momentum is rising, but the slope of the two momentum lines is relatively flat → indicating weak bullish strength. We should closely watch the overhead resistance zones.
• H1 Timeframe: Momentum has entered the overbought zone → a short-term reversal is likely, especially near the 3386 level.
________________________________________
🌀 Elliott Wave Structure:
• Based on the bearish momentum shift on the D1 chart, we expect the market is entering an ABC corrective pattern (in green).
• Currently:
o Wave A is completed.
o Wave B is in progress.
• Since Wave A appears to be a 3-wave structure, Wave B may unfold as a flat correction. In that case, potential target zones for Wave B are:
o 3385
o or 3395 → these are the key resistance levels to monitor.
• Within Wave B (green), we observe an internal 3-wave ABC structure (in red), where:
o Wave C (red) may reach:
3386
or extend toward 3395
→ In alignment with the D1 momentum signal, 3386 is considered a potential entry point for a short position.
________________________________________
📈 Trade Plan:
• SELL Zone: 3386 – 3389
• Stop Loss: 3397
• Take Profits:
o TP1: 3370
o TP2: 3353
o TP3: 3333
Institutional Gold Strategy Note – August 7, 2025🔍 Executive Summary
Gold (XAU/USD) continues to hold firm above the $3,370 handle, supported by a bullish macro narrative and confirmed technical structure on the 4-hour chart. Amid dovish expectations from the Fed and soft labor market data out of the U.S., bullion maintains its premium as a hedge, attracting institutional flow in line with the rate-cut narrative for Q3–Q4.
Today’s market profile suggests a high-probability long setup, anchored in a fresh demand structure just below current price, supported by unmitigated institutional order flow, premium discount levels, and clear liquidity sweeps.
🎯 Directional Bias: Bullish–Transitional
While price is consolidating around $3,378, the underlying structure favors a bullish continuation. A Change of Character (CHoCH) has been confirmed on the 4H chart, suggesting a shift from corrective to impulsive intent. Liquidity remains stacked below recent equal lows, and the premium-to-discount array strongly favors buy-side execution.
🟩 Primary Buy Zone (GOLDEN ZONE)
Entry: $3,350–$3,355 | Stop-Loss: < $3,340 | Targets: $3,400 / $3,430
This zone represents the highest institutional quality setup of the day. It aligns with:
A fresh unmitigated Rally-Base-Rally Demand Zone
A refined Bullish Order Block within optimal trade entry (OTE) discount range
A Fair Value Gap (FVG) aligned with internal BOS leg
Equal Lows (EQL) sweep below $3,355, targeting liquidity
Overlap with volume imbalance, suggesting a clean institutional leg
Clear CHoCH confirming bullish structure
Kill Zone Alignment: Asia–London overlap, pre-London accumulation
This zone is statistically favored for execution by both Smart Money and legacy institutions, given its confluence density and asymmetrical risk profile.
🟥 Primary Sell Zone
Entry: $3,385–$3,390 | Stop-Loss: > $3,400 | Targets: $3,350 / $3,320
A valid counter-trend liquidity sweep opportunity, located above short-term equal highs near the psychological $3,400 level. Key confluences include:
Drop-Base-Drop Supply Zone
Overlapping FVG + OB in premium zone
Alignment with OTE premium retracement
Liquidity cluster near recent EQH
Structural resistance + round-number magnetism
Execution window during London–NY overlap
This zone is valid only for short-duration scalps or short-term reversal positioning.
🟢 Fallback Buy Zone (If Primary is invalidated)
Entry: $3,320–$3,325 | SL: < $3,310 | TPs: $3,400 / $3,430
A deeper mitigation zone with reduced confluence but adequate historical support. This zone captures:
A mitigated OB inside Demand
0.618 Fib retracement from internal BOS
Liquidity sweep potential of a broader EQL stack
Minor structure support
Use only if the market sweeps the primary zone and rebalances deeper.
🔻 Fallback Sell Zone (If Primary Sell fails)
Entry: $3,410–$3,415 | SL: > $3,420 | TP: $3,350
Set well above prior resistance, this extended zone aligns with:
Extended Supply + Unmitigated OB
FVG inside premium OTE zone
Recent accumulation liquidity trap (potential fakeout zone)
Session mispricing during NY–Asia rollover
Use only if price impulsively breaches the $3,400 psychological barrier and stalls near the top of an exhaustion leg.
🌐 Institutional Cross-Validation
Citi Group has upgraded its 3-month Gold forecast to $3,500, citing weakening U.S. macro data and elevated inflation expectations as bullish catalysts.
Reuters and FXStreet confirm Gold's hold near 1-week highs with sentiment strongly skewed toward continued demand amid Fed rate-cut odds exceeding 90%.
TradingView pro charts show confluence with OB/FVG zones at both $3,355 and $3,390, validating both primary zones technically.
📌 Final Notes
Action Bias:
Aggressively long from $3,350–$3,355 with tight structure-defined invalidation.
Hold shorts only from $3,385–$3,390 under strict reversal logic.
Risk Reminder:
All zones are built from 4H structural flow only. Intraday volatility outside kill zones may distort price behavior — wait for displacements and internal breaks before entering. Manage partials at 1.272 extension and hold runners toward 1.618 only if structure confirms.
XAUUSD & US500 Technical + Fed CommentaryToday’s FOMC event delivered no clear forward guidance on rate cuts — and markets aren’t buying the dovish narrative yet.
🔹 Fed's Mary Daly earlier emphasized patience, saying “we can’t wait forever”, but also acknowledged softening in the labor market. No urgency to cut now.
🔹 The Fed is split — but traders hoping for a preemptive cut may be too early.
🔗 Correlation View:
📍 Gold (XAUUSD)
Still respecting the rising channel and reacting off resistance near Monday high and local supply.
If FOMC remains neutral and yields don’t fall, we may see a fade down toward support levels around 3,349 or even 3,333 in the coming sessions.
📌 Watch for rejections below 3,380 — could signal lower move ahead.
📍 US500 (S&P Futures)
Fibonacci confluence at 6,346 lining up with structural resistance.
Bulls need a strong breakout above that to flip sentiment.
Otherwise, we're just retracing last week’s downside leg.
🎯 If equities reject and drop → could pressure gold lower too (risk-off + strong dollar).
🧠 Key Takeaway
The FOMC is not confirming any cuts just yet.
Don’t trade the pivot dream until price confirms it.
Let structure guide you.

XAU / USD 2 Hour ChartHello traders. Taking a look at the spot gold 2 hour chart, we are coming up to an area of interest for me, which is marked on the chart. For now I am just watching the 2 hour, the 4 hour and the 30 minutes candles. We have the unemployment claims tomorrow here in the US, so today I am mostly observing, although I can see the potential quick scalp trade set ups for either direction. Let's see how things play out over the next hour or so. Big G gets my thanks. Be well and trade the trend. Just an FYI, I don't do a lot of technical analysis charts, using the Fib, or wave theory, etc. I day trade, so for me, the charts I put up are based on price action, what is happening at the time of the chart being posted. Things can change in a minute in the market, so analysis put on Tradingview are valid for only so long. Thanks so much. Be well and trade the trend.

Gold Technical Analysis
---
## ✨ – Where Smart Capital Management Meets Predictive Precision
🔐 **Capital management is the cornerstone of survival and success in this market.** No matter how accurate the analysis or how powerful the pattern, risk control is what separates the seasoned trader from the reckless speculator.
This chart highlights key buy and sell zones, backed by high-probability harmonic patterns such as:
### 🦋 Gartley Pattern
- Identified at a clear reversal zone
- Suggests a corrective move before trend continuation
### 🦂 Deep Crab Pattern
- Highly precise in spotting tops and bottoms
- Enabled a strong move from Sell Zone 2, achieving **560 points**,
---
### 📊 Defined Trading Zones:
| Zone | Trade Type | Potential Outcome |
|-----------------|------------|------------------------|
| Sell Zone 1 | Short | Moderate correction |
| Sell Zone 2 | Strong Short | Sharp bearish move |
---
### 📈 Technical Indicators:
- EMA (50, 100, 200) show mixed momentum signals
- X, A, B, C, D points mark the completion of harmonic setups with precision
---
🎯 **Bottom Line**:
Gold is navigating through sensitive technical zones. Predictive harmonic patterns offer a forward-looking edge, but without disciplined capital management, they remain mere possibilities.
**Be strategic, not just bold.**
XAUUSD Bullish Continuation Setup? Gold (XAU/USD) – 1H Technical Outlook
Price action on the hourly chart is developing within a well-defined ascending channel, supported by dynamic trendlines that have consistently provided higher highs (HH) and higher lows (HL), confirming the underlying bullish structure.
The Key Support and Resistance Zone around 3,330–3,350 USD has proven to be a pivotal area, acting as both a consolidation base and a springboard for bullish impulses. The most recent Multi-Confluence Support and Pivot Area aligns with dynamic channel support, reinforcing its technical significance.
Volume Profile (Flow Profile) data remains overall bearish, indicating that a majority of trading activity has occurred at lower levels. However, the profile is beginning to exhibit early signs of accumulation, which often precedes directional reversals in market sentiment.
From a structural perspective, maintaining price action above the 3,328–3,350 USD support range would sustain the bullish bias, with upside potential toward Channel High Resistance near 3,400 USD, and an extended target into the Target Area around 3,420 USD.
Conversely, a decisive break below the Invalidation Zone (~3,310 USD) would undermine the bullish channel structure, increasing the probability of a deeper retracement.
Outlook:
Bias: Bullish continuation, contingent on support holding.
Key Support: 3,328–3,350 USD
Immediate Resistance: ~3,400 USD
Primary Target: ~3,420 USD
Invalidation Level: ~3,310 USD
This setup suggests that, while buyers retain structural control, confirmation from price action and volume behavior will be critical in validating the next bullish leg.

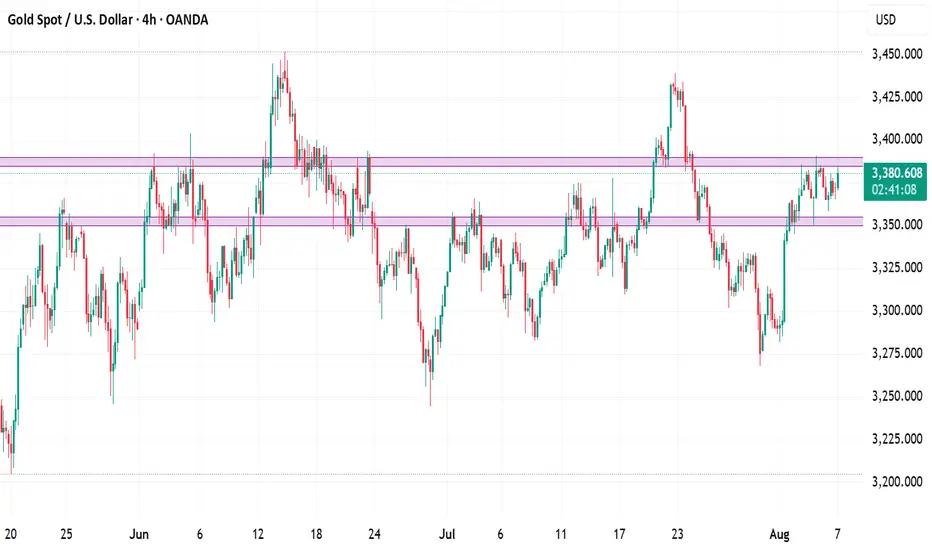
Gold XAUUSD Analysis 12.08.2025 IntradayGold is currently moving sideways within the range of 3341/44 to 3356/59. Price is consolidating between these levels, creating a clear short-term support and resistance zone. Unless price breaks out and retests on either side of this range, no trades should be taken. Watch CPI data and other confirmations before entering in the breakout direction.
Trading Signal
Buy Scenario: Break and retest above 3356/60, targeting 3375–3380 zone.
Sell Scenario: Break and retest below 3341/44, targeting 3315–3320 zone.

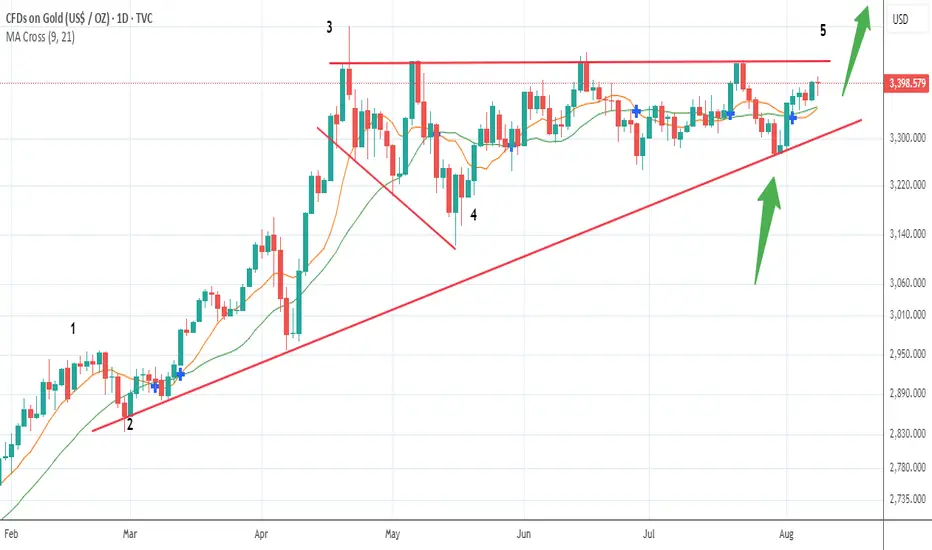
About To BlowGold held the gains the past week and is grinding higher into this long sideways ascending triangle.
Some got spooked last month with a mini selloff which only flushed out the weak hands.
This pattern has a high probability of breaking upwards out of the ascending buying pressure, when this break out, it will be a very strong move...shorts feeding the acceleration.
Just keep holding or buying as the moment is very close, a target of around $4000.
Appreciate a thumbs up..Good trading and God Bless you all!
GOLD bullish wedge pattern presents an ambiguous scenario Gold is currently struggling to break through the 3389 resistance level. From previous analysis, 3370 had already been identified as a strong resistance area, and its breakout has supported further upward movement.
Technical View:
The bullish wedge pattern presents an ambiguous scenario — while there’s clear upward momentum, this pattern can easily reverse. Price is trading in a local range with a high probability of retesting 3390. If buyers maintain control and break above 3390, the next potential targets are: 3420 and 3450
You may find more details in the chart.
Trade wisely best of luck Buddies.
Ps: Support with like and comments for better analysis Thanks for Understanding.
The daily trend has not changed, go long on pullback#XAUUSD
Good morning, and a wonderful day. Last night we expected that if the 3390-3380 level below is effective, then gold will still have room to rise. After the morning opening, gold began to fall and adjust, reaching a low of around 3367, and the overall trend fell into a wide range of fluctuations. From a technical perspective, the daily moving average tends to converge upward, with the middle track located near 3357. Before it effectively falls below, the daily bullish trend remains unchanged. Paying attention to the 4H technical indicators, we find that the MACD indicator death cross with large volume tends to fluctuate and fall. In the short term, we should focus on 3380-3390 above. At present, we should focus on the support at 3350. If it fails to break through effectively, gold will rebound again. On the whole, it is recommended to go long when the price retreats to around 3360-3350 during the day, with the target at 3375-3385.
🚀 BUY 3360-3350
🚀 TP 3375-3385
GOLD BUY OPPORTUNITY Gold (XAU/USD) saw some selling near $3,350 per ounce in Asian and London sessions Monday. The precious metal is driftin' lower with the US Dollar (USD) showin' a modest 💁♀️ recovery.
If Gold holds above 3,350 support and bounces 🔀, that'd be a bullish 🐂sign 💯 for more upside potential 🚀.

XAUUSD Gold Intraday Analysis 11.08.2025Price has recently broken below the ascending trendline and is currently trading beneath a key supply zone between 3375–3380. After the trendline break, the market has shown a strong bearish impulse followed by consolidation, suggesting potential continuation to the downside.
If price retraces back into the 3375–3380 area and shows clear signs of rejection (such as bearish engulfing, rejection wicks, or lower time frame structure shift), I will be looking for short entries with a target towards the next demand zone around 3345.
Trade Setup:
Sell Limit: 3375–3380 (upon rejection confirmations)
Stop Loss: Above 3385
Take Profit: 3365/3355/3345
This setup provides a favorable risk-to-reward opportunity, aligning with the current bearish structure after the break of trendline support.
Always follow proper risk management and wait for confirmation before entering.

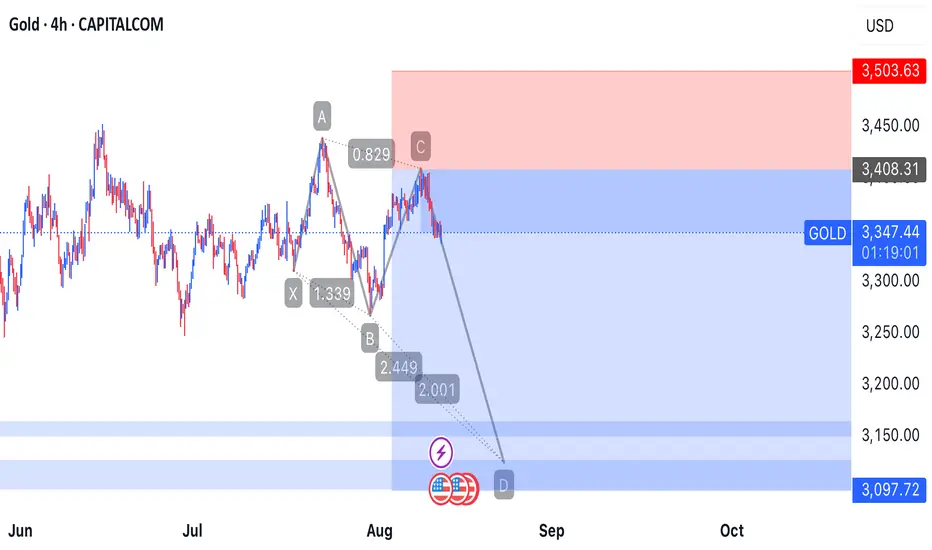
A ceasefire between Russia and Ukraine? A shift in gold's trend?Information Summary:
US President Trump stated that he would meet with Russian President Vladimir Putin in Alaska on August 15th to discuss ending the Russia-Ukraine conflict. However, Trump added that any peace agreement would involve the controversial prospect of a "lord swap." Following this news over the weekend, gold prices plummeted from around $3,400 to $3,367 in early Asian trading.
Market Analysis:
A small pullback occurred in early Asian trading, confirming last Friday's support at $3,370. The market has been fluctuating between $3,370 and $3,400, with both bulls and bears fluctuating. This volatility doesn't discriminate between bulls and bears; it all depends on the entry point. A good entry point offers profit opportunities for both bulls and bears.
Currently, the 1-hour chart shows gold fluctuating at high levels. Although it challenged above $3,400 last week, it hasn't held steady. Furthermore, it retreated during Monday's Asian session. At this point, caution is advised when bullish. The early Asian session decline isn't a concern; the continued decline during the European session is. Quaid recommends choosing a trading opportunity at the US market open.
Gold's current trend remains downward in the short term. A series of resistance levels have formed around 3,400, making a rebound unlikely on Monday. Focus on support at 3,360. If this level breaks, gold could continue its downward trend towards 3,330.
Trading Strategy:
Short around 3,400, stop loss at 3,410, profit range 3,380-3,365
Long around 3,360, stop loss at 3,350, profit range 3,380-3,400

Will gold test 3500 again next week?
💡Message Strategy
Amidst heightened global economic uncertainty, the gold market has experienced a thrilling roller-coaster ride this week.
Most Wall Street professionals and retail investors are bullish on gold's short-term outlook, with a broad expectation that prices will surge past $3,400 per ounce next week.
This is driven not only by the panic caused by this week's tariff saga but also by upcoming key inflation and consumer data, which are likely to reinforce market expectations of a Federal Reserve rate cut and boost gold's appeal as a safe-haven asset.
📊Technical aspects
Next Week's Market Preparations (Two Directions)
Preparation 1: The US dollar index has been trading at a low level. If it breaks a new low intraday, gold and silver may break out of their two-week range. This presents a relatively certain window for follow-up trading, requiring advance preparation, as the timeframe is short.
Background: Expectations of a rate hike have yet to materialize, and the US dollar index will continue to trade at a low level, providing fundamental support for the highs in gold and silver.
Preparation 2: The trend line pattern at 3300 remains crucial. If it continues above 3300, the highs remain. 3400 is the key integer level for breaking through the range, and a breakout indicates continued upward movement, with the median at 3350.
Background: The high-level market foundation is in place, with bulls primarily attacking above 3350. 3400 signals a range breakout. If a rate hike is implemented, consider revisiting 3300. The 100-point swing range is ample for trading.
Direction 1: The US dollar index breaks below its lows. A break below 3400 could lead to a new high, signaling a continuation of the bullish trend. Maintain a regular position for swing trading. If it breaks through strongly, gold could potentially revisit the 3500 mark.
Direction 2: A rate hike is confirmed, signaling a 3350 level. The trend line at 3300, the depth of which will be reported separately.
💰Strategy Package
Long Position:3375-3385,SL:3355,Target: 3420-3440

bearable bear bull waiting for monthly candle retracementhi guys if this gold daily candle will close like a huge red volume candle it is possible that this the first line of this poly line will play, although i am looking for retracement in this coming months i have small short position limit order at 3451 with very close maybe it is like stop hunt entry

Gold scalpWell, considering the Sharpe decline we had, it is likely that this channel will break and we will fall to the specified level.

GOLD BEARISH BIAS RIGHT NOW| SHORT
GOLD SIGNAL
Trade Direction: short
Entry Level: 3,377.31
Target Level: 3,327.89
Stop Loss: 3,409.93
RISK PROFILE
Risk level: medium
Suggested risk: 1%
Timeframe: 9h
Disclosure: I am part of Trade Nation's Influencer program and receive a monthly fee for using their TradingView charts in my analysis.
✅LIKE AND COMMENT MY IDEAS✅

August 7, 2025 - XAUUSD GOLD Analysis and Potential OpportunitySummary:
Price action today is likely to stay within the 3358–3385 consolidation zone. Inside this range, the strategy is to sell near the top and buy near the bottom. Watch 3365 — if it breaks, look for short opportunities on pullbacks; if 3375 holds, look for long setups on dips. Overall, the support and resistance levels are cluttered, suggesting potential choppy moves. I’ll only act on very clean setups near key levels. If they don’t form, I’ll stay on the sidelines. Protect your capital and trade smart — good luck!
📍 Key Levels to Watch:
• 3405 – Resistance
• 3400 – Psychological resistance
• 3390 – Key intraday resistance
• 3375 – Resistance
• 3365 – Support
• 3350 – Psychological support
• 3345 – Support
• 3334 – Support
📈 Intraday Strategy
SELL below 3365, targeting 3358, then 3350, 3345, 3340
BUY above 3375, targeting 3380, then 3385, 3390, 3394
👉 If you find this helpful or traded using this plan, a like would mean a lot and keep me motivated. Thanks for the support!
Disclaimer: This is my personal view, not financial advice. Always use proper risk control.
GOLD 8/7/25Head and shoulders pattern forming. Waiting for price to create LLs and LHs before taking an entry. Once we get a bearish indication, we will wait for a correction to take an A+ entry.
