Gold Price Setup – Potential Rejection & Long ScenariosPrice is currently consolidating below the H4 Supply Zone after rejecting the ascending trendline twice.
Two key scenarios are in focus:
✅ Scenario 1 – Deeper Pullback to Demand Zone
A retracement into the 1H + 30M Order Block (OB) and liquidity zone near 3,341–3,355 (marked with $$$) could attract buyers.
If bullish momentum confirms, look for a continuation toward 3,388 and possibly the upper trendline near 3,400+.
✅ Scenario 2 – Immediate Push Higher
If price holds above the moving average and fails to break below 3,355, bulls could step in earlier, driving price back to test the trendline resistance.
Breakout of the trendline could target the higher supply region.
🔍 Key Levels to Watch:
H4 Supply Zone (3,440 area) for potential reversal.
3,341 OB Zone for liquidity sweep and reaction.
Trendline Resistance capping the upside.
XAUUSD trade ideas

8/6: Watch for a Potential Double Top FormationGood morning, everyone!
Yesterday, gold experienced its first significant supply pressure around the 3386 level, but with support near 3350—helped by positive data—prices rebounded and climbed back toward 3390, resulting in solid overall gains.
From the 1-day chart (1D) perspective, the technical structure remains bullish, with MA20 providing firm support. Although short-term moving averages are currently converging, the overall bias remains towards a bullish divergence, suggesting further upside potential. There's a possibility for price to test the 3400–3420 zone in today’s session.
That said, the 3386–3398 region may still pose minor selling pressure, although it is not expected to be particularly strong. Key intraday support is seen in the 3378/3372–3362 range. If the market encounters another wave of heavy selling that damages the daily bullish setup, then the 3343–3348 area will become a critical battleground between bulls and bears.
📌 Trading Strategy for Today:
Maintain a sell-on-strength approach, especially if prices approach the 3418–3438 resistance area, where short opportunities become more attractive;
If a pullback occurs, monitor the aforementioned support zones for potential buy-on-dip opportunities, contingent on stability.
⚠️ Market Risk Reminder:
There will be key economic speeches during the US session, which could trigger heightened volatility. Ensure proper risk management and stop-loss settings are in place.

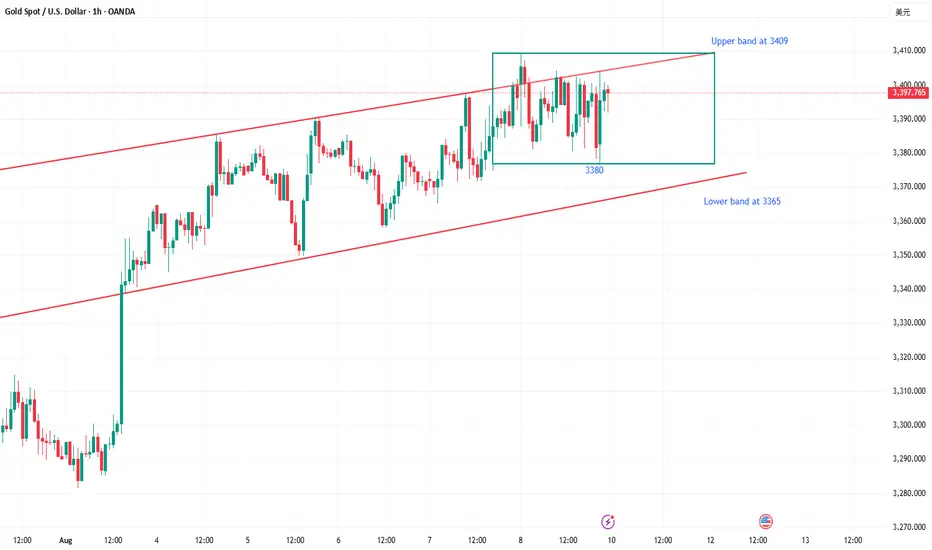
It’s that simple to catch the golden trend.On Friday, gold did not break through the highs or the bottoms, and maintained the range of 3400 to 3380, which was in line with our expectations. In the analysis layout on Friday, I made it clear that I would short at the pressure of 3400 during the day, and go long at the support near 3380 before and after the US market, with an overall gain of 580pips. The points were accurate and there was no error. It was proven by strength that in this market, as long as you don’t chase orders, it is relatively easy to make some profits. Don’t always think about betting on the breakout of the market. Wait for the breakout before doing anything. Just do well in the present. It's better to miss than to do it wrong. The key is how you choose. Stability comes first.
Gold continued to close positively on the weekly chart this week, and after hitting the bottom at 3368 and rebounding, it rebounded with large volume. It is in the process of gradually touching the upper track of the range. Normally, there is still room above, and the range pressure is at 3450. Therefore, we will continue to maintain a bullish mindset next week. In the daily cycle, it fluctuated and washed out repeatedly on Friday, and finally closed with a negative cross star. In the short term, it will maintain operation in the small range of 3409-3380. In terms of operation, continue to go high and buy low before the range is broken, and follow the trend after the breakthrough; an upward breakthrough can be seen at 3425 and 3450, and a downward breakthrough can be seen at 3365 and 3345. For the specific operation rhythm, pay attention to the real-time notification at the bottom.
Gold Market Update weekly demand pullback3360 failed to hold as price action extended into the 3340’s weekly demand zone. This deeper tap into demand strengthens the potential for a bullish recovery, provided price maintains structure above this level.
🟡 Key Watch Points:
Demand Zone Tested: 3340’s
Invalidation: Sustained break below 3340’s
Bias: Bullish recovery if demand holds, follow for more insight , comment and boost idea

XAUUSD LongElite Analysis
Executed in lower time frames.
I did catch the first initial violent move, close majority of the volume.
Executed second entry (More discretionary based - Not pictured)
Targeting upper liquidity pools.

CPI impact on gold H1-H4 TIMEFRAME SETUP
XAUUSD is following the rangbound from 3340-3360 also Today's is the CPI
CPI at 2.5% YoY expected to impacts Fed rate cut odds.
CPI at 2.5% YoY means inflation is cooling. This increases the odds of Fed rate cuts, which is bullish for gold in the medium term
What possible scenario we have?
•I am expecting market will rise at 3330-3335 IfH1-M30 Candle closes above 3330 then ready for spike towards 3355 then 3370. I already hold buy trades at 3338
• secondly If gold breaks to 3330-3327and candle closes below then our buying will be invalid and market will retest 3310.
#XAUUSD

CPI NEWS ANALYSEGOLD XAUUSD CPI NEWS SETUP
waiting for cpi triggered volatility
bullish bias if support holds
buy zone 3340 3337
SL3330
TP1 3350
TP2 3365
TP3 3390
PLAN scale out profits at each target
and ride the news momentum

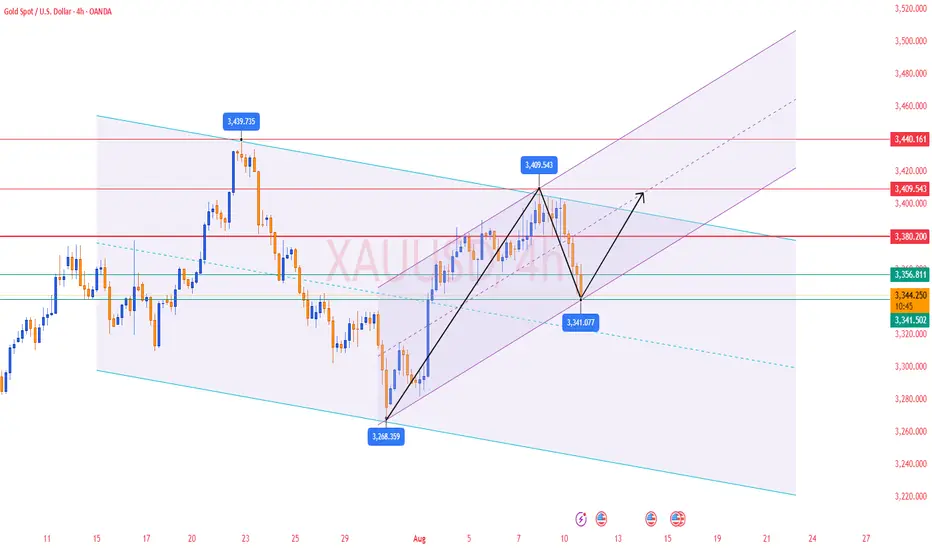
GOLD Will Go Up! Long!
Here is our detailed technical review for GOLD.
Time Frame: 1D
Current Trend: Bullish
Sentiment: Oversold (based on 7-period RSI)
Forecast: Bullish
The market is testing a major horizontal structure 3,341.21.
Taking into consideration the structure & trend analysis, I believe that the market will reach 3,450.36 level soon.
P.S
Overbought describes a period of time where there has been a significant and consistent upward move in price over a period of time without much pullback.
Disclosure: I am part of Trade Nation's Influencer program and receive a monthly fee for using their TradingView charts in my analysis.
Like and subscribe and comment my ideas if you enjoy them!

GOLD 15M BUY CORRECTION BEFORE ANOTHER DUMPGOLD 3341 its very STRONG SUPPORT, and i believe before that breaks we might need to test 3374 area again (WHICH WILL BE VERY GOOD AREA OF SELL, WITH CANDLE CONFIRMATION)
Let see how will react from here
Holaaa :)

XAUUSDXAUUSD Updated in 1H :
The gold signal is marked on the chart based on the latest price changes and the supply and demand in the market. These points include the entry point, stop loss, and take profit

Gold Analysis and Trading Strategy | August 11-12✅ From the current market perspective, the sharp decline in the early session has completely erased the bullish advantage brought by last week’s weekly close. The market is now entering a post-“shakeout” phase, where the next directional choice will be determined.
✅ Support Levels: The 3375–3380 support zone has been breached, putting short-term price action under pressure. The 3350 level is a key support; if it holds, there remains potential for a bullish rebound. However, a decisive break below this level could allow bears to regain control, opening the way for further declines toward 3330, 3315, 3300, and 3270. The move could even extend to 3245 and the 3150–3120 zone, ultimately testing the 3000–2950 range (corresponding to the starting point of the previous rally during the tariff war).
✅ Structural Changes: On the 1-hour chart, the high-volume consolidation zone has been broken to the downside, ending the previous range-bound pattern. The breakdown from the high-level box pattern has formed a short-term topping structure, with significant resistance pressure now overhead.
🔴 Short-term Resistance: 3380-3385 zone remains the primary overhead resistance.
🟢 Short-term Support: 3350–3340 zone remains the key support area
XAUUSD – Technical Analysis H1 (August 11, 2025)1. Overall Trend
On the H1 timeframe, gold is in a clear downtrend after failing to hold the resistance zone at 3,379 – 3,385. The EMA9 has crossed below EMA20, confirming short-term bearish pressure. Strong selling volume in recent candles indicates sellers are currently in control.
2. Key Support & Resistance Levels
Near-term resistance: 3,367 – 3,368 (EMA9 + descending trendline)
Major resistance: 3,379 – 3,385 (previous supply zone + 0.382 Fibonacci retracement)
Near-term support: 3,357 – 3,353 (recent local low)
Target support: 3,333 – 3,332 (0.618 Fibonacci retracement + strong demand zone)
3. Price Action & Pattern
Price has formed a Break & Retest pattern on the descending trendline.
The downside target is set around 3,332, with a potential R:R ratio of ~3.23 for short positions.
High selling volume suggests price may continue testing deeper support levels before any significant rebound.
4. Intraday Trading Strategies
Sell setup: Look for short entries when price pulls back to 3,367 – 3,368, SL above 3,379, TP at 3,333.
Buy setup (scalping): Consider buys only if price tests 3,332 and shows clear bullish reversal signals with declining sell volume.
Maintain strict risk management with R:R ≥ 1:2 and avoid FOMO during high volatility.
5. Conclusion
Gold remains biased to the downside in the short term, with 3,367 – 3,368 acting as the key decision zone for potential continuation shorts. Patience and confirmation signals are crucial for maximizing profit potential.
Follow for more high-quality daily gold trading strategies.

Patience testing GoldWe are still waiting for a pullback to enter long. Market is in the middle of the range and risk reward is still not great if entered at this level. What's your thought?

Gold?
Hi,
Broke last friday low.
Broke up trendline from last week
I think will continue downwards for quite sometime.
All the best
Choose best entries.
Not a guru

XAUUSD – Is Gold Ready for Its Final Rally? 📈 Elliott Wave Analysis on XAUUSD – Is Gold Ready for Its Final Rally? 💥
On the daily chart of XAUUSD, we’re observing the completion of a wave 4 triangle correction (ABCDE), which seems to be setting the stage for the beginning of wave 5 in the larger bullish cycle.
✅ Wave 3 showed a strong impulsive structure, and now the wave 4 triangle suggests consolidation before an explosive breakout toward the $3900 zone.
📍Key Resistance: 3900
🌀 We're anticipating a breakout above the upper channel line, potentially launching a sharp move as wave 5 unfolds.
💬 Share your thoughts in the comments! Do you think gold is ready to break its all-time high?
🔥 Save this idea & follow for future updates!
------------------------------------------------------------------------------------------------------
🚀 Who am I?
I'm Mahdi, a prop firm trader with 7+ years of experience in technical analysis, mainly focusing on Smart Money Concepts and Elliott Wave theory.
I specialize in delivering high-quality trading signals, market insights, and educational content tailored for serious traders and investors.
📊 My Tools: SMC, Elliott Wave, Fibonacci, Liquidity Grabs, Order Blocks
💼 Prop Challenge Passed: Yes | Funded Account: In Progress
🔗 Follow for consistent updates and trading insights.

XAUUSD Weekly Plan a Liquidity Clean-Up?XAUUSD Weekly Plan – The Final Bullish Push Before a Liquidity Clean-Up?
Are you ready for a high-volatility week?
Last week, Gold continued to move steadily inside its bullish channel, reaching the FVG High Zone and pushing towards the strong resistance cluster at 3426–3428 (OBS Sell Zone).
The bullish structure on H2–H4 remains intact, but as price enters the distribution zone, candles are tightening, and volume is fading — a clear sign that buying pressure is weakening.
Macro Backdrop – What’s on the Calendar?
This week is packed with high-impact USD data:
CPI (Aug 12) – Major inflation reading, key driver for USD & Gold.
PPI (Aug 14) – Producer inflation, often a leading indicator for CPI trends.
Unemployment Claims (Aug 14) – Short-term labour market indicator.
💡 Expectations:
CPI & PPI are forecast to improve compared to last month.
If confirmed, this could trigger a sharp Gold pullback as USD strengthens.
However, a weak CPI/PPI could give Gold one last bullish spike before reversal.
Technical Outlook
The H2 bullish channel is well-defined.
The top of the channel aligns with the FVG High Zone — a key area for big player sell limits and profit-taking.
Likely scenario:
Price extends to test 3426–3428 Sell Zone.
Bearish reaction → Channel breakdown.
Retest VPOC 3395–3400 → Drop towards liquidity pools below.
Key Trading Levels
SELL Zone: 3426 – 3428
SL: 3434
TP: 3420 → 3415 → 3410 → 3405 → 3400 → 3395 → 3390 → 3380 → 3370 → 3360
BUY Zone: 3330 – 3328
SL: 3322
TP: 3335 → 3340 → 3350 → 3360 → 3370 → 3380
Risk Management Notes
⚠️ This is a high-risk news week — false breaks are highly possible before & after CPI/PPI.
Avoid holding heavy positions during key data releases.
If price breaks above 3434 with strong volume, bearish scenarios are invalid → wait for a new structure.
📌 Summary:
Primary bias → Sell from 3426–3428, target downside liquidity pools.
Secondary play → Buy from 3330–3328 if liquidity sweep occurs.
Stay disciplined. Manage risk. Don’t get caught in the volatility trap.
— MMFlow Trading

Risk aversion is intensifying. Is gold poised for a breakout?Gold prices fell slightly in Asian trading on Friday, retreating from a two-week high of $3,409 hit the previous day as most investors chose to take some profits before the weekend.
Nevertheless, trade-related uncertainties continue to support gold. US President Trump announced this week that he would impose additional tariffs on Indian imports as a "punishment" for its purchase of Russian oil, raising the total tariff to 50%. He also plans to impose additional tariffs on semiconductors and pharmaceutical products next week.
In addition, the Federal Reserve’s policy expectations are also positive for gold prices. US non-farm payroll data for July was weak, with unemployment claims rising for the second consecutive week, signaling a weakening labor market. Data from the US Department of Labor showed that initial jobless claims rose to 226,000 in the week ending August 2, the highest level since early July.
Technically, gold prices encountered resistance near the upper limit of the daily rising channel and retreated after testing $3,410. Previously, the price of gold effectively broke through the resistance area of $3,380, showing that bulls still have momentum.
The momentum indicators in the daily chart: MACD and RSI remain upward, but the short-term rise has slowed down, indicating that the market has entered a consolidation phase.
If the gold price can regain its footing above $3,409, it is expected to test the $3,420 resistance area, and further targets will point to the historical highs of $3,434 or even $3,500.

GOLD BUY Gold will be buying soon and keep respecting it’s patterns so , I will keep the trading simple and straightforward

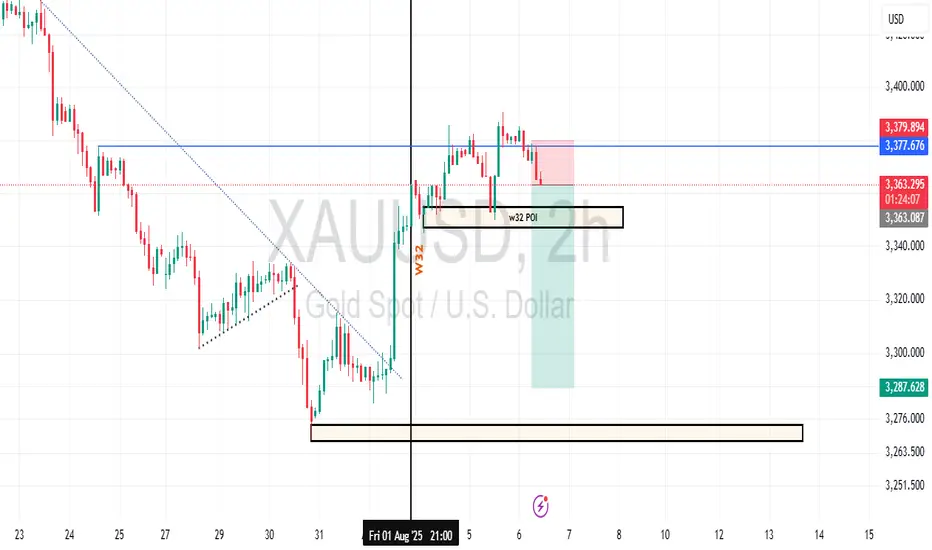
Gold Week 32 Possible reversalGold prices are in a clear downtrend, with critical support at $3,287.628 and resistance at $3,379.874. The 'W32 POI 2H' on Aug 1 highlighted a volatile 2-hour period with a sharp drop and recovery, signaling potential support strength. Fibonacci retracement levels could play a key role in identifying retracement targets. Stay disciplined with risk management as you navigate these levels.
GOLD BUY INTACTFinal bullrun towards 34xx plus is remaining to complete ite wave before goes sideways to decide either going down or ATH

Even the positive CPI is unlikely to help the bulls
The bullish CPI data sent gold soaring from around 3340, reaching a peak near 3354 before entering a period of consolidation. Currently, gold is still fluctuating around 3349, facing strong upward pressure. We continue to monitor the 3366-73 resistance zone, while the 3340 support zone is a viable short-term trading range. If your current trading strategy isn't ideal, I hope I can help you avoid investment setbacks. We welcome your inquiries.
Based on a 4-hour chart, today's short-term resistance is around 3365-73. Intraday pullbacks will continue to support this level, with a view to a continued decline. The short-term bearish zone is 3380-85. Any pullbacks until the daily chart breaks through and holds above this level are opportunities for short selling. Maintain your focus on trend-following trading. I'll provide detailed trading strategies during the trading session, so stay tuned.
Gold Trading Strategy:
Sell gold when it rebounds near 3365-75, with a stop loss at 3384 and a target of 3340-3345. Hold if it breaks through.

Gold Spot / U.S. Dollar (XAU/USD) 4-Hour Chart - OANDA4-hour chart from OANDA displays the price movement of Gold Spot (XAU/USD) from late July to mid-September 2025. The current price is $3,335.985, reflecting a decrease of $6.670 (-0.20%). Key levels include a sell price of $3,335.720 and a buy price of $3,336.270. The chart highlights recent price fluctuations, with a notable drop and a shaded support/resistance zone between approximately $3,340.000 and $3,360.000

# GOLD reversal Zonegold is at really level .
I thing we might see some sideways to accumulation happened in gold in next few trading session. we can add gold around 3320-3300 zone with 3280 as stop loss
target would be around 3500+
