XAUUSD Weekly Plan a Liquidity Clean-Up?XAUUSD Weekly Plan – The Final Bullish Push Before a Liquidity Clean-Up?
Are you ready for a high-volatility week?
Last week, Gold continued to move steadily inside its bullish channel, reaching the FVG High Zone and pushing towards the strong resistance cluster at 3426–3428 (OBS Sell Zone).
The bullish structure on H2–H4 remains intact, but as price enters the distribution zone, candles are tightening, and volume is fading — a clear sign that buying pressure is weakening.
Macro Backdrop – What’s on the Calendar?
This week is packed with high-impact USD data:
CPI (Aug 12) – Major inflation reading, key driver for USD & Gold.
PPI (Aug 14) – Producer inflation, often a leading indicator for CPI trends.
Unemployment Claims (Aug 14) – Short-term labour market indicator.
💡 Expectations:
CPI & PPI are forecast to improve compared to last month.
If confirmed, this could trigger a sharp Gold pullback as USD strengthens.
However, a weak CPI/PPI could give Gold one last bullish spike before reversal.
Technical Outlook
The H2 bullish channel is well-defined.
The top of the channel aligns with the FVG High Zone — a key area for big player sell limits and profit-taking.
Likely scenario:
Price extends to test 3426–3428 Sell Zone.
Bearish reaction → Channel breakdown.
Retest VPOC 3395–3400 → Drop towards liquidity pools below.
Key Trading Levels
SELL Zone: 3426 – 3428
SL: 3434
TP: 3420 → 3415 → 3410 → 3405 → 3400 → 3395 → 3390 → 3380 → 3370 → 3360
BUY Zone: 3330 – 3328
SL: 3322
TP: 3335 → 3340 → 3350 → 3360 → 3370 → 3380
Risk Management Notes
⚠️ This is a high-risk news week — false breaks are highly possible before & after CPI/PPI.
Avoid holding heavy positions during key data releases.
If price breaks above 3434 with strong volume, bearish scenarios are invalid → wait for a new structure.
📌 Summary:
Primary bias → Sell from 3426–3428, target downside liquidity pools.
Secondary play → Buy from 3330–3328 if liquidity sweep occurs.
Stay disciplined. Manage risk. Don’t get caught in the volatility trap.
— MMFlow Trading
XAUUSD trade ideas

True or false? How to Decide Between Long and ShortInfluenced by the news related to tariffs, gold has just completed a fluctuation of nearly $20 in a very short period of time, breaking the silence of the gold market in one fell swoop. Separately, news indicates that the White House is planning to clarify the misinformation surrounding gold bar tariffs.
If there were traders who had rashly entered the market before, in the absence of strict trading system constraints and strict trading discipline, they would inevitably suffer certain losses regardless of whether they chose to go long or short.
This is also the reason why after giving my daily trading strategies, I will repeatedly emphasize the importance of strictly adhering to trading planning and discipline.
For ordinary traders, it's difficult to discern the authenticity of this news. After all, the Trump administration has a history of denying its own statements. Therefore, sometimes it's wise to remain on the sidelines.
This is also what I specifically reminded you to do when publishing my trading strategy this morning: be sure to trade with a small position today and be vigilant to potential unforeseen circumstances.
buy gold saw liquidity sweep and unmitigated zones. comment for my explanation because I want to teach serious people only
thank you

8/8: Continue to Focus on Selling, Watch Support at 3372–3366Good evening, everyone!
Today, after breaking above the 3400 level, gold experienced a pullback. The current structure shows dense support below, with previous resistance levels at 3378, 3372, and 3366 now turning into support.
On the daily chart (1D), price remains above the MA20, and the MA5 (~3382) serves as key short-term support. The candlestick formation still reflects a bullish structure for now.
However, the 4-hour chart (4H) reveals significant upward resistance, and unless the 4H structure is repaired, the market may favor a corrective or consolidation phase in the near term.
🔍 Trading Outlook:
For the remainder of today’s session and early next week, the strategy should primarily focus on selling into strength.
If the 4H chart corrects via a direct price retracement, gold could potentially test the 3348–3337 support zone.
Prior to that, closely monitor the 3372–3366 area as the primary short-term support and pivot zone.

My #3,400.80 Medium-term Target deliveredAs discussed throughout my yesterday's (and many other analysis) commentary: If you have been Buying every dip as per my suggestion you would be in excellent Profits now. I have been Buying Gold from my #3,357.80, #3,367.80, #3,372.80 and #3,378.80 key entry points (last batch of Buying orders closed with Target late U.S. - early Asian session last night).
Technical analysis: Gold is under unprecedented Volatility (however with Bullish underlying trend) with Gold (Xau-Usd Spot) and the Futures price on a tight spread. This is of course the product of heavy speculation in the Metals market, fuelled by the expectation that the Fed’s new talks will be accepted. Needless to mention, this environment is Gold friendly. Technically I do see current aggressive decline in form of a correction as not sustainable however I cannot approach current configuration Technically since these are Fundamentally driven sessions but I do expect a slight pullback back towards #3,352.80 - #3,357.80 only for Gold to soar even more, as the main Support and Higher High’s High’s / Low’s cluster is nearby (#3,357.80 - #3,367.80). Despite Bond Yields stabilization, the continuous Low’s on DX on parabolic decline are adding Buying pressure on Gold and limiting all Selling advance which I am utilizing to it's maximum with my set of Buying orders.
Technical analysis: Gold is Trading on my predicted values as I really don’t mind current consolidation candles within newly formed Hourly 1 chart's Neutral Rectangle. Price-action has made marginal High's on Hourly 4 chart with #3,409.80 (local High's I mentioned earlier that can stall the uptrend) showcasing strong durability. If #3,400.80 benchmark however gets invalidated on High Volume (the last #3-session horizon had been really strong however ahead of local Resistance zone test very anemic) then I can call a test of the #3,427.80 Higher High's extension which represents my next Short-term Target. Gold is extremely Overbought however there are no signs of uptrend exhaustion as I don’t see any firm reason why #3,400.80 benchmark wouldn’t be re-tested within #2-session horizon. Remember, Weekly chart (#1W) still needs a slightly Lower Price (mentioned on previous remarks) before further uptrend as I mentioned that Gold dips only to rise more (Buying accumulation). DX is testing my Higher Low’s heavy Resistance zone as I haven’t got any reservations or doubts regarding its correlation to Gold.
My position: I have re-Bought Gold from #3,382.80 many times throughout yesterday's session and did final aggressive set of Buying orders on #3,388.80 calling for #3,400.80 benchmark late U.S. session which was delivered. I have closed all on #3,400.80 benchmark utilizing current upside push to it's maximum however Gold extended the rise towards #3,409.80 even. I stayed awake and re-Bought #3,395.80 few times since I knew Price-action will be circling #3,400.80 mark and consolidate. I will call it for this week and take early weekend break as I am more than satisfied with my Profits.

XAUUSD Technical AnalysisGold is currently trading within a rising wedge pattern on the 1-hour chart. The price recently touched the upper trendline of the wedge and faced a strong rejection, indicating bearish pressure. If the price breaks below the lower boundary of the wedge, it will likely trigger a sharp bearish move.
Key downside targets after a confirmed breakdown are:
3340
3300
3270
If Gold drops below 3270, the next significant support lies at 3250 on the daily chart. A daily close below 3250 will confirm a shift in the medium-term trend, opening the path toward the 3000 psychological level.
OANDA:XAUUSD
Quarterly Shit Analysis - Sept - Dec 2025 - XAUUSDMy last three quarterly analysis proved correct. In the last analysis, I predicted that gold will move within a range, it did happen.
For the new quarter, here is my new analysis. Between 14 Aug 2025 to 01 Sept 2025, I expect the following:
1- Scenario 1: Bullish Trend
Since May 2025, #XAUUSD has created good bullish indications on the Daily and Weekly Charts. Therefore, it could start a new trend.
Conditions: Gold must close a strong bullish daily candle above 3452 first , then another strong daily bullish candle above 3500. The closure of a strong daily candle above 3452 should happen between 14 Aug to 01 Sept. The closure of the daily candle above 3500 is fine to happen after September 1st.
Targets: If the conditions above are met, Gold will start a new bullish trend. The targets will be: 3668, 3750, 3840 and 4,000 or 4043.
If Gold closes a strong daily candle above 3500, the ideal support lines to buy gold will be 3451, 3400, 3364, 3330 and 3300. The best support line, if Gold makes deep retracements will be 3228 and 3162.
2- Scenario 2: Expanded Range (Likely Scenario)
The range for the previous quarterly analysis was from 2956.5 to 3500, but for most of the past months since May 1st, Gold has been moving between 3262 to 3452. It is possible that Gold remains in the wider range (2956.5 to 3500), but makes wider moves. This scenario is possible because gold already reached a historic high in April and then entered a wide range, therefore it is possible to remain in the same range for the rest of the year.
This means gold could make deeper retracements into 3228, 3168, 3092, and 3024 and then go up towards, 3330, 3364 and 3452. When it reaches 3300, 3364 and 3452, then it starts new bearish moves again.
Conditions: Gold fails to close daily bullish candles above 3500 and fails to close daily bearish candles below 2956.5. The ideal condition is if gold closes a strong daily bearish candle below 3228 or 3162 between 14 Aug to 01 Sept 2025.
3- Scenario 3: Bearish Move (Unlikely Scenario):
If Gold closes a strong daily candle below 2956, then it will start a surprising bearish trend and will move towards: 2812, 2640 and 2550. This is not a likely scenario.

GOLD SHORT SELLGold rose toward $3,380 per ounce on Thursday, recouping losses from the previous session to trade at a two-week high, as renewed US tariff threats and expectations of dovish monetary policy boosted the appeal of non-interest-bearing bullion.
President Trump announced a 100% tariff on imported semiconductors and chips, excluding companies that manufacture within the US. He also confirmed that Indian imports will face an additional 25% tariff, while duties on select Brazilian goods were raised to 50%.

GOLD BUY Gold will be buying soon and keep respecting it’s patterns so , I will keep the trading simple and straightforward

Xauusd look Rise Direction Gold has started to rise from the key support zone of 3352–3350, as expected in our previous analysis. Price action indicates a bullish trend, suggesting a potential reversal from the 3350/3345 area.
According to Elliott Wave Theory, it appears that Gold has completed its 5-wave impulsive structure. We are now likely entering a corrective phase, which could still support upward momentum in the short term.
🔑 Key Levels:
Support: 3350 / 3345
Resistance 3400 / 3420

Citi’s bold gold forecast for next 3 months Citi has raised its 3-month gold price target to $3,500-$3,600/oz, up from it previous guidance of $3,300.
The upgrade follows a deteriorating US economic outlook, weakening labor market trends, and growing concerns over Fed and data independence.
Gold is currently testing a critical resistance zone near $3,380, a level that has previously shown signs of price rejection. Although $3,365 arguably might have been the tougher resistance... which is now broken.
The presence of higher lows from previous months could suggest continued strength, potentially supporting the expectation of Citi for gold to trade in the $3,500–$3,600 range.

XAUUSD SELL SETUPGold already on a level of supply zone after the liquidity grab , and on 1hr time frame we already seeing a change of structure and distribution schematic .. also looking from chart pattern thats also a possible head and shoulder pattern.. looking to sell if the retrace back to retest that order block

TIme Equal PriceAs I shared before about the next movement of gold and how the price at that time 3350 is important and will aim till 3400 you can see who accurate is the price with respect to time , no wonder

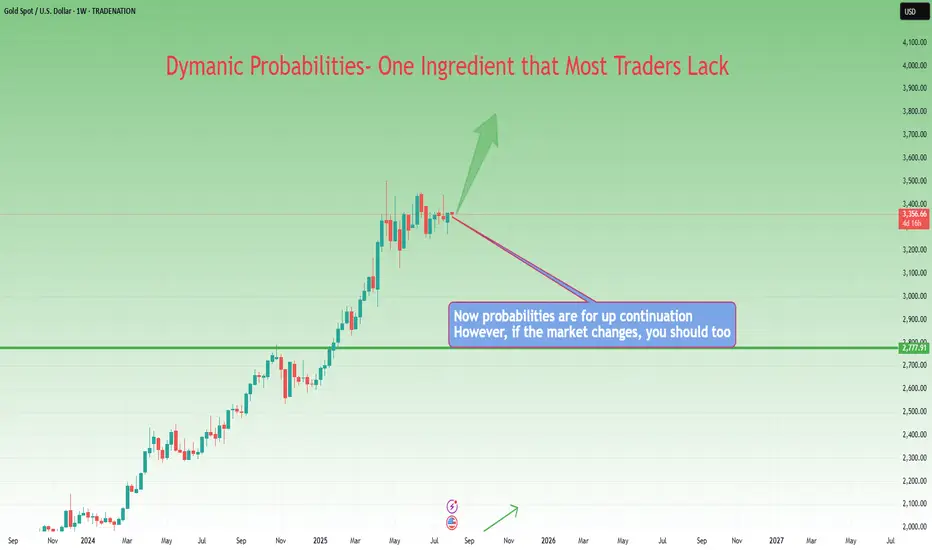
From Execution to Adaptation: Enter Dynamic ProbabilitiesIn the previous article , we looked at a real trade on Gold where I shifted from a clean mechanical short setup to an anticipatory long — not because of a hunch, but because the market behavior demanded it.
That decision wasn’t random. It was based on new information. On structure. On price action.
It was based on something deeper than just “rules” — it was about recognizing when the probability of success had changed.
That brings us to a powerful but rarely discussed concept in trading:
👉 Dynamic probabilities.
________________________________________
📉 Static Thinking in a Dynamic Market
Most traders operate with static probabilities — whether they realize it or not.
They assign a probability to a trade idea (let’s say, “this breakout has a 70% chance”) and treat that number as if it’s written in stone.
But markets don’t care about your numbers.
The moment new candles print, volatility shifts, or structure morphs — the probability landscape changes. What once looked like a clean setup can begin to deteriorate. Conversely, something that looked uncertain can start aligning into high-probability territory.
Yet many traders fail to adapt because they’re emotionally invested in the original plan.
They’ve already “decided” what the market should do, so they stop listening to what the market is actually doing.
________________________________________
🧠 Dynamic Probabilities Require Dynamic Thinking
To trade dynamically, you must be able to update your internal odds in real time.
This doesn’t mean constantly second-guessing or overanalyzing — it means refining your bias based on evolving context:
• A strong breakout followed by weak continuation? → probability drops.
• Price holding above broken resistance with clean structure? → probability increases.
• Choppy pullback into support with fading volume? → potential reversal builds.
It’s like playing poker: you might start with a good hand, but if the flop goes against you, your odds change.
If you ignore that and keep betting like you’ve got the nuts, you’re not being bold — you’re being blind.
________________________________________
📍 Back to the Gold Trade
In the Gold trade, the initial short was based on structure: broken support turned resistance.
The entry was mechanical, the reaction was clean. All good.
But then:
• Price came back fast into the same zone.
• Sellers failed to defend it decisively.
• The second leg down was sluggish, overlapping, and lacked momentum.
• Compression began to form.
That’s when the probability of continued downside collapsed — and the probability of a reversal increased.
The market had changed. So did my bias.
That’s dynamic probability in action — not because of a feeling, but because of evolving evidence.
________________________________________
🧘♂️ The Psychological Trap
Many traders intellectually accept the idea of being flexible — but emotionally, they cling to certainty.
They fear being “inconsistent” more than they fear being wrong.
But in a dynamic environment, consistency of thinking is not about repeating the same action — it’s about consistently reacting to what’s real.
True consistency is not mechanical repetition. It’s mental adaptability grounded in logic.
________________________________________
🧠 Takeaway
If you want to trade professionally, you must upgrade your mindset from fixed-probability execution to fluid-probability reasoning.
That doesn’t mean chaos. It means structured flexibility.
Your edge isn’t just in spotting patterns — it’s in knowing when those patterns are breaking down.
And acting accordingly, before your PnL does it for you.
Disclosure: I am part of TradeNation's Influencer program and receive a monthly fee for using their TradingView charts in my analyses and educational articles.
XAU/USD DAILY - TRIANGLE BREAKOUT CONFIRMED Gold has just broken out of a symmetrical triangle after several weeks of price compression. The price bounced cleanly from the lower trendline (point 0), signaling completed accumulation. The projected target based on the triangle breakout is $3,626, with a protective stop loss at $3,340. Clean breakout with strong indicator confluence. One to watch closely 👀
🎯 Take Profit (TP): 3,626
🛡️ Stop Loss (SL): 3,340
📈 Buy Confidence Level: 88%
🔍 Pure technical analysis – not financial advice.
#Gold #XAUUSD #Breakout #TechnicalAnalysis #TrianglePattern #TradingView #PriceAction

Gold (XAU/USD) Technical Analysis – NeoWave Perspective📅 August 2025 | 📈 4H Chart
📍Posted by: @ CryptoPilot
Gold completed a corrective Wave A near $3160 at the bottom of the descending channel. It then rallied to $3440, followed by a decline toward the channel’s midline at $3227, beginning a potential Wave C.
Attempts to break and hold above the channel failed. Price has since broken below the trendline and is now pulling back to retest it from below.
⸻
🔍 Key Insights:
• 📉 No long entries recommended at current levels
• ✅ Bullish confirmation requires a clear breakout and close above the channel top
• 🛒 Safer long setup may emerge near $3120 at the channel bottom and possible Wave C completion zone.
⸻
🔑 Key Levels:
• Resistance: $3380–$3440
• Support: $3120
• Invalidation / Stop-loss: Below $3110
⸻
📌 Follow @ CryptoPilot for more wave structure insights, SMC confluence, and multi-timeframe strategies.
💬 Drop your thoughts and alternate counts in the comments below!

GOLD A Fall Expected! SELL!
My dear subscribers,
My technical analysis for GOLD is below:
The price is coiling around a solid key level - 3358.0
Bias - Bearish
Technical Indicators: Pivot Points Low anticipates a potential price reversal.
Super trend shows a clear sell, giving a perfect indicators' convergence.
Goal - 3350.7
My Stop Loss - 3362.4
About Used Indicators:
By the very nature of the supertrend indicator, it offers firm support and resistance levels for traders to enter and exit trades. Additionally, it also provides signals for setting stop losses
Disclosure: I am part of Trade Nation's Influencer program and receive a monthly fee for using their TradingView charts in my analysis.
———————————
WISH YOU ALL LUCK
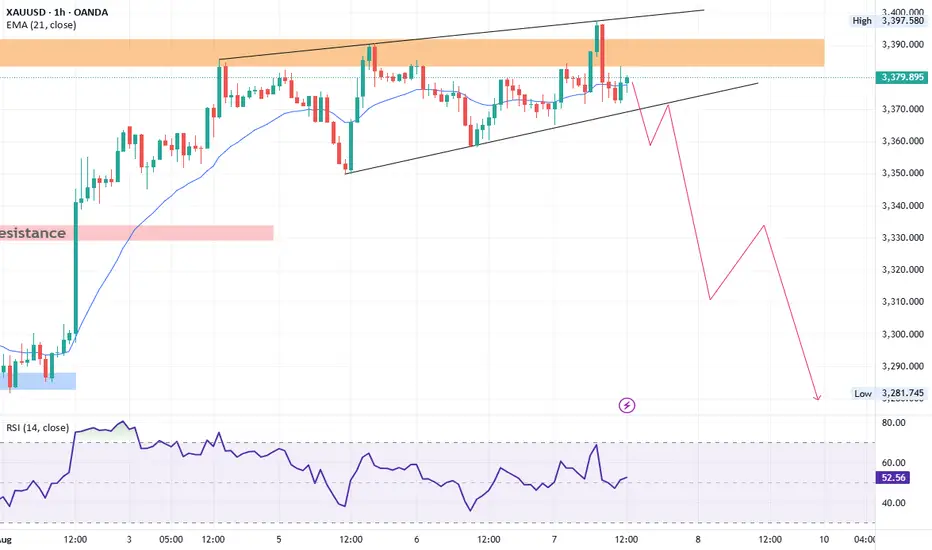
Gold Breaks Rising Wedge – Bearish Targets AheadGold recently broke down from a rising wedge pattern near the $3,385–$3,390 area, signaling potential bearish momentum. Price is currently trading around $3,360, staying below the broken wedge support and also below the main trendline. This breakdown aligns with a shift from short-term bullish to corrective/bearish movement. The trend has shifted bearish unless it reclaims $3,375–$3,388. Short-term bias favors more downside toward $3,350 and $3,342
Key Levels to Watch
- Immediate Resistance: $3,370 – $3,375 (wedge breakdown retest zone)
- Major Resistance: $3,388 – $3,395 (trendline and previous supply zone)
- Immediate Support: $3,350 – $3,352 (short-term Fib and horizontal support)
- Major Support: $3,335 – $3,340 (next demand area)
- Extended Downside Target: $3,322 (Fib 0.22 level)
Note
Please risk management in trading is a Key so use your money accordingly. If you like the idea then please like and boost. Thank you and Good Luck!

Gold (XAUUSD) – 4H Price is currently consolidating near the 3373 level, showing strength above the dynamic support zone and mid-range trend bands. A bullish breakout continuation appears likely, especially if the asset holds the 3360 support zone, which aligns closely with the 38.2% Fibonacci retracement from the recent impulsive move.
Ideal Entry:
Zone: 3360–3365, aligning with a pullback to the Fibonacci 38.2% retracement level and mid-band support.
Invalidation: A clean break and close below 3335 may suggest a deeper retracement or reversal.
🎯 Fibonacci based Targets:
Target 1: 3389 – Immediate resistance and equilibrium level; ideal for partial profit booking.
Target 2: 3422 (38.2% Fib extension) – A stronger extension target in line with the recent highs.
Target 3: 3443 (61.8% Fib extension) – Key swing extension; potential exhaustion or reversal zone.
Stop Loss: Below 3335
As long as price maintains above 3360, the bullish momentum remains valid. Look for bullish candlestick confirmation at entry and increasing volume for confirmation of a move toward the Fibonacci targets.

XAUUSDI'm in Long Position in GOLD in 1 min time frame
Target and Stoploss are mention follow the Risk amangemnet

Golden opportunities are not hard to grasp.Gold Market Forecast for Next Week: Gold News Analysis: The US dollar strengthened on Friday, but it is poised for a weekly decline as weak economic data led traders to price in the possibility of more interest rate cuts this year. Investors also assessed US President Trump's Federal Reserve nominations. Gold prices experienced a roller-coaster week from August 4th to 8th, particularly during the past two trading days, when reports of gold bar tariffs sparked market panic. Despite the White House's eventual clarification of the reports, gold prices remained near the peak of uncertainty, hovering around $3,400. Gold prices tested the $3,400 mark several times this week, but despite increasing expectations of a Fed rate cut and Trump's nomination of dovish Fed officials, prices remained above that level. Until Friday's news of gold bar tariffs, gold prices surged above the $3,400 mark, reaching a high of $3,409, the highest level since July 24th. Following the panic caused by the gold bar tariffs, and despite the US clarification of the reports, analysts and retail investors remain bullish on gold prices for next week. Next week, gold prices will focus on the meeting between Trump and Putin, as well as speeches by several Federal Reserve officials on the economic outlook, and the release of the July unadjusted CPI annual rate.
Gold Technical Analysis: Looking at the current gold price trend, after Friday's pullback and negative close, will gold prices continue to decline next week, or will they rebound and rise? I believe the former is unlikely. The possibility of a new low exists, but it is low. Several attempts at the 3380 support level have failed to break. First, looking at recent price trends, gold prices have continued to rise, with higher highs and lower lows, indicating that the 3268 support level is valid. After rebounding to 3409, it began to fall, closing near 3397, demonstrating the 3380 support level and the strength of bullish sentiment. This suggests that gold prices are currently range-bound at a high level. However, given that the support level remained intact and the price closed above it, the possibility of gold prices breaking below 3380 next week is ruled out. Gold prices failed to break below 3380 on Friday as expected, and the overall trend of rising, falling, and closing lower shows that bulls still have the upper hand. However, I think it is not advisable to conclude that bulls will control the market next week. Although bulls have repeatedly tested 3410 without success, the decline has not been strong. In other words, if the bulls were truly strong, there would be no decline the next day, and the opening of next week should continue to rise. However, the current gold price has not only slowed down its rise, but also shown signs of decline, which means that bears are still holding the 3410 resistance level.
Based on the above, we recommend a low-to-long strategy for early next week, supplemented by high-to-short strategies. Regarding support, watch out for 3380. After yesterday's repeated dips, this will become a key defensive point for bulls at the beginning of next week. A test or break of this resistance level is expected. An unexpected break below would disrupt the bullish short-term trend, with a high probability of seeing 3368 or a continuation of the decline to the 3350 area. However, we prefer a move higher above 3380. Regarding resistance, watch out for the 3410 area. Although this area is at 0.382, the dividing line between 3268 and 3500, and also represents resistance from Friday's high, after adjustments and with bullish momentum, the probability of a breakout is increasing. Therefore, we recommend focusing on the 3343 area, which provides strong resistance from the previous high and also represents the dividing line at 0.236. Upon first approaching or touching this area, try to enter a medium-term short position. On the whole, the short-term operation strategy for gold next week is recommended to focus on shorting on rebounds and long on pullbacks. The short-term focus on the upper side is the 3410-3420 line of resistance, and the short-term focus on the lower side is the 3380-3370 line of support.

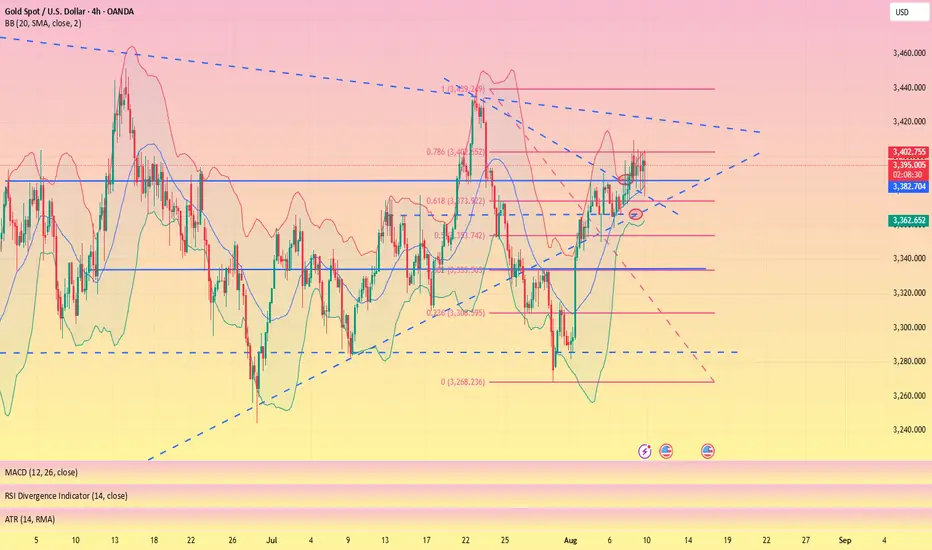
XAUUSD 4Hour TF - August 10th,2025🟦 XAUUSD 4H Analysis
📅 August 10, 2025
Top-Down Trend Bias:
• Monthly – Bullish
• Weekly – Bullish
• Daily – Bullish
• 4H – Bullish
Gold continues to trade in line with the higher timeframe bullish structure, currently testing resistance at the 3,395 zone after a strong upward channel move.
🔍 Key Zone: 3,395
This level aligns with the 78.6% fib retracement and prior structure. The reaction here will determine whether we see a breakout continuation or a corrective pullback.
✅ Scenario A: Bullish Breakout (Blue Path)
1.If price breaks and holds above 3,395
2.Expect continuation toward 3,450
This aligns with the higher timeframe bullish bias and offers solid upside potential
⚠️ Scenario B: Bearish Pullback (Orange Path)
1. If price rejects from 3,395
2.Look for bearish confirmation (engulfing candle, LTF BOS, rejection wicks)
Target 1: 3,320 support
This would be a corrective move within the broader uptrend, offering counter trend opportunities for short-term traders.
🧠 Final Notes
• Higher timeframe bias strongly favors upside continuation
• 3,395 is the immediate decision level, confirmation is key
• Short term pullbacks may offer re-entry opportunities into the larger trend

XAUUSD Gold move 5 Aug 2025Price is currently reacting off a key 15-minute demand zone between 3352 and 3355, which has previously acted as a strong support level. Bullish rejection wicks within this area suggest buying interest and a possible short-term reversal.
The bias is bullish for a retracement move. A potential long opportunity exists from the 3352–3355 support zone, targeting the 3370 area, which aligns with a previous 15-minute supply zone and breakdown origin.
This setup is based on the expectation of a retracement toward 3370 before any further downside continuation. A clean break and close below 3352 would invalidate the idea and suggest continuation lower.
Confirmation through bullish price action within the zone is advised before execution.
