The bullish outlook remains unchanged, go long with the trend!Yesterday, the gold bulls refreshed the high point, and the daily line closed in the form of a medium-sized Yang line with a long lower shadow. The idea of continuing to be bullish in the short term remains unchanged, and what needs to be paid attention to is the strength of the retracement, which is similar to yesterday. The current support below is maintained at the 3355-3350 line of yesterday's rise. This position is also today's key support level, and the key suppression point above is maintained at the integer level of 3390-3400. This position may not be the end point. It was also mentioned yesterday that under the range of the previous large range of fluctuations, if either side does not break through, it will likely continue to fall into fluctuations. The current bullish trend is still relatively obvious, so we still maintain the idea of low-long operations. If your current operation is not ideal, I hope I can help your investment avoid detours. Welcome to communicate!
From the 4-hour analysis, the important support below is the 3355-3350 line. If the daily level stabilizes above this position, the bullish rhythm of falling back to lows and buying on the trend will remain unchanged. Before the daily level falls below the 3350 mark, you need to be cautious about shorting against the trend. I will provide you with the specific operation strategies at the bottom, please pay attention to them in time.
Gold operation strategy: Go long on gold when it retraces to around 3360-3350, target 3375-3385 area, and continue to hold if it breaks through.
XAUUSD trade ideas

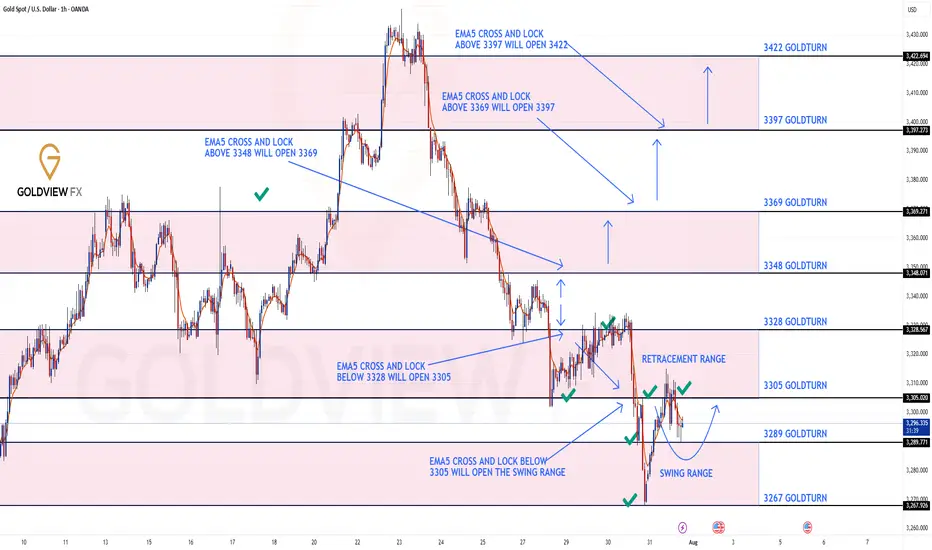
GOLD ROUTE MAP UPDATEHey Everyone,
Quick follow up on our 1H chart route map:
What can I say.....pure perfection on our chart analysis as everything played out exactly as expected.
Yesterday, we identified the first level of the swing range at 3289, which delivered a clean full swing into 3305.
Today, we hit Level 2 of the swing range at 3267, and once again, it played out flawlessly with another full swing up to 3305.
A perfect finish to the day. Great work all around!
We are now looking for support above the swing range and a break above 3305 to track the movement up or further retest and break below the 1st level of the swing range may open the the 2nd level at 3267 again.
We will keep the above in mind when taking buys from dips. Our updated levels and weighted levels will allow us to track the movement down and then catch bounces up.
We will continue to buy dips using our support levels taking 20 to 40 pips. As stated before each of our level structures give 20 to 40 pip bounces, which is enough for a nice entry and exit. If you back test the levels we shared every week for the past 24 months, you can see how effectively they were used to trade with or against short/mid term swings and trends.
The swing range give bigger bounces then our weighted levels that's the difference between weighted levels and swing ranges.
BULLISH TARGET
3348
EMA5 CROSS AND LOCK ABOVE 3348 WILL OPEN THE FOLLOWING BULLISH TARGETS
3369
EMA5 CROSS AND LOCK ABOVE 3369 WILL OPEN THE FOLLOWING BULLISH TARGET
3397
EMA5 CROSS AND LOCK ABOVE 3397 WILL OPEN THE FOLLOWING BULLISH TARGET
3422
BEARISH TARGETS
3328 - DONE
EMA5 CROSS AND LOCK BELOW 3328 WILL OPEN THE FOLLOWING BEARISH TARGET
3305 - DONE
EMA5 CROSS AND LOCK BELOW 3305 WILL OPEN THE SWING RANGE
3289 - DONE
3267 - DONE
As always, we will keep you all updated with regular updates throughout the week and how we manage the active ideas and setups. Thank you all for your likes, comments and follows, we really appreciate it!
Mr Gold
GoldViewFX
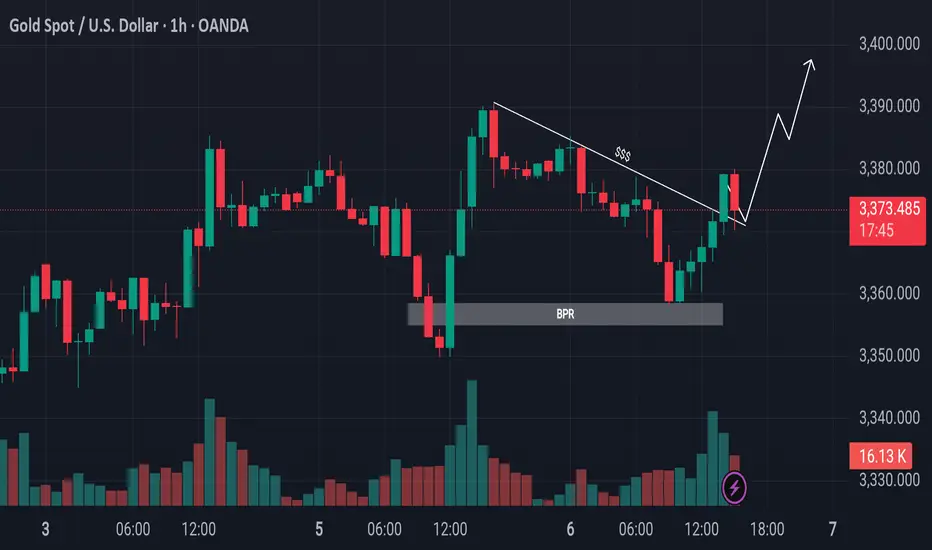
Gold Retraces to OTE and Breaks ResistanceEyes on Swing Highs!Gold Market Update
The gold market declined from its previous bullish leg and retraced below the 50% level, reaching into the Optimal Trade Entry (OTE) zone. It also tapped into a Bullish Price Rejection (BPR) area. Following that, price broke above the trendline resistance. Currently, it is advisable to wait for a potential retest of the breakout level. If confirmed, the market could continue its upward movement toward the previous swing highs.
Do Your Own Research (DYOR)
XAUSD : M30 Long BiasThis trading plan adopts a bullish bias, anticipating an upward move initiated with an entry into the Fair Value Gap (FVG) zone highlighted on the chart.
Key Components of the Plan:
Entry Zone:
The primary entry for a long position is upon price entering the FVG area (Fair Value Gap). This gap represents a price imbalance, often caused by institutional buying or selling, where the market tends to revisit to fill the gap before continuing its trend. Buying at this zone provides a good risk-reward profile.
Price Context :
Current price is approaching the FVG after a prior strong bullish move, indicating the possibility of a pullback to accumulate before price continuation.
Target Area:
Expect the price to move upward from the FVG zone towards higher levels, potentially reaching recent swing highs or resistance zones mapped by Smart Money Concepts such as order blocks or liquidity targets.
Stop Loss Placement:
A prudent stop loss can be placed just below the lower boundary of the FVG zone or below the strong recent low, to protect against extended downside moves invalidating the trade setup.
Trade Rationale:
The plan leverages smart money concepts where institutional buying in the FVG zone creates a strong demand area for positioning long. This is backed by the technical structure seen in the chart and typical market behavior of filling such gaps.

Gold Showing Signs of Reversal After Hitting Key ResistanceHello Guys.
Gold has reached a major resistance zone around 3439–3425, which has already acted as a strong ceiling in the past. The price tapped into this area again, forming a clear divergence, and failed to break higher.
Here’s what stands out:
Divergence signals a weakening bullish momentum at the top.
The price rejected the resistance and is now breaking structure to the downside.
A minor pullback may occur before continuation, as shown in the projected moves.
First target: 3259.792
Second target (if support breaks): 3136.869, a deeper zone for potential bounce or further drop.
This setup hints at a bearish trend building up. Stay cautious on longs unless the price structure changes again.

XAUUSD Long ProjectHi guys...😎
It's time to do a Long Project on XAUUSD with 3 key reasons:
1. Price Drivers: institutional longing
2. Trend: up
3. Momentum: bullish
Action: waiting for entry on the intraday timeframe (entry will be published further)
Check the trend If the price consolidates above the green resistance zone, the uptrend is likely to continue. Otherwise, a correction to the support zone is possible.
XAUUSD--SHORT--short term sell possibbility
--last week I was expecting gold rise but couldnt break the yellow trendline.
--so this week I expect first price will fall down to the 3333 level, then maybe try to rise again

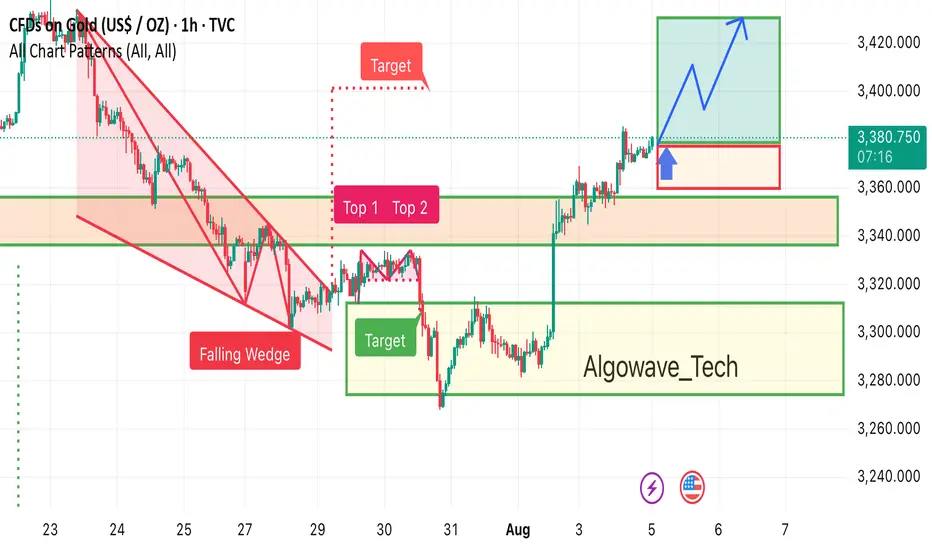
Gold 1h chart pattern Gold has broken out of the falling wedge pattern, showing strong bullish momentum. If price holds above the highlighted support zone, the next potential upside target lies in the 3,425 area. Watching for a healthy retest before continuation.
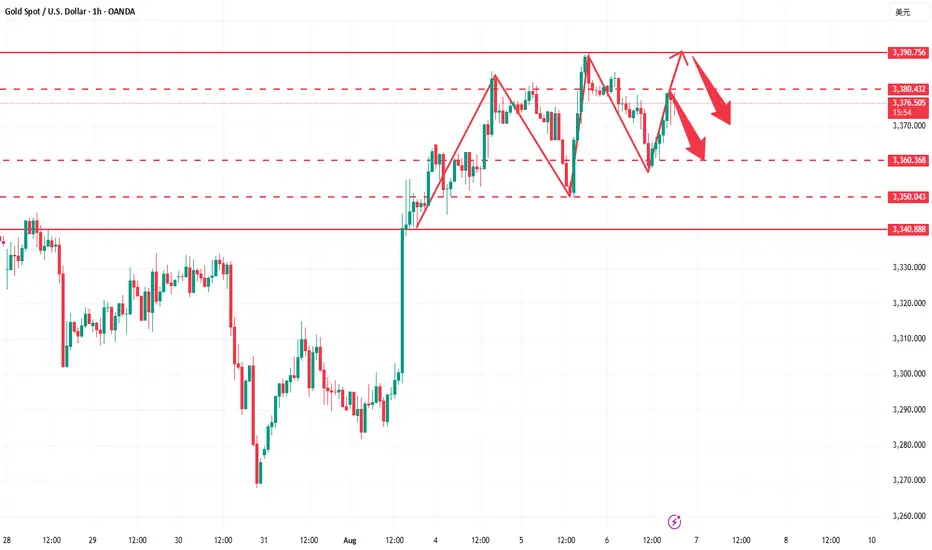
Grasp the key opportunities in gold tradingBefore and after the European session, gold fell back and adjusted again; in the U.S. session, it stabilized and rebounded above 3340 as expected, and continuous low-long layouts achieved steady profits. From the hourly chart structure, the gold trend was highly consistent with the prediction, which not only continued the downward adjustment rhythm, but also released the profit space of rebound long orders, showing the fierce game between the long and short forces in the market.
The 1-hour moving average has begun to turn downward, significantly strengthening bearish momentum. During the US trading session, gold failed to break through the key resistance zone of 3365-3380. This area remains a key defense for bears in the short term.As long as gold fails to effectively break through and hold 3380, the bearish trend will continue to dominate the market, and rebounds will provide favorable opportunities for short positions. The continuous breaking of new lows indicates that bears have a stronger advantage, and bulls are unlikely to achieve a sustained reversal. During trading, it is recommended to strictly implement risk management, reasonably control positions, and position accordingly, seizing every rebound short opportunity. Subsequently, monitor the performance of the key support level of 3340-3330. If this support level fails, bearish momentum will further intensify. Otherwise, there will be limited room for short-term adjustments. Overall, gold is still in a bear-led, volatile downward phase. The main strategy is to short on rebounds, supplemented by buying on pullbacks, and respond flexibly to market changes.
Gold operation suggestion: short gold when it rebounds around 3365-3380, target 3350-3340. If gold falls back to 3340-3330 and stabilizes, consider going long with the target at 3355-3360.


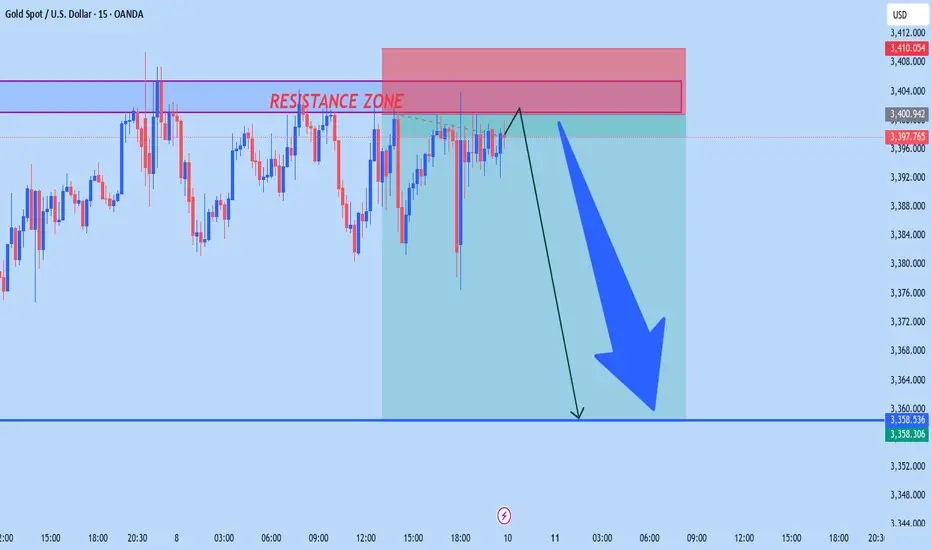
XAUUSD NEW OUTLOOKAccording to M15 analysis gold market is running side wave from 3375 to 3400 now market will be reject from RESISTANCE ZONE be caureful use money management dont be greedy
TRADE AT YOUR OWN RISK
11/08/25 Gold Swing LevelsSet your alerts. Watch the 5 mins (1 min if price spiking)
11/08/25 levels are marked; expecting a down trend
Always, price action determines trade.
Trade parameters
Entry on 5 min chart
Sl: 20-40pips
TP: 2-4x SL

Shorting at highs is steadier to avoid risksAlthough gold kept breaking through its daily highs last week, rising all the way to around 3410 before starting to pull back, and the daily lows were also gradually climbing – making it easy to profit whether going long or short – I still recommend prioritizing shorting at high levels. This way, we can avoid losses if gold drops sharply. 📉
Go short at highs during the Asian session 📉
Go long at lows during the European session 📈
Go short at highs again during the U.S. session 📉
⚡️⚡️⚡️ XAUUSD ⚡️⚡️⚡️
🚀 Sell@ 3410 - 3400
🚀 TP 3390 - 3380 - 3370
Daily updates bring you precise trading signals 📊 When you hit a snag in trading, these signals stand as your trustworthy compass 🧭 Don’t hesitate to take a look—sincerely hoping they’ll be a huge help to you 🌟 👇
Gold Bull Trap and Technical Analysis Outlook (Daily) Bull Trap Analysis
Definition: A bull trap occurs when price breaks above resistance (luring bulls) but reverses sharply downward.
Current Evidence:
Price Action: Gold rallied to $3397.02 but shows exhaustion signs (e.g., long upper wicks on 4H/daily candles).
Volume & VWAP: Declining volume on the breakout + price now below VWAP on 4H charts suggests weak follow-through.
Divergence: Daily RSI (14) at 68 but curling downward while price made a higher high – bearish divergence.
Conclusion: High risk of a bull trap if price closes below $3385 (key support).
1. Japanese Candlestick Analysis
Intraday (5M-4H)
4H: Bearish Engulfing at $3397.02 signals rejection of highs.
1H: Dark Cloud Cover below $3400 confirms bull trap.
30M/15M: Shooting Stars at $3395 indicate exhaustion.
5M: Three Black Crows pattern suggests strong bearish momentum.
Outlook: Bull trap confirmed if $3390 breaks.
Swing (4H-Monthly)
Daily: Gravestone Doji at $3397.02 warns of trend exhaustion.
Weekly: Bearish Harami after 3-week rally signals distribution.
Monthly: Long-legged Doji at all-time highs ($3400) indicates indecision.
2. Harmonic Patterns
Intraday
4H/1H: Bearish Butterfly completing at $3397.02 (D-point).
PRZ: $3390–$3400 (127.2% XA + 161.8% BC).
30M: Bullish Crab forming at $3370 (secondary setup).
Swing
Daily: Bearish Gartley near $3400 (78.6% XA retracement).
Weekly: Potential Bullish Bat at $3350 if correction extends.
3. Elliott Wave Theory
Intraday
4H: Wave 5 of impulse cycle peaked at $3397.02.
Structure: Completed 5-wave sequence from $3300 → $3397.02.
Corrective Phase: ABC pullback targeting $3350 (Wave A).
1H: Sub-wave (v) ending with RSI divergence.
Swing
Daily: Wave 3 of primary bull cycle nearing completion at $3400.
Weekly: Wave (iii) of larger impulse, expecting Wave (iv) correction to $3300.
Monthly: Wave V of multi-year bull run, nearing major resistance at $3400.
4. Wyckoff Theory
Intraday
Phase: Distribution (after markup from $3300 → $3397.02).
Signs: High volume at $3397.02 (supply), failed upthrust above $3400.
Schematic: Phase C (markdown) initiating.
Swing
Daily: Late Markup → Distribution at $3400.
Weekly: Accumulation completed at $3200; now in Markup but showing signs of exhaustion.
5. W.D. Gann Theory
Time Theory
Intraday: Key reversal windows:
UTC+4: 08:00–10:00 (resistance test), 14:00–16:00 (trend reversal).
Swing:
Daily: 12th Aug (4 days from close) for time squaring.
Weekly: 16th Aug (1 week) for cycle turn.
Square of 9
$3397.02 → Resistance Angles:
0° ($3400), 90° ($3420), 180° ($3450).
Support: 45° ($3350), 315° ($3300).
Angle Theory
4H Chart: 1x1 Gann Angle (45°) from $3300 low at $3350. Price overextended.
Daily Chart: 2x1 Angle (63.75°) at $3397.02 acting as resistance.
Squaring of Price & Time
Price Range: $3300 → $3397.02 (97.02 points).
Time Squaring: 97 hours from $3300 low → $3400 resistance.
Ranges in Harmony
Primary Range: $3300–$3450 (150 points).
50% Retracement: $3375 (critical support).
61.8% Retracement: $3350.
Secondary Range: $3350–$3400 (50 points).
Price & Time Forecasting
Intraday Targets:
Short-Term: $3350 (61.8% Fib).
Extension: $3300 (Gann 45° angle).
Swing Targets:
Weekly: $3300 (Wave (iv) target).
Monthly: $3200 (38.2% retracement of entire bull run).
6. Ichimoku Kinko Hyo
Intraday (4H)
Cloud (Kumo): Price below Kumo (bearish).
Tenkan-sen: $3390 (flat, resistance).
Kijun-sen: $3375 (support).
Chikou Span: Below price (confirms bearish momentum).
Swing (Daily)
Cloud: Thick cloud resistance at $3400–$3420.
Tenkan/Kijun: Bearish crossover at $3390.
7. Indicators
Intraday
RSI (14): 68 (4H) → Overbought; divergence at highs.
Bollinger Bands: Price tagging upper band ($3400); contraction signals volatility.
VWAP: $3380 (acting as dynamic resistance).
Moving Averages:
50 SMA: $3350 (support).
200 EMA: $3300 (major support).
Swing
Daily RSI: 72 (overbought, divergence).
Weekly BB: Upper band at $3420 (resistance).
Monthly VWAP: $3200 (major support).
200 WMA: $3100 (long-term bull support).
Synthesized Forecast
Intraday (Next 24H)
Bearish Scenario (High Probability):
Trigger: Break below $3390 (1H close).
Targets: $3350 (T1), $3300 (T2).
Timeline: 8–12 hours (UTC+4 10:00–14:00).
Bullish Scenario (Low Probability):
Trigger: Sustained close above $3400.
Target: $3420 (Gann 90° angle).
Swing (1–4 Weeks)
Bearish Scenario:
Targets: $3300 (Wave (iv)), $3200 (38.2% retracement).
Timeline: 5–10 trading days.
Bullish Scenario:
Trigger: Close above $3420.
Target: $3450 (Gann 180° angle).
Intraday
Entry: Short at $3390–$3400 (stop-loss above $3410).
Targets: $3350 (T1), $3300 (T2).
Risk-Reward: 1:3 (20-point risk, 60-point reward).
Confirmation: 1H close below $3390 + RSI <50.
Swing
Entry: Short at $3400 (stop-loss above $3420).
Targets: $3300 (T1), $3200 (T2).
Risk-Reward: 1:4 (20-point risk, 80-point reward).
Confirmation: Daily close below $3390 + Ichimoku bearish crossover.
For those interested in further developing their trading skills based on these types of analyses, consider exploring the mentoring program offered by Shunya Trade.
(world wide web shunya trade)
I welcome your feedback on this analysis, as it will inform and enhance my future work.
Regards,
Shunya.Trade
world wide web shunya trade

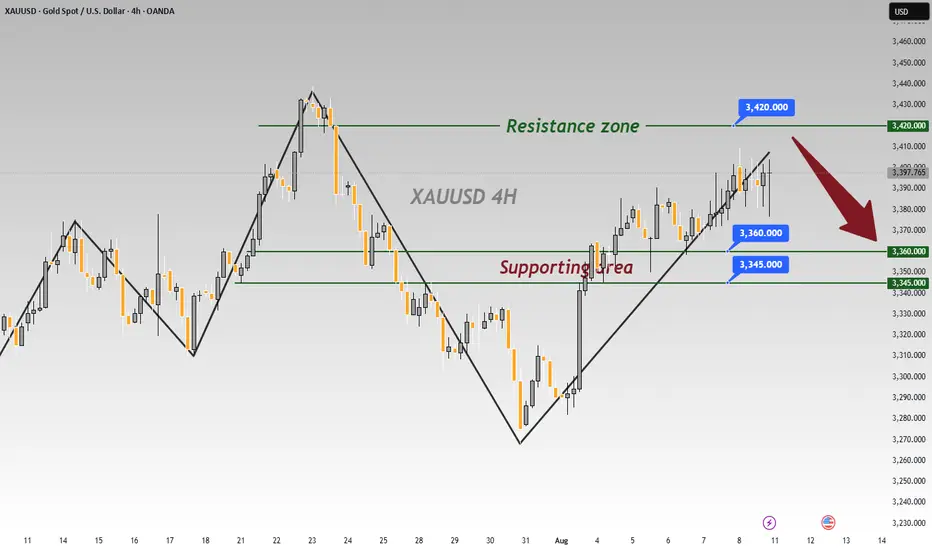
Gold fluctuates repeatedly. How can we avoid detours?Gold currently lacks sustained bullish momentum. The monthly chart has formed four consecutive upper shadows, indicating significant market pressure at high levels. Bulls are hesitant to take risks and lack the appetite for aggressive action, leading to a typical volatile pattern of rapid rises and equally rapid declines in gold prices. Yesterday's price action further confirmed this pattern. Although gold prices briefly reached a new high after bottoming out and rebounding, they were unable to consolidate above that level and subsequently retreated rapidly. Currently, the 3380-3390 area has become a key short-term resistance level, but repeated attempts to retest it have led to heavy selling pressure. Meanwhile, the 3370 area, a trading-intensive zone, poses significant downside risks for gold if it breaks below it, potentially extending the range to 3355-3340. Technically, resistance is concentrated in the 3380-3390 area, while support lies at 3355-3340. Short-term volatility is largely locked within this range. We recommend maintaining a volatile strategy of buying high and selling low.
Regarding trading strategies, we recommend placing short positions in batches within the 3375-3390 area, targeting 3360-3345. Pay attention to position control and stop-loss settings during this process. If the price rebounds to the support area and stabilizes, consider short-term long positions to flexibly respond to the intraday rhythm.
GOING Long On Gold (XAUUSD)Today we are setting pending orders instead of taking direct market executions because we need price to reach a specific level before entering a trade.
Our current bias is based on where the New York session opened and where price is likely to reach first. From yesterday we observed strong bullish candles from the New York session open with price rallying from around 3350.02 to 3389.4.
Now price has corrected itself but the overall trend remains bullish. According to the Session Directional Momentum concept we are setting pending buy orders at the low of the previous one hour candle.
Looking back there is a strong support level at that region which has been breached twice but remains valid. Price tapped that level again before the New York session opened today which indicates mitigation.
We are expecting price to return to that zone before taking off again with a projected move of at least 250 pips for the day.

XAUUSD BUY IDEA • Clear POI Identified:
Price is approaching a well-defined Point of Interest (POI) around 3,347–3,355. This zone aligns with prior demand and a potential entry point for institutions.
• Short-Term Weakness → Potential Reversal:
The market structure shows a retracement phase after a strong bullish impulse. The retrace is likely targeting discount levels within the POI.
• 50 EMA Confluence:
The 50 EMA (gray line) is rising and converging toward the POI, adding confluence for bullish continuation.
• Anticipated Reaction:
Expectation is for price to tap the POI, form an intraday reversal pattern, then continue upward toward higher liquidity zones.
⸻
🧠 Smart Money Perspective:
• Accumulation → Expansion:
Price may currently be accumulating orders before the next expansion leg.
• Low-Risk Entry Zone:
The POI offers a potential low-risk buy zone with stop-loss below the 3,347 region.

Go long on the pullback and head straight to new highs!Gold fell back and stabilized at 3345 yesterday, and continued to rise during the US trading session, reaching a high of 3385. The overnight daily line closed positive again, which is in line with our expectations, so there is still room for growth. We will continue to take a bullish approach today. In the 4H cycle, the Bollinger opening is in the stage of large volume, and the consecutive positive lines are rising steadily based on the moving average. The support below is 3370-3360, and the intraday watershed is at 3360. The operation is mainly to go long on pullbacks. First look at the pressure of the 3385 high point. If it breaks, continue to look at 3395 and 3410.
Gold operation suggestion: go long on gold around 3370-3360, and look at 3385 and 3400.

XAUUSD – Uptrend Remains DominantLast week, rumors that the U.S. would impose a 39% tariff on gold imports from Switzerland triggered strong buying, pushing prices above the $3,400 resistance level. Although the White House denied the news, prices only saw a slight pullback before quickly rebounding, indicating buyers remain in control.
On the H4 chart, XAUUSD is holding firmly above the $3,339–$3,345 support zone, with nearby resistance at $3,401. Technical patterns suggest the price may retest support before continuing higher toward $3,430–$3,450. As long as $3,339 remains intact, the medium-term uptrend stays intact.

GOLD 15M BEARS IN CONTROLGold done the damage of LIQUIDITY GRAB AND SL HUNTING, now MONEY PEOPLE ready to dump this.
I took 15m sell as seen on the chart, Lets hope works before we close this FRIDAY
GOOD LUCK

Hidden secrets amidst gold volatility
💡Message Strategy
The current gold price is primarily supported by the following fundamental factors:
First, US President Trump signed an executive order imposing an additional 25% tariff on Indian imports, bringing the cumulative tariff rate to 50%. Meanwhile, the market expects Japanese goods to face an additional 15% tariff. This series of policies has fueled concerns about global economic uncertainty, significantly increasing market demand for safe-haven assets and benefiting gold.
Second, recent weak US economic data, including last Friday's weaker-than-expected non-farm payroll data and Tuesday's subdued ISM services PMI, have reinforced expectations of a Federal Reserve rate cut this year.
Furthermore, the US dollar has remained under pressure, weakening against major currencies to a more than one-week low. Since gold is priced in US dollars, a weaker dollar has increased purchasing power in non-US markets, indirectly pushing up gold prices.
Despite the overall optimistic tone in the equity market, the upward trend in risky assets has not dampened gold's momentum, indicating that market sentiment has not yet returned to a risk-on, and gold continues to serve as a core safe-haven asset.
📊Technical aspects
Looking at the two-hour chart, gold prices have been trading in a volatile consolidation pattern since rebounding from a low of $2,955. They are currently trading above the middle Bollinger Band ($3,340) and approaching the upper Bollinger Band ($3,430).
The Bollinger Bands are showing signs of convergence, indicating a temporary contraction in volatility, which could be a precursor to a potential breakout. A subsequent breakout above the upper Bollinger Band on larger volume would signal a "Bollinger Band squeeze + breakout" pattern, potentially testing the previous high of $3,430.
If gold breaks through the 3440 line with strength, then gold will continue to challenge the 3500 integer mark.
💰Strategy Package
Long Position:3365-3375,SL:3350,Target: 3400-3430

When Ego Takes Over, Your Account Pays the Price Revenge Trading – When Ego Takes Over, Your Account Pays the Price 💔
Traders, be honest…
How many times have you taken a painful SL, and before you could even breathe, your finger was already clicking “Buy/Sell” without a second thought?
In your head: “I’ll get it back right now… the market can’t do this to me!”
And then…
🔻 A candle goes straight against your position.
🔻 SL beeps again.
🔻 Your account balance drops faster than your mood.
That’s Revenge Trading – it sounds fierce, but in reality, it’s just an emotional storm pulling you further away from shore.
1️⃣ The Sweet but Deadly Psychological Trap
After a loss, your brain refuses to accept reality. It pushes you into the “must recover immediately” mode.
You throw discipline out the window – no setup, no plan.
You increase your lot size recklessly – “Just one win and I’ll be back.”
And… the market doesn’t care if you’re mad or not.
The danger is, at that moment, you’re no longer trading with logic — you’re trading with a wounded ego.
2️⃣ The Downward Spiral
Lose one trade → frustration.
Jump into a revenge trade → bigger lot size.
Lose again → account drains faster.
Emotions spiral out of control → random clicking.
Account blown.
It’s like standing at the edge of a cliff — you could step back and be safe… but you jump, thinking there’s a cushion down there.
3️⃣ How to Cut the Revenge Trading Cycle Before It Eats You Alive
Step away from the charts immediately after a losing streak — go for a walk, exercise, do something unrelated to trading.
Set a daily/weekly loss limit (e.g., -2R) and stick to it.
Journal your emotions after each trade to spot when revenge impulses start creeping in.
Trade smaller when you return — the goal now is to recover your mindset, not your money.
Remind yourself: “The market will always be here. My capital and mental state won’t wait for me.”
4️⃣ MMF’s Note to You
Revenge trading is not strength — it’s weakness in disguise.
It doesn’t help you beat the market; it just helps the market beat you faster.
Keeping a cool head is what keeps a trader alive in the long run.
