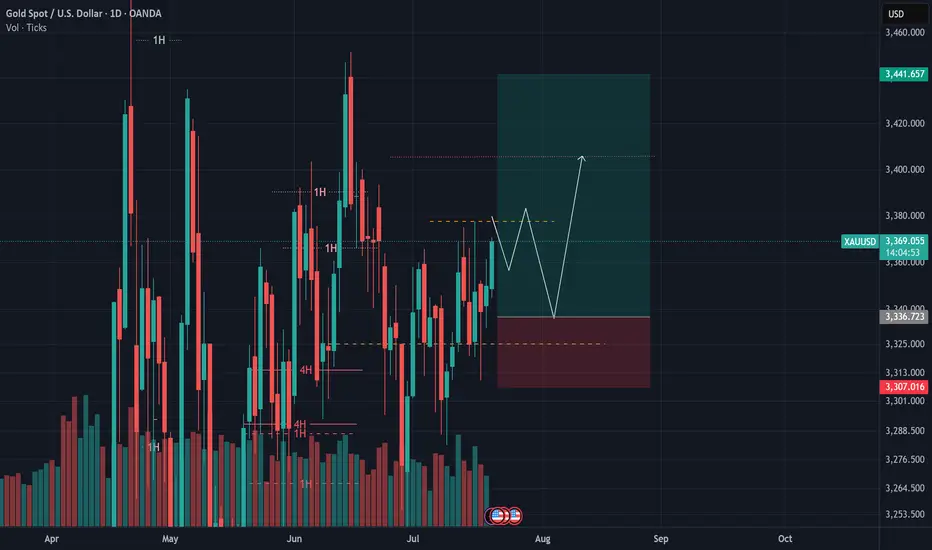
Gold Analysis – July 20, 2025In our previous updates, we highlighted the 3350–3360 zone as a critical resistance that could trigger a pullback toward the 3200 level.
📉 Over the past week, price tested this zone multiple times, and each time we saw a sharp rejection of 400–500 pips.
This behavior clearly indicates that liquidity has been absorbed in this area, and short sellers have likely hit their targets.
📈 Now, the market dynamics are shifting.
With sellers exiting and the zone losing its bearish pressure, we could be looking at the beginning of a new bullish leg. The first key resistance on the upside is 3400.
⚠️ However, considering the number of high-impact events expected this week, I personally prefer to wait for a low-risk entry closer to 3320–3330 rather than chasing the move early.
Stay alert — this week could bring high volatility and major trend moves.
XAUUSD trade ideas
Gold next target According to analysis Gold next target around 3377 /3400 possible move next week if you satisfied with analysis you play

XAUUSD buy when touched the black trendlinethis is a high possible scenario which means the Gold will still be on a bullish cycle

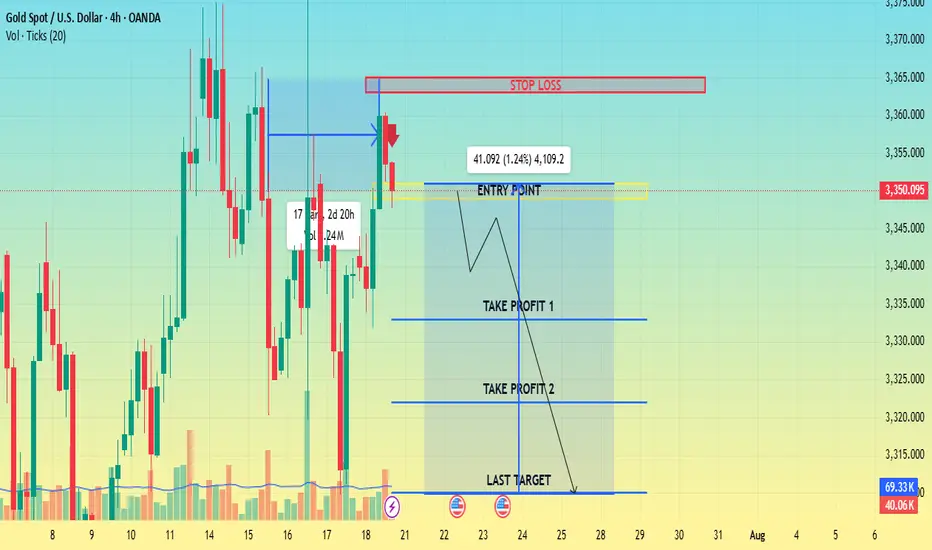
CHECK XAUUSD SIGNAL READ CAPTAIN
Entry Point: Around 3351.000 3349.000
Stop Loss: Around 3365.000
🎯 Target Levels
Take Profit 1:
3333.000
Take Profit 2:
3322.000
last target
3310.000
Gold Buying back every dip as expectedTechnical analysis: Interesting turn of events regarding the Short-term as Gold crossed the second Resistance (and is Trading #2 points above it currently) on the Hourly 4 chart and crossed aswell #6-session High’s, which may result as an traditional Buying back every dip (as I advice Traders to Buy every local Low’s recently / what I am doing personally), offering no Selling continuation patterns to Trade by. This is an additional Short-term Buying signal similar to cycle of February #2 - #5 #2020 parabolic rise, which ended as an correction. Hourly 4 chart is under much needed consolidation (current dip Buying) near #3,352.80 benchmark and is again leaning on Bullish side rather than Neutral, as Gold is still ignoring strong Overbought levels following mostly losses on DX (taking strong hits), turning as well Oversold in the process as global Geo-politics dust rises, and as long those guide the market sentiment, further uncertainty on Gold is inevitable and Buying underlying trend will persist.
My position: I repeat / keep in mind that Swing Trading is not possible currently on Gold as Scalp / in & out aggressive orders are key to make excellent Profits (I will advise when to continue with Swing orders). I have firstly Bought Gold on #3,324.80 throughout yesterday’s session and closed my set of Buying orders on #3,332.80 Resistance and since I knew news may push Gold down, had Buy limit on one of my possible reversal points of #3,307.80 / #3,310.80 / #3,313.80 which worked nicely. This was one of many brilliant weeks of Scalping the market. Keep in mind that #MA50 on Daily chart plays big role currently and whether Gold establishes it as an Support or Resistance, major trend will continue. I do believe it will be established as an Support and that’s why I maintain my #3,377.80 and #3,400.80 Medium-term Targets. Enjoy the Profits!

Gold energy buildup supported at 3308The Gold remains in a bullish trend, with recent price action showing signs of a continuation breakout within the broader uptrend.
Support Zone: 3308 – a key level from previous consolidation. Price is currently testing or approaching this level.
A bullish rebound from 3308 would confirm ongoing upside momentum, with potential targets at:
3387 – initial resistance
3400 – psychological and structural level
3435 – extended resistance on the longer-term chart
Bearish Scenario:
A confirmed break and daily close below 3308 would weaken the bullish outlook and suggest deeper downside risk toward:
3290 – minor support
3268 – stronger support and potential demand zone
Outlook:
Bullish bias remains intact while the Gold holds above 3308. A sustained break below this level could shift momentum to the downside in the short term.
This communication is for informational purposes only and should not be viewed as any form of recommendation as to a particular course of action or as investment advice. It is not intended as an offer or solicitation for the purchase or sale of any financial instrument or as an official confirmation of any transaction. Opinions, estimates and assumptions expressed herein are made as of the date of this communication and are subject to change without notice. This communication has been prepared based upon information, including market prices, data and other information, believed to be reliable; however, Trade Nation does not warrant its completeness or accuracy. All market prices and market data contained in or attached to this communication are indicative and subject to change without notice.

CONFLUENCE We might see GOLD using this confluence to go up. Gold is currently trending upwards, therefore we might see it continuing with that trend

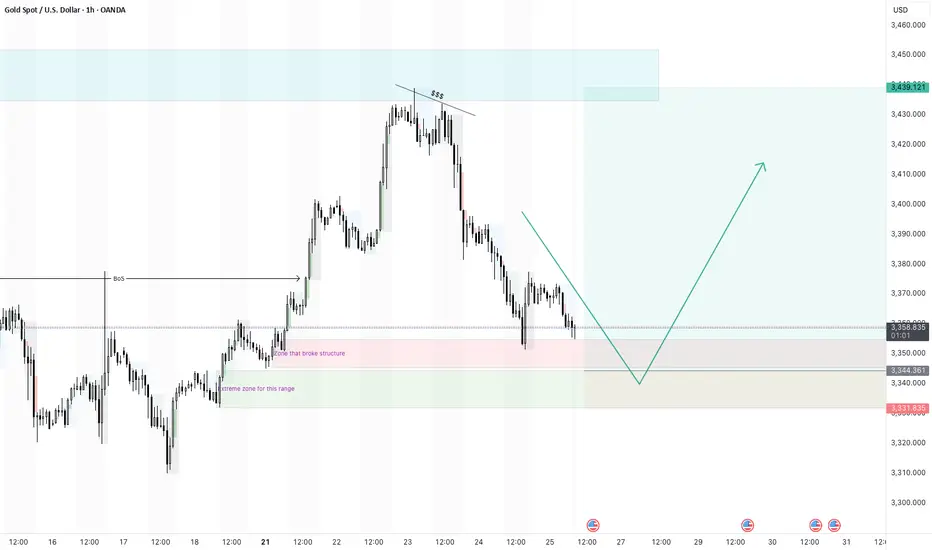
XAUUSD continuation of larger bullish move - 25/7/25Gold did touch the higher timeframe supply zone and pull back. It is now at a point where i am looking for a pivot to form to continue bullish.
I did place a buy limit trade at the extreme zone that started the break of structures.
i will wait a see if it drops and triggers or forms a pivot at the 4H zone that broke structure.
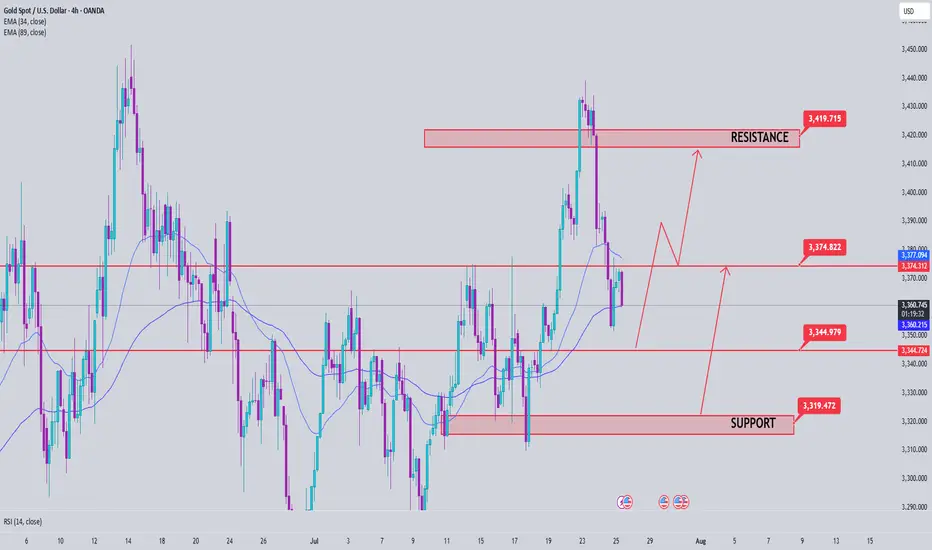
Gold price analysis July 25Gold Analysis – D1 Uptrend Still Maintains, But Needs New Momentum
Yesterday’s trading session recorded a D1 candle closing above the Breakout 3363 zone, indicating that buying power in the US session is still dominant. This implies that the uptrend is still being maintained, although the market may need a short-term technical correction.
In today’s Tokyo and London sessions, there is a possibility of liquidity sweeps to the support zone below before Gold recovers and increases again in the New York session.
Important to note:
The uptrend will only be broken if Gold closes below the 3345 zone on the D1 chart.
In this case, the 3320 level will be the next support zone to observe the price reaction and consider buying points.
For the bullish wave to continue expanding towards the historical peak (ATH) at 3500, the market needs stronger supporting factors, which can come from economic data or geopolitical developments.
📌 Support zone: 3345 – 3320
📌 Resistance zone: 3373 – 3418
🎯 Potential buy zone:
3345 (prioritize price reaction in this zone)
3320 (in case of breaking through 3345)
🎯 Target: 3417
GOLD SELLGold price bears retain control amid fading safe-haven demand, rebounding USD
US President Donald Trump announced late Tuesday that his administration had reached a trade deal with Japan. Furthermore, reports that the US and the European Union are heading towards a 15% trade deal boost investors' confidence and weigh on the safe-haven Gold price for the second straight day on Thursday.
The markets do not expect an interest rate cut from the US Federal Reserve in July despite Trump's continuous push for lower borrowing costs. In fact, Trump has been attacking Fed Chair Jerome Powell personally over his stance on holding rates and repeatedly calling for the central bank chief's resignation.
Moreover, Fed Governor Chris Waller and Trump appointee Vice Chair for Supervision Michelle Bowman have advocated a rate reduction as soon as the next policy meeting on July 30. This keeps the US Dollar depressed near a two-and-a-half-week low and could offer some support to the non-yielding yellow metal.
Traders now look forward to the release of flash PMIs, which would provide a fresh insight into the global economic health and influence the safe-haven commodity. Apart from this, the crucial European Central Bank policy decision might infuse some volatility in the markets and drive the XAU/USD pair.
Meanwhile, the US economic docket features Weekly Initial Jobless Claims and New Home Sales data, which, in turn, would drive the USD and contribute to producing short-term trading opportunities around the commodity. Nevertheless, the fundamental backdrop warrants caution for aggressive traders.
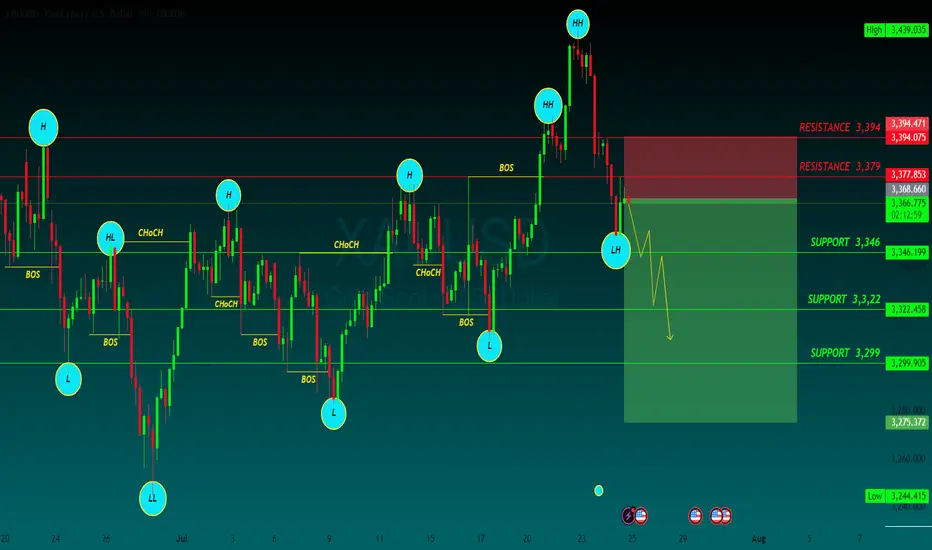
SUPPORT 3,346
SUPPORT 3,322
SUPPORT 3,399
RESISTANCE 3,394
RESISTANCE 3,379
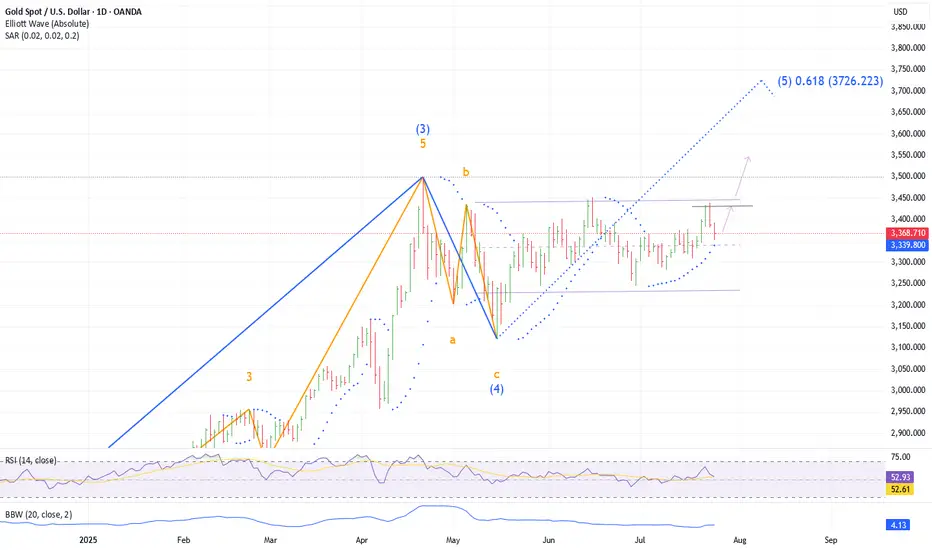
Gold Set to Continue RallyExpect gold to snap back to 3431 and likely much higher in the next day or two. Any recent gold downdraft was quick, prices shooting back up to the highs. Long term trends are too powerful. While Gold could drop down to the 3100 range completing an A-B-C for Wave 4, I think we are already in wave 5. A quick move to 4,000 would stun many but for those who see much much higher prices, 4,000 just might be a level to start getting people's attention.
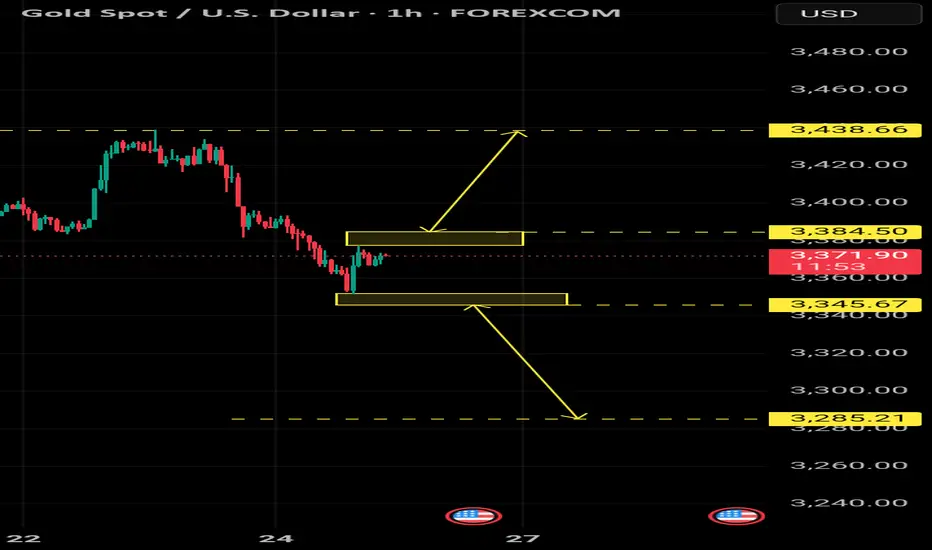
Quick Gold AnalysisYellow areas are important in case of a breakout.
Break the upper area, targeting the last weekly high.
Break down, targeting the level shown on the chart.
Gold Trading Strategy | July 24-25✅ Fundamental Analysis
🔹 Diminishing Safe-Haven Demand: The reduction of U.S.–Japan auto tariffs to 15% and progress in U.S.–EU tariff negotiations have weakened gold’s appeal as a safe-haven asset. Risk-on sentiment has led to capital flowing into risk assets, squeezing safe-haven positions.
🔹 Speculative Positioning Adjustment: COMEX gold net non-commercial long positions have remained above 200,000 contracts for three consecutive weeks. The crowding level of leveraged positions has reached the 82nd percentile, increasing the likelihood of technical profit-taking, thereby adding to market volatility.
🔹 Long-Term Supportive Factors: Ongoing central bank gold purchases and U.S. dollar credit concerns (e.g., political pressure on the Fed by Trump) may limit the downside potential in gold prices.
✅ Technical Analysis
🔸 After failing to break higher, gold has pulled back toward the lower boundary of its trading range, and short-term weakness is gradually emerging. On the daily chart, the 5-day moving average ($3385) has crossed below the 10-day moving average, forming a bearish crossover, indicating weakening short-term momentum.
However, medium- and long-term moving averages remain in a bullish alignment, suggesting that the broader trend is still intact.
🔸 MACD: A bearish crossover has formed above the zero line, with increasing red bars on the histogram, signaling that the correction may not be over.
RSI: Currently at 52, within the neutral zone—no oversold signal yet, implying further downside room.
Bollinger Bands: Price remains above the middle band (approx. $3340), but the narrowing band width suggests a potential breakout is approaching.
🔴 Resistance Levels: 3375–3380 / 3397–3403
🟢 Support Levels: 3350–3355 / 3335–3340
✅ Trading Strategy Reference:
🔻 Short Position Strategy:
🔰Consider entering short positions in batches if gold rebounds to the 3375-3380 area. Target: 3360-3350;If support breaks, the move may extend to 3340.
🔺 Long Position Strategy:
🔰Consider entering long positions in batches if gold pulls back to the 3335-3340 area. Target: 3360-3370;If resistance breaks, the move may extend to 3380.
🔥Trading Reminder: Trading strategies are time-sensitive, and market conditions can change rapidly. Please adjust your trading plan based on real-time market conditions. If you have any questions or need one-on-one guidance, feel free to contact me🤝

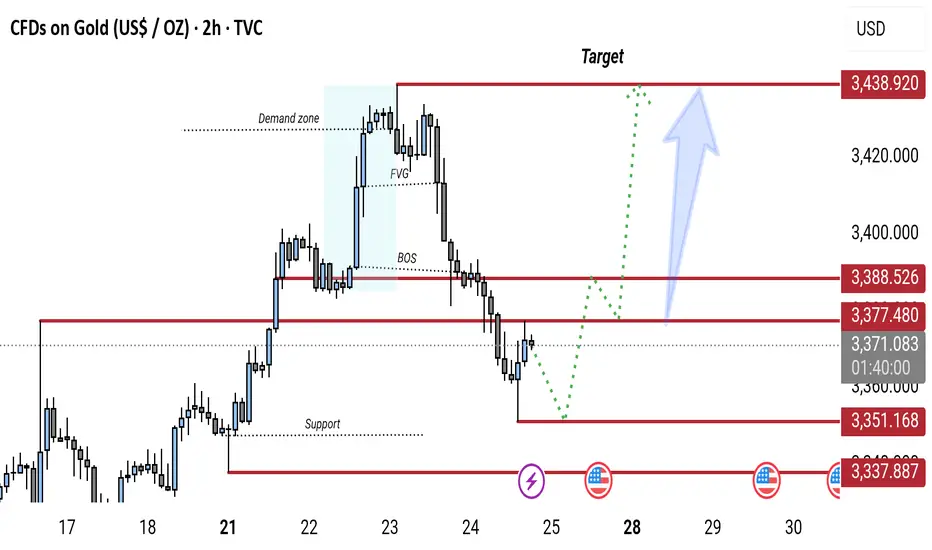
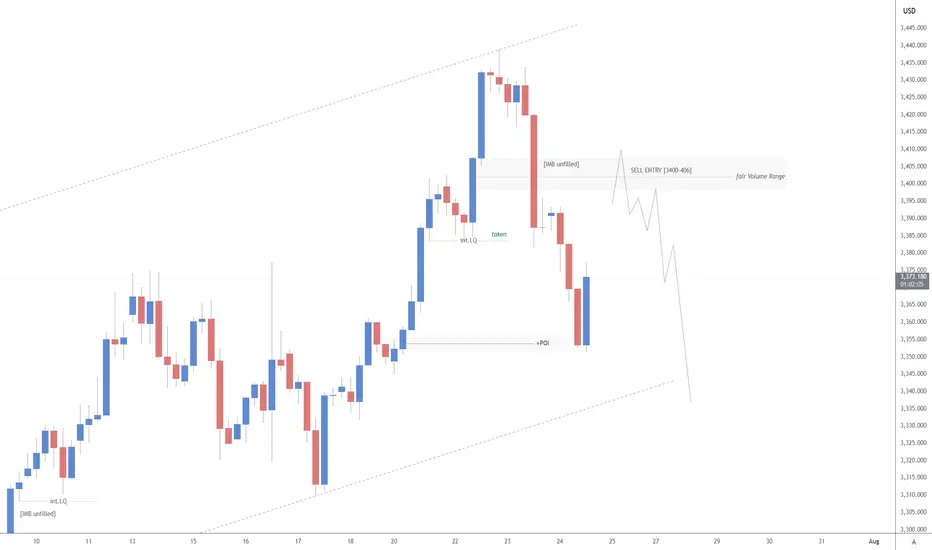
Gold 2H Chart: Bullish Reversal Expected from Key Support ZoneGold (XAU/USD) 2H chart shows a bearish break of structure (BOS) followed by a pullback toward a key support zone (around 3,337–3,351). A potential bullish reversal is expected from this zone, targeting the 3,438 resistance level. The chart highlights a demand zone, FVG (Fair Value Gap), and possible retracement before continuation to the upside.
XAUUSD H4 | SELL 💡Why Gold Pulled Back
- Gold pulled back today after hitting $3439.04, just below resistance at $3451.53. Traders took profits ahead of key Fed and trade headlines. Right now, it’s trading around $3414.48, down 0.50%.
- The dip came after the U.S.-Japan trade deal eased geopolitical tension, cutting safe-haven demand. Plus, U.S. bond yields are climbing (10-year at 4.384%), which adds pressure on gold.
Support is building at $3374.42, with stronger buying interest expected around $3347.97 and the 50-day moving average at $3336.40 — a key level bulls want to defend.
Short-term looks a bit weak, but as long as gold holds above the 50-day MA, the bullish trend remains intact. Longer-term, weakness in the dollar, central bank gold buying, and concerns about Fed independence could push prices higher.
🔍Watching the Fed’s July 29–30 meeting next
GOLD: Target Is Down! Short!
My dear friends,
Today we will analyse GOLD together☺️
The recent price action suggests a shift in mid-term momentum. A break below the current local range around 3,359.59 will confirm the new direction downwards with the target being the next key level of 3,350.22.and a reconvened placement of a stop-loss beyond the range.
❤️Sending you lots of Love and Hugs❤️

Xau/Usd - Gold turn to Bull runGold time to Long..
buy 3364
SL 3361
TP 3377
Xau/Usd Bull Run started

XAUUSD Top-down analysis Hello traders, this is a complete multiple timeframe analysis of this pair. We see could find significant trading opportunities as per analysis upon price action confirmation we may take this trade. Smash the like button if you find value in this analysis and drop a comment if you have any questions or let me know which pair to cover in my next analysis.

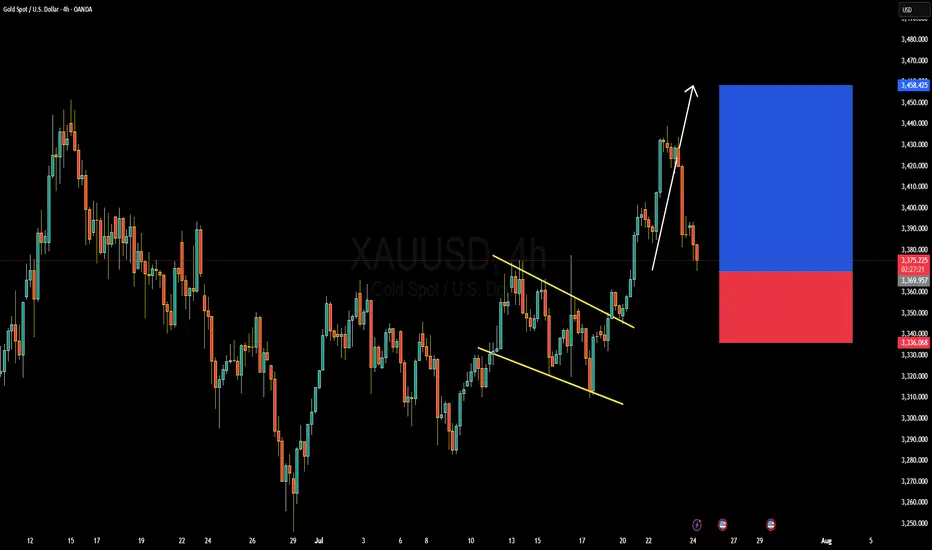
GOLD (XAUUSD) Forming Bullish ContinuationGold (XAUUSD) is currently presenting a strong bullish continuation setup after breaking out of a falling channel on the 4H timeframe. Price action confirmed bullish momentum with impulsive candles following the breakout, and we’re now seeing a textbook retest of the breakout zone around 3,370–3,360, which previously acted as resistance and is now expected to hold as support. The risk-to-reward ratio remains highly favorable, targeting the 3,450–3,460 zone in the upcoming sessions.
From a macro perspective, gold is gaining upside traction as the US dollar weakens amid growing speculation around an upcoming Fed rate cut. Investors are rotating into safe-haven assets as recession concerns resurface, with the market pricing in increased geopolitical tension and slower economic growth forecasts. Real yields are cooling, which typically boosts non-yielding assets like gold. With central bank demand for gold also staying strong, the bullish narrative continues to build.
Technically, momentum remains in the bulls’ favor. RSI is still holding above midline levels, suggesting there’s room for further upside. The current pullback offers a healthy correction within a larger bullish trend. Holding above the 3,360–3,340 support range is key for continuation; a daily close above 3,390 would confirm the next wave toward 3,450 and possibly 3,500 in the medium term.
This is a clear case of momentum following structure. As long as the lower boundary holds firm, I remain bullish on gold with strong conviction. Watch for volume confirmation on the bounce, and trade the trend—momentum is with the buyers.
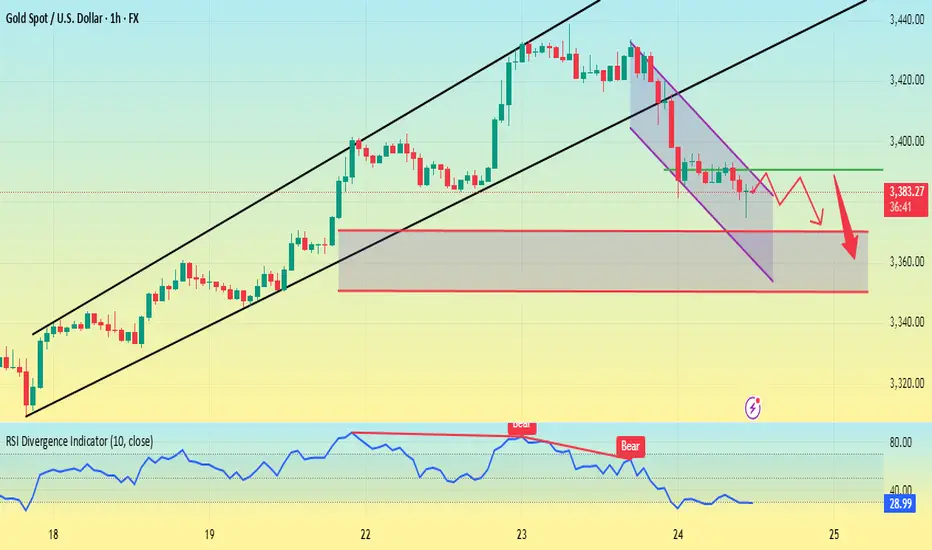
Gold peaked in the short term. Welcome a new trend?The previous rising structure of gold was broken, especially yesterday's rapid decline broke through the previous support of 3385. Although it rebounded slightly, it was difficult to change the adjustment. Yesterday's high point of the US market was at 3396-98 US dollars. Today, the adjustment trend continued. The dividing point between long and short is 3395 US dollars today. Before the price reaches here, do not consider long.
Many traders are confused. Why are there longs one day and shorts the next day? In fact, this is the characteristic of the volatile market. Breaking the key position cannot last. No matter what you think about the market, you must pay attention to the current shape changes. In the volatile market, you should consider the market of the day more, not the long-term direction.
From the 1-hour chart, the gold price rebounded near 3390 and shorted, and the profit range is 3370-3350.
The backup strategy is to break through 3400 and go long, and pay attention to 3415-3425 on the upside.
In other words, look for opportunities to short on a rebound below 3400 today, and adjust your thinking after breaking through the key resistance.
XAUUSDXAUUSD Updated in 15M :
The gold signal is marked on the chart based on the latest price changes and the supply and demand in the market. These points include the entry point, stop loss, and take profit

Long towards 3450.00Bullish Rally continues, Expecting it from 3418 area.
This is not a financial advice. Just my trade idea for small 3 positions
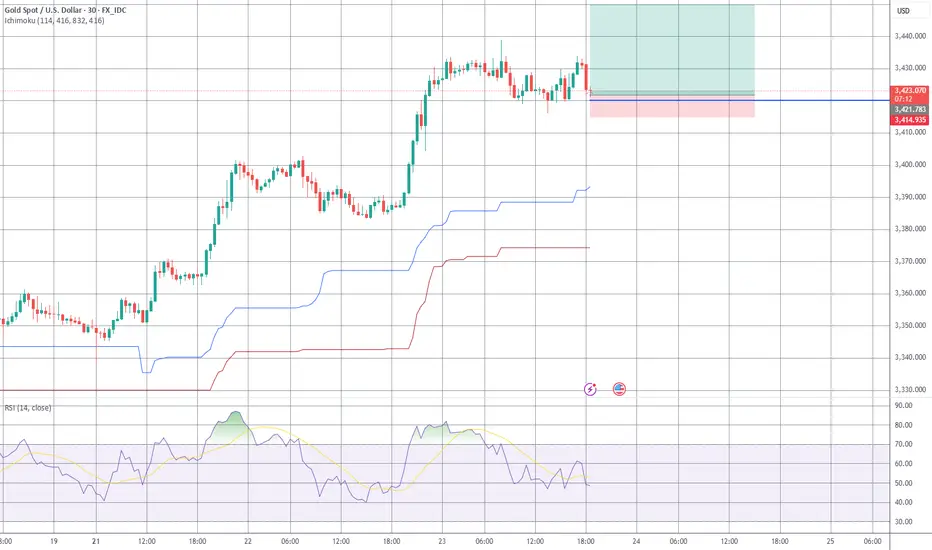
XAUUSD M30 I Bullish Bounce Off the 61.8% Fib Based on the M30 chart analysis, the price is falling toward our buy entry level at 3400.90, a pullback support that aligns closely with the 61.8% Fib retracement.
Our take profit is set at 3426.47, an overlap resistance.
The stop loss is placed at 3377.40, a pullback support.
High Risk Investment Warning
Trading Forex/CFDs on margin carries a high level of risk and may not be suitable for all investors. Leverage can work against you.
Stratos Markets Limited (tradu.com ):
CFDs are complex instruments and come with a high risk of losing money rapidly due to leverage. 66% of retail investor accounts lose money when trading CFDs with this provider. You should consider whether you understand how CFDs work and whether you can afford to take the high risk of losing your money.
Stratos Europe Ltd (tradu.com ):
CFDs are complex instruments and come with a high risk of losing money rapidly due to leverage. 66% of retail investor accounts lose money when trading CFDs with this provider. You should consider whether you understand how CFDs work and whether you can afford to take the high risk of losing your money.
Stratos Global LLC (tradu.com ):
Losses can exceed deposits.
Please be advised that the information presented on TradingView is provided to Tradu (‘Company’, ‘we’) by a third-party provider (‘TFA Global Pte Ltd’). Please be reminded that you are solely responsible for the trading decisions on your account. There is a very high degree of risk involved in trading. Any information and/or content is intended entirely for research, educational and informational purposes only and does not constitute investment or consultation advice or investment strategy. The information is not tailored to the investment needs of any specific person and therefore does not involve a consideration of any of the investment objectives, financial situation or needs of any viewer that may receive it. Kindly also note that past performance is not a reliable indicator of future results. Actual results may differ materially from those anticipated in forward-looking or past performance statements. We assume no liability as to the accuracy or completeness of any of the information and/or content provided herein and the Company cannot be held responsible for any omission, mistake nor for any loss or damage including without limitation to any loss of profit which may arise from reliance on any information supplied by TFA Global Pte Ltd.
The speaker(s) is neither an employee, agent nor representative of Tradu and is therefore acting independently. The opinions given are their own, constitute general market commentary, and do not constitute the opinion or advice of Tradu or any form of personal or investment advice. Tradu neither endorses nor guarantees offerings of third-party speakers, nor is Tradu responsible for the content, veracity or opinions of third-party speakers, presenters or participants.
