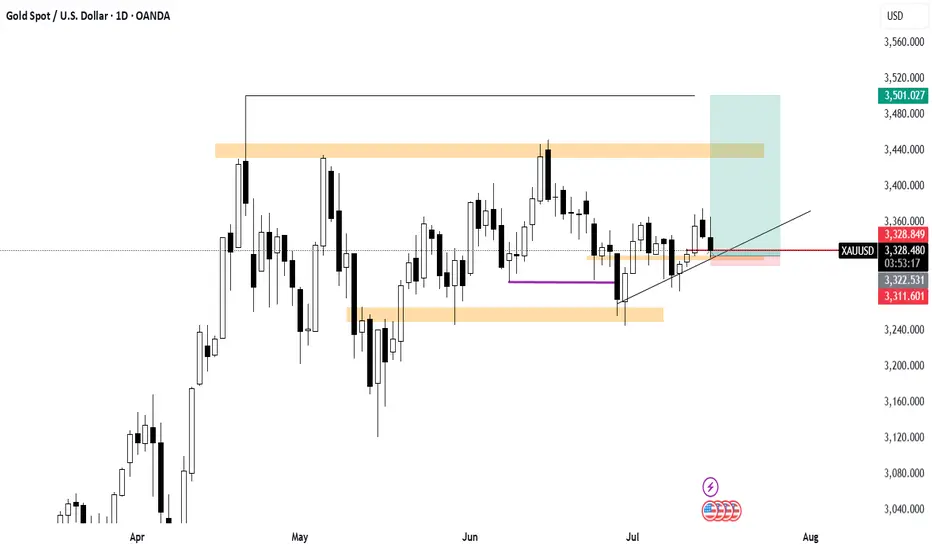
Gold about to hit and form a new all time highfor several weeks gold has been heading up, in a daily timeframe we see Gold heading up. after a retest of the 3321 level we we expect an aggressive to the upside.
we can hold this position for several days and weeks. patience is very crucial here.
XAUUSD trade ideas
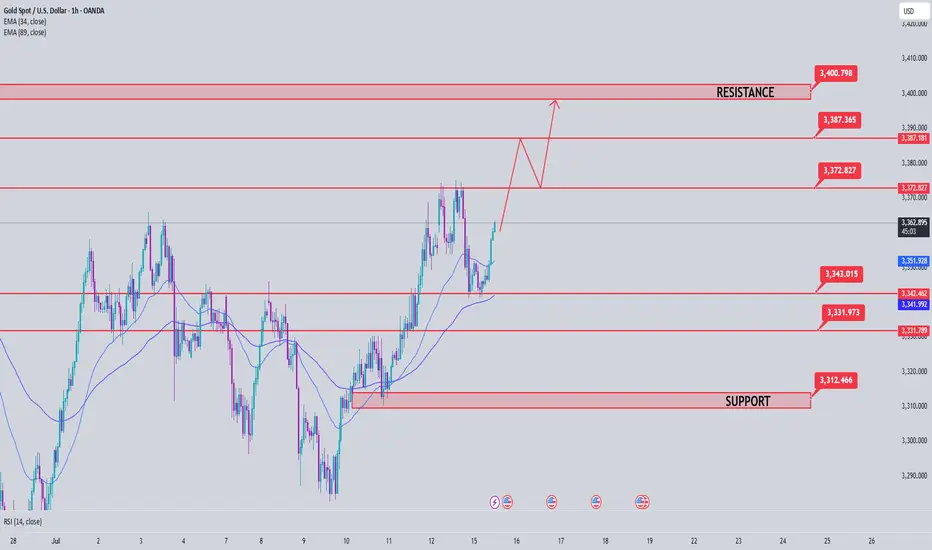
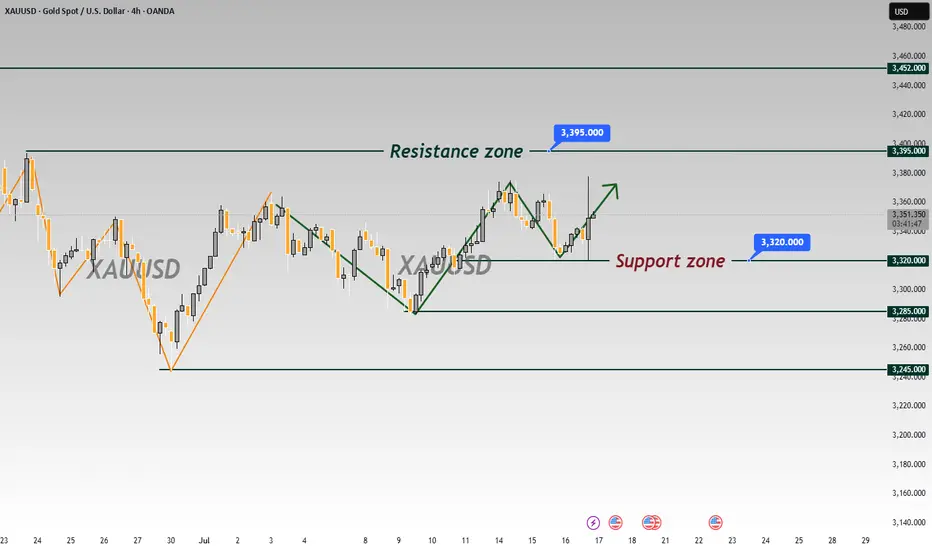
Gold Price Analysis July 15Continued uptrend after touching the 3345 buy zone
As analyzed at the beginning of the week, gold price has touched the buy zone around 3345 and continues to maintain the bullish wave structure, heading towards the 3400 resistance zone.
Currently, if gold breaks the 3373 mark, the uptrend is likely to be further strengthened. At that time, it is not advisable to trade against the trend, especially when the buyers completely control the market.
However, in case gold falls below the 3343 support zone (the resistance level in yesterday's US session), the current uptrend may be temporarily interrupted. At that time, the market will need to form a new momentum to establish the next trend.
🔑 Important price zones:
Support: 3343 – 3330 – 3313
Resistance: 3373 – 3387 – 3400
📌 Trading strategy:
Hold BUY order at 3345, expected target 3400
Activate SELL order if there is a clear price rejection signal at 3373 or 3387 (with confirmation of selling pressure)
SELL at 3400 if the strong resistance zone reacts clearly
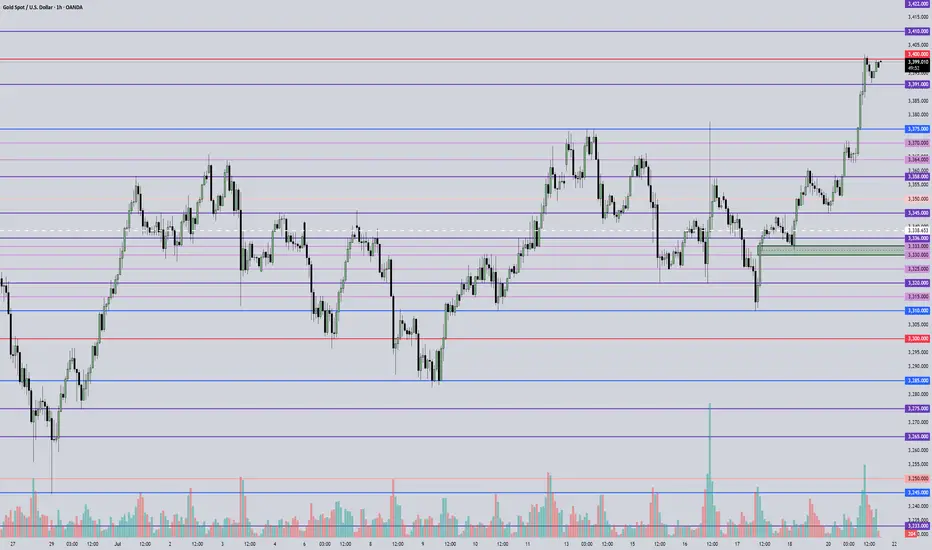
July 22, 2025 - XAUUSD GOLD Analysis and Potential OpportunitySummary:
Bullish momentum is clearly in play — strategy remains to buy on pullbacks as long as key support levels hold.
🔍 Key Levels to Watch:
• 3435 – Resistance
• 3422 – Resistance
• 3410 – Resistance
• 3400 – Psychological level
• 3375 – Support
• 3364 – Support
• 3358 – Support
• 3345 – Strong support
📈 Intraday Strategy:
• SELL if price breaks below 3391 → target 3386, then 3380, 3375, 3370
• BUY if price holds above 3400 → target 3405, then 3410, 3422, 3435
👉 If you find this helpful or traded using this plan, a like would mean a lot and keep me motivated. Thanks for the support!
Disclaimer: This is my personal view, not financial advice. Always use proper risk control.
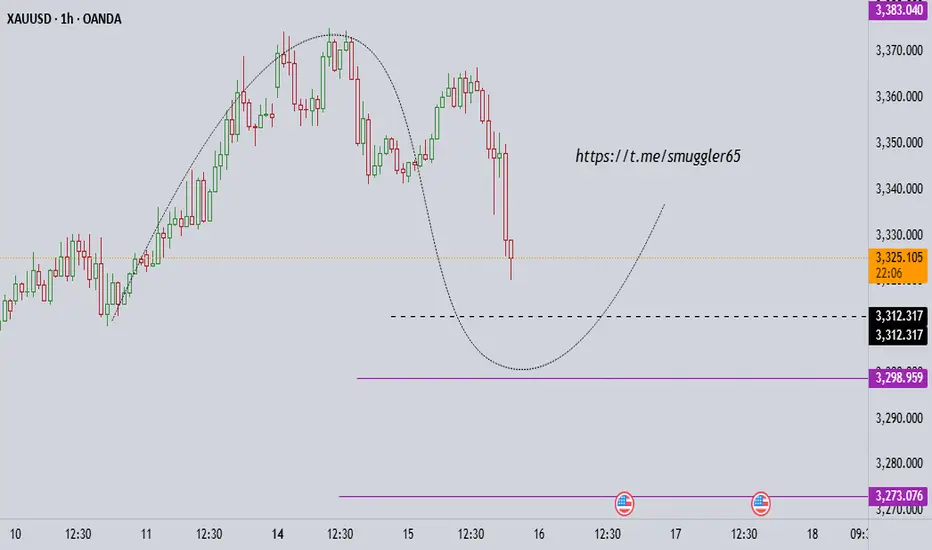
XAUUSD falling back to supportBearish Gold Analysis: Liquidity Sweep & Support Retest
The current price action in gold (XAU/USD) suggests a **bearish pullback** toward a key support level, likely driven by a **liquidity sweep** beneath recent lows before a potential reversal or continuation. Here’s why:
#### **1. Liquidity Sweep Beneath Support**
- The price has declined sharply, breaking below minor support levels (e.g., **3,350.30**) and sweeping the **3,342.71–3,347.82** zone.
- This move likely targeted **stop losses** beneath recent swing lows, a common market-maker strategy to collect liquidity before reversing or extending the trend.
#### **2. Bearish Momentum Confirmation**
- The **+0.34%** uptick appears weak compared to the preceding sell-off, indicating a possible **retest of resistance-turned-support**.
- The **4h exposure** suggests a short-term downtrend, with price rejecting higher levels and failing to hold above **3,350.49 (BUY zone)**.
#### **3. Support Level Retest**
- The next major support sits near **3,342.71–3,340.00**. A break below could trigger further downside toward **3,330.00**.
- If support holds, expect a **bullish reversal** as trapped sellers cover shorts, but failure here confirms bearish continuation.
#### **Key Takeaway**
Gold is **bearish short-term**, with price likely retesting support after sweeping liquidity. Watch for:
- **Break below 3,342.71** → Bearish continuation.
- **Rejection & bounce** → Potential reversal.
Traders should monitor order flow around these levels for confirmation.

Gold (XAUUSD) at Decision Point – Watch $3,320 Closely! Technical Analysis – 4H Chart
Gold is trading within a rising channel, but momentum is weakening. The current price action is testing the lower channel support around $3,320 — a critical level for the next directional move.
🟥 Bearish Scenario:
Break & close below $3,320 could confirm channel breakdown
Target: $3,219 support zone
Bearish engulfing seen on higher timeframe adds pressure
🟩 Bullish Scenario:
If $3,320 holds as support and price bounces back:
Possible move toward upper channel resistance around $3,401
🌍 Fundamental Outlook
Recent CPI data was soft, but no strong bullish push yet
Focus on upcoming U.S. economic releases (employment, PMI, retail sales)
Strong data = Hawkish Fed = Bearish for Gold
Weak data = Dovish Fed = Bullish for Gold

Gold is Moving Sideways – A Potential Triangle Formation?Gold is currently trading in a sideways pattern, potentially forming a triangle consolidation. This type of setup often precedes a strong breakout. At the moment, price action is showing hesitation near key resistance. Traders should wait for a confirmed breakout above the upper boundary of the triangle to validate a bullish continuation.
Patience is key—wait for the breakout before taking action.

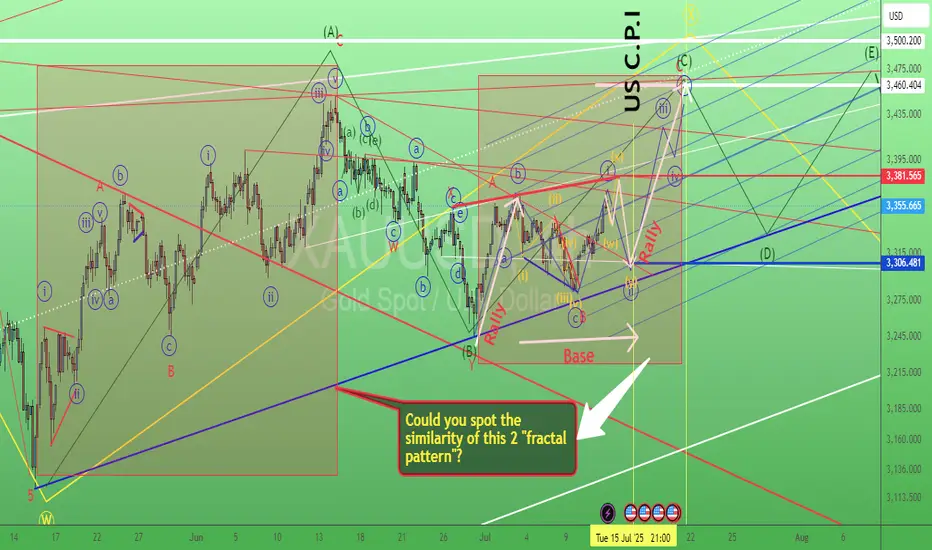
Gold swing trade setup 13/July/25XAUUSD. Based on the latest "speed" development of chart instead of forming a triangle pattern gold probably building a "flat" "Base" before rallying toward 3460 +/- Coming Tuesday US CPI could be the "trigger" for launching the rocket..
XAUUSD Analysis : Gold's Bullish Comeback + Target📊 Chart Overview:
Gold has shown a technically strong structure on the 4-hour time frame, respecting multiple layers of support, while slowly shifting momentum in favor of buyers. What stands out most in this chart is the parabolic curve formation at the bottom, labeled the "Black Mind Curve Support" — a key psychological zone that has guided price action back to the upside.
Let’s walk through the key elements and why this current setup deserves your attention:
🧠 1. Black Mind Curve Support – Bullish Base Formation:
This curved structure at the bottom is no ordinary pattern. It reflects gradual accumulation and buyer dominance, often seen in textbook rounded bottom formations. The market printed multiple higher lows along this curve, suggesting a deliberate and patient entry by smart money.
Whenever price touched this curve, it found strong demand — a clear sign that the bulls are defending their territory.
🧱 2. Channel Support + SR Interchange – Historical Demand:
Zooming into the left side of the chart, you’ll notice how price dropped into a converging zone where a descending channel support intersected with a historical support/resistance (SR) level. This confluence created a high-probability buy zone — the very origin of the current bullish wave.
This channel breakout also represents a structural shift, marking the beginning of bullish control.
🔁 3. Major SR – Interchange Zone:
One of the most critical areas in this chart is the Major SR Interchange zone, where former resistance was broken and later retested as support. This is a classic support-resistance flip — the type of zone institutional traders watch closely.
This level currently acts as a launchpad for bulls, reinforcing bullish structure and offering low-risk long opportunities when respected.
⚔️ 4. Minor BOS (Break of Structure):
Recently, the price broke above a short-term lower high, indicating a minor bullish break of structure. This is confirmation that momentum has shifted in the short term. Such BOS events are powerful signals, especially when backed by curve support and SR flips.
This also paves the way for the price to push into the next liquidity pocket above.
🧭 5. Central Zone – 50% Equilibrium:
The horizontal line drawn around the $3,330 level marks the central 50% zone — the midpoint of this entire price range. This acts as a natural equilibrium zone where buyers and sellers usually fight for control.
Price is now trading above this zone, giving the upper hand to bulls. Holding above the 50% line increases the probability of continuation to higher resistance levels.
🧨 6. Target Area – "Next Reversal Zone":
Looking ahead, the $3,370 – $3,380 range is labeled as the Next Reversal Zone. This is where sellers previously stepped in and rejected price hard. However, if momentum remains strong and bulls can push price into this zone again, we might witness either:
A sharp pullback (if bearish reaction occurs), or
A major breakout above toward the $3,400 key resistance (if buyers overpower).
This is the zone to watch for either short-term profit taking or potential trend continuation setups.
📌 Key Technical Levels:
Immediate Support: $3,330 – $3,315 (Central + Retest Zone)
Major Support: $3,290 (Mind Curve Base)
Short-Term Resistance: $3,370 – $3,380 (Reversal/Reaction Zone)
Bullish Continuation Target: $3,400+
📒 Conclusion & Strategy Insight:
This chart presents a textbook bullish reversal setup with clean structural progression:
Price formed a rounded base
Broke out of previous range resistance
Retested multiple key SR zones
Now targeting liquidity above
The bulls are in control as long as the price remains above the curve and the major SR zone. A retracement into $3,330 could offer an ideal long entry, targeting the $3,370–$3,380 zone with tight risk.
✅ Suggested Trading Approach:
Buy Opportunities: On pullbacks toward $3,330–$3,315 with confirmation
Sell Watch: Near $3,375–$3,380 if bearish divergence or strong rejection appears
Invalidation: Break and close below $3,290 curve support
🧠 Final Thoughts:
Gold continues to build a strong bullish base. The parabolic nature of the support curve suggests rising demand. As long as support holds, the bulls may take price to fresh highs in the coming days.
Keep an eye on how price behaves around the Next Reversal Zone — that will reveal whether this bullish rally is ready for a breakout or a cooldown.

XAUUSD ANALYSISOn gold currently we're analyzing 2H time frame. As we know that current trend was bullish. At this stage, I'm anticipating a retracement towards my Point of Interest (POI), where I’ll be looking for a clear bullish confirmation, ideally through candlestick structure or solid price action. Only upon receiving that confirmation will I consider entering a buy position.
This outlook is based on the higher time frame structure. For now, I'm observing patiently to see how price unfolds. Until the market sweeps the SSL liquidity, I will remain on the sidelines no entries until that key liquidity level has been taken. Confirmation is key.
Always use stoploss for your trade.
Always use proper money management and proper risk to reward ratio.
#XAUUSD 2H Technical Analysis Expected Move.

XAU AnalysisIf the price reaches the lower pips and confirms, you can consider buying for 300 to 500 pips.
Technical & Fundamental Analysis — XAU/USD🟢 Why Gold Is Moving Up (Bullish Context)
📈 Technical Reasons:
Price formed a Higher Low (HL) and recently broke above short-term internal resistance, suggesting bullish structure resumption.
Buyers defended the support zone (~3,340) multiple times — indicating demand absorption.
Potential range breakout setup if price closes firmly above 3,400, targeting 3,420+.
🌍 Fundamental Reasons:
Speculation on Fed rate cuts later this year despite hawkish talk is creating underlying support for gold.
Inflation hedge narrative still attracts long-term buyers.
Geopolitical uncertainty or central bank accumulation (China, BRICS) may provide tailwinds.
Weakness in U.S. equity markets or a surprise miss in upcoming data could accelerate gold’s upside.
🧠 Final Note:
Current bullish move = speculative push inside a range, possibly targeting liquidity above resistance.
A failed breakout at the top = ideal short opportunity.
A confirmed breakout above 3,400 with strong fundamentals = shift to bullish bias.

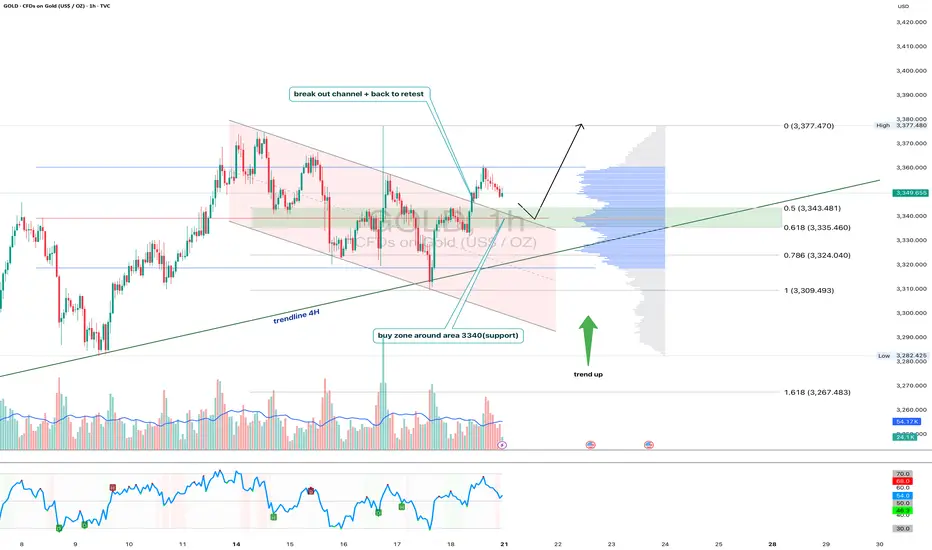
Gold 1H - Retest of channel & support zone at 3340After breaking out of the falling channel, gold is currently retesting its upper boundary — now acting as support. The 3340 zone is particularly important as it aligns with the 0.618 Fibonacci level and high volume node on the visible range volume profile. The price action suggests a potential bullish rejection from this area. With both the 50 and 200 EMA below price on the 1H, the short-term trend remains bullish. The 4H trendline further supports this setup. RSI is cooling off near the neutral zone, leaving room for another leg higher toward the 3377 resistance zone. If 3340 fails, 3324 (0.786 Fibo) becomes the next line of defense. Until then, the structure remains bullish following the successful breakout and retest of the channel.
Gold (XAUUSD): A Perfect Storm - Multi-Decade Pattern
Gold is currently at one of the most significant inflection points in decades. A powerful, multi-year bull run is showing clear signs of exhaustion, and technical signals across four distinct timeframes are aligning to suggest a major corrective move is imminent. This analysis lays out the evidence from the multi-decade macro view down to the immediate intraday catalyst, culminating in a high-probability scenario.
The foundation for this thesis begins on the highest possible timeframe. On the multi-decade chart, gold's price action has been supported by a parabolic curve, or "dome," originating from the 1970s. While the price is currently extended from this support, suggesting a need to cool off, the fundamental picture has shifted. Unprecedented central bank accumulation and a surge in public awareness are providing a powerful underlying bid, making a full reversion to the distant parabolic curve unlikely in the current environment.
Zooming into the monthly chart reveals a classic and powerful warning sign: a severe multi-year bearish divergence. While the price of gold has been pushing to new all-time highs, key momentum indicators have been making lower highs. This shows that the underlying strength behind the immediate rally is fading, making the trend fragile and highly susceptible to a reversal.
This weakness is now being confirmed on the daily chart. The 20-day and 50-day moving averages are on the verge of a bearish crossover, a classic technical signal that confirms short-term momentum has officially shifted from bullish to bearish, adding another layer of evidence that a correction is taking hold.
The entire scenario culminates on the 8-hour chart, where we find the immediate trigger. Gold is coiling into a tight symmetrical triangle, with the apex converging perfectly with the timing of Fed Chair Jerome Powell's speech on Tuesday, July 22nd. This is a "moment of truth" setup where the speech will act as the catalyst to release the pent-up energy and force a decisive breakout.
Given the context of persistent inflation, the baseline expectation is for a hawkish speech from Chairman Powell, which is fundamentally bearish for gold in the short term. This makes a downside break the most likely scenario. The primary and most logical target for this healthy correction is the major breakout zone and multi-year Fibonacci 1.0 support level at ~$2,800. This level represents a necessary reset, not the start of a bear market. A pullback to this zone would shake out leverage and establish a formidable base for the coming capital rotation event, where gold is expected to enter a hyperbolic, stratospheric upward trajectory. The strong fundamental floor provided by central banks and retail interest should hold this ~$2,800 level firmly.
Disclaimer: This is a technical and fundamental analysis for educational and discussion purposes only and does not constitute financial advice. Please conduct your own due diligence.

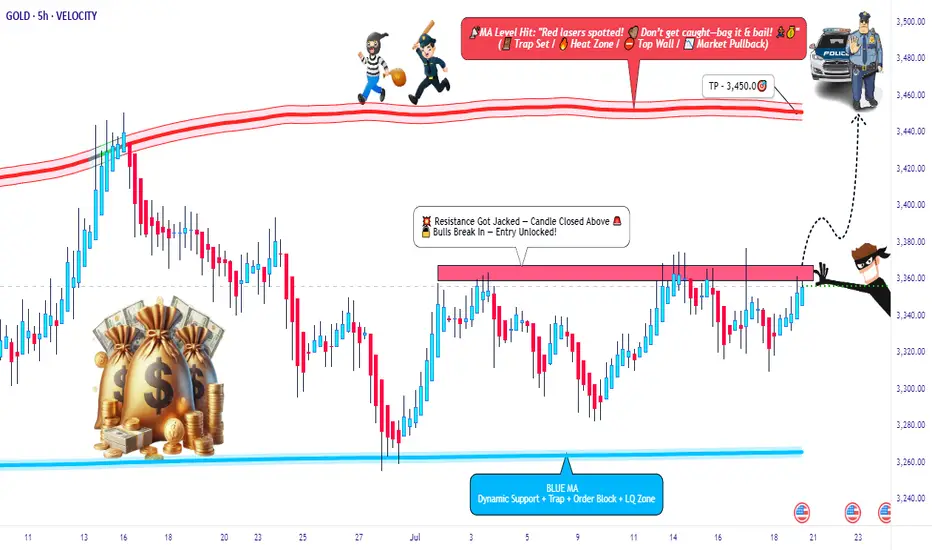
XAU/USD Breakout Playbook – Rob the Market!🚨💰 GOLD HEIST IN MOTION! | XAU/USD Thief Trading Strategy (Breakout Edition) 🏴☠️
🧠 Strategic Mindset | Not Your Average Chart Talk
Yo Market Bandits & Pip Hunters – welcome to the underground playbook!
This isn't your grandma’s chart breakdown – it’s a Thief Trading Takedown on XAU/USD (Gold), where we’re not chasing the market… we’re outsmarting it.
THE MASTER PLAN: Enter Like a Ghost, Exit Like a King 👑
📍 ENTRY POINT – The Break-In Begins!
💥 Breakout Level: Watch for 3370.00 resistance to crack – this is our green light.
🕵️♂️ Entry Style:
• Buy Stop above MA resistance zone (fast & clean)
• OR Buy Limit near swing low zones after confirmation pullback (sniper entry)
🧠 Thief Tip: Wait for the breakout to happen. No orders, no SL before it. Patience is profit.
🔄 Layer the Entry:
• Deploy DCA (Dollar Cost Averaging) or scaling entries with precision
• Build positions like stacking cash bags — smart, silent, and calculated
🛡️ PROTECT THE LOOT – Stop Loss Logic 💣
📍 SL Guide: 3310.00 (4H swing low – update as price structure evolves)
🔥 SL ONLY comes after breakout. Set it too early? That’s how you get caught.
⛔ No pre-breakout orders. No early SL. Stay invisible till it's go time.
🎯 THE ESCAPE – Profit Like a Phantom 🚀
💸 Take Profit: 3450.00
📉 Scalpers: Trail SL as price pushes – never give back stolen pips
🌀 Swing Traders: Monitor resistance layers – don’t let the bulls turn on you
🧭 CONTEXT – Why This Setup?
🔍 Macro Snapshot:
• Trend: Neutral/Bullish Lean
• Influencers: COT reports, geopolitical tension, dollar flows
• Sentiment Shifting – watch the herd, but don’t run with it
🗞️ News Risk: Don’t get wrecked by events! Avoid entries during high-impact news.
🚨 Trailing SL is your best weapon during volatility.
⚡ POWER UP THE CREW – Support the Movement
💬 Drop a comment, hit the 🔥 like button, and share with your trading gang
More Thief Trading blueprints coming soon – bigger breakouts, cleaner setups
⚠️ STAY SHARP, THIEVES!
This ain't financial advice – it’s an outlaw’s edge on the market.
Trade smart. Risk well. Protect the bag.
🏴☠️ XAU/USD GOLD HEIST IN PROGRESS... Join the Movement. Let’s Rob the Market.
#XAUUSD Buy 3342.06#XAUUSD Buy 3342.06
Stoploss 3333.06
Breakeven 3343.06
TakeProfit 1: 3352.06
TakeProfit 2: 3362.06
TakeProfit 3: 3372.06
TakeProfit 4: 3382.06
TakeProfit 5: 3392.06
Trade at your own risk
Protect your capital
The Wizard 🧙♂️ FDT
Fri 18 Jul ‘25 08:00 AM NGN

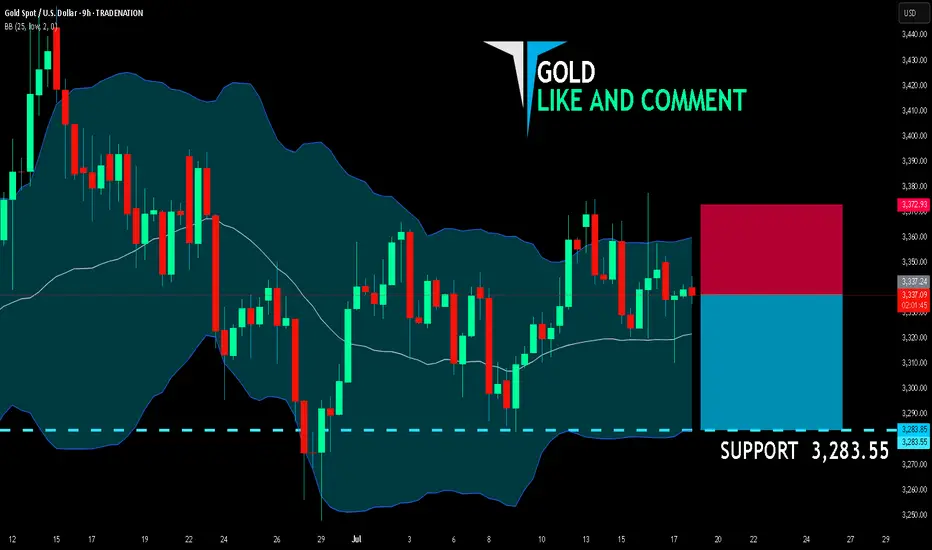
GOLD SELLERS WILL DOMINATE THE MARKET|SHORT
GOLD SIGNAL
Trade Direction: short
Entry Level: 3,337.24
Target Level: 3,283.55
Stop Loss: 3,372.93
RISK PROFILE
Risk level: medium
Suggested risk: 1%
Timeframe: 9h
Disclosure: I am part of Trade Nation's Influencer program and receive a monthly fee for using their TradingView charts in my analysis.
✅LIKE AND COMMENT MY IDEAS✅
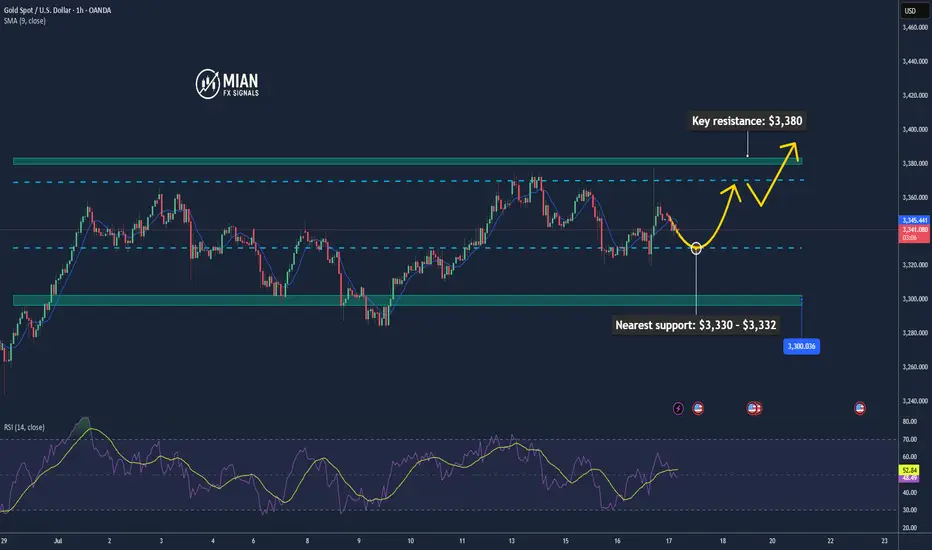
Gold Continues Short Term Uptrend📊 Market Overview:
💬Gold is currently trading around $3,340 – $3,352/oz, down slightly (~0.25%) on the day but still consolidating near recent highs around $3,500.
🌍 Geopolitical tensions (trade wars, Middle East conflicts) and strong central bank gold purchases continue to support long-term demand.
📅Markets are awaiting key U.S. inflation data and Fed signals, which may trigger volatility in the short term.
📉 Technical Analysis:
🔺Key resistance: $3,360 – $3,380, with the psychological zone at $3,400–$3,420.
🔻Nearest support: $3,330 – $3,332, followed by a firmer zone at $3,300–$3,326 (based on Fibonacci and moving averages).
• EMA/MA:
✅ Price is trading above the 50-day MA ($2,862), confirming a medium-term uptrend.
⚠️ While no specific EMA 09 data is noted, current price action suggests bullish momentum.
• Momentum / Candlestick / Volume:
📏RSI (14) is near 50–55, signaling positive momentum without being overbought.
🔄MACD is slightly negative but the overall structure remains bullish.
📌 Outlook:
Gold may continue to rise in the short term if it holds above the $3,330–$3,332 support zone, with potential to test resistance at $3,360–$3,380 and possibly revisit the $3,400 level.
A break below $3,330 could open the path toward deeper support around $3,300.
💡 Suggested Trading Strategy:
SELL XAU/USD: 3,367–3,370
🎯 TP: 40/80/200 pips
❌ SL: 3,374
BUY XAU/USD: 3,330–3,333
🎯 TP: 40/80/200 pips
❌ SL: 3,326
XAUUSD critical area, both sides are possiblecorrection waves are always complicated and messy often changes direction too often, goes up and down in a wide range either triangle, wedge or some sort of zigzag, internal waves usually goes as abc, wxy, wxyxz type of correction waves and it may seem like ended many times in the subwaves. so often confused with many other ideas. i believe correction continues yet criticals levles to watch 3307-3419 brake side will determen the future of gold.
my 3250 target already achieved but i expect another one, shor term targets 3250-3205 mid term targets 3119-3070-3050
daily candle body above 3420 invalidates short ideas.

Gold: Bull-Bear Swings & Today's Trade Tips + AnalysisAnalysis of Gold News Drivers:
During the U.S. session on Wednesday (July 16th), spot gold surged sharply and is currently trading around 3,370 🚀. Trump stated that tariff letters will soon be sent to small countries, with rates likely slightly above 10%, providing safe-haven support for gold prices 🛡️.
Gold prices fell 0.5% on Tuesday, closing at 3,324.68, barely holding above the 55-day moving average of 3,222 📉. Earlier, the U.S. June CPI increase hit its highest level since January, pushing the U.S. dollar index to a nearly three-week high, while U.S. Treasury yields also climbed to a six-week peak, pressuring gold prices ⚖️. The dollar index has risen for four consecutive trading days, hitting a high of 98.70 on Tuesday, the highest since June 23rd 🆙. A stronger dollar makes dollar-denominated gold more expensive for investors holding other currencies, thereby weighing on gold prices 💸.
However, the market largely interprets the dollar's recent rally as a technical adjustment rather than a reversal of the long-term trend 🔄. Despite short-term pullbacks in gold prices, market sentiment has not fully turned pessimistic 😐. While gold is currently in a consolidation range since mid-May, uncertainties surrounding tariff policies may offer support 🔀. Overall, the long-term outlook for gold remains optimistic, with sustained market focus on tariff issues expected to drive a rebound in gold prices in the future 📈
Accurate signals are updated every day 📈 If you encounter any problems during trading, these signals can serve as your reliable guide 🧭 Feel free to refer to them! I sincerely hope they'll be of great help to you 🌟 👇
Up then Down!Hello all. price probably (Probably) will make a new High then Collapse to break the Low. be happy (wink)

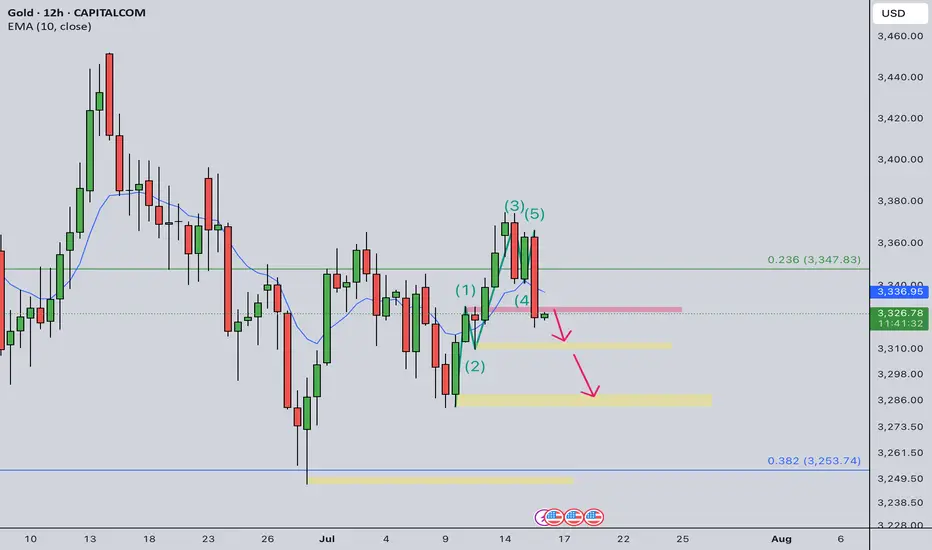
Gold Intraday Trading Plan 7/16/2025As expected yesterday, gold did dropped heavily although not from 3355 but 3365. It broke 3340 support and 3325 support. In 12hrly TF, its wave has just completed and started a new one.
I will sell from 3330 today and initial target is 3310, final target is 3380.
XAUUSD Technical And Fundamental AnalysisGold prices rise in early trade as fears of a global economic slowdown due to widening trade tensions reinforce the precious metal's role as a defensive hedge and safe-haven asset. Futures are up 0.5% to $3,382.70 a troy ounce, their highest level in three weeks, after President Trump said he will charge a 30% tariff on goods from the EU and Mexico--two of the U.S.'s largest trading partners. Meanwhile, investors await key U.S. economic data later this week, including CPI inflation figures. "Should the June data report higher-than-expected inflation, this could prompt a selloff in U.S. Treasuries and increase demand for the U.S. dollar this week," says Aaron Hill, chief analyst at FP Market.

GOLD BUY M15 Gold (XAU/USD) 15-Min Chart Analysis – July 15, 2025
The price is currently trading around 3,352, having recently shown a Change of Character (CHoCH) indicating a potential bullish reversal. After a drop from the recent highs, price is now approaching a highlighted demand zone (purple box) between approximately 3,342 – 3,349, which could act as a strong support area.
Trade Setup:
Buy Zone: Inside the purple demand zone (approx. 3,342 – 3,349)
Stop Loss (SL): 3,342
Target (TP): 3,365
Key Levels:
Resistance Levels:
3,355
3,360
3,365 (Target)
3,370 (Potential extension)
Support Levels:
3,349
3,342 (Stop Loss)
3,341 (Strong Low zone)
Expectation:
If price reacts positively from the demand zone and holds above the support, we can expect a bullish move towards the target of 3,365, breaking through intermediate resistance levels.
