XAUUSD Weekly Outlook – Bullish Setup AheadGold continues to show bullish momentum after holding above the recent breakout zone. Price is currently consolidating just above the $3,380 - $3,390 support area (green zone), which aligns with a key demand level from previous market structure.
🔍 Technical Outlook:
Support Zone: $3,380 - $3,390 (demand area)
Resistance Target: $3,437 (previous swing high)
Trend: Bullish bias remains intact as long as price holds above support.
Plan: A potential retracement into the green demand zone could provide a fresh buying opportunity targeting the $3,437 resistance.
📈 Trade Setup:
Entry: $3,385 – $3,390 (on pullback to demand zone)
Stop Loss (SL): $3,370
Take Profit (TP): $3,437
💡 Projection:
We anticipate a short-term pullback into support, followed by a bullish continuation towards the $3,437 level. A clean breakout above this resistance could open doors for further upside.
⚠ Disclaimer: This is not financial advice. Trade at your own risk and always follow your risk management rules.
#XAUUSD #Gold #TradingView #PriceAction #Forex #Commodities #TechnicalAnalysis
XAUUSD trade ideas

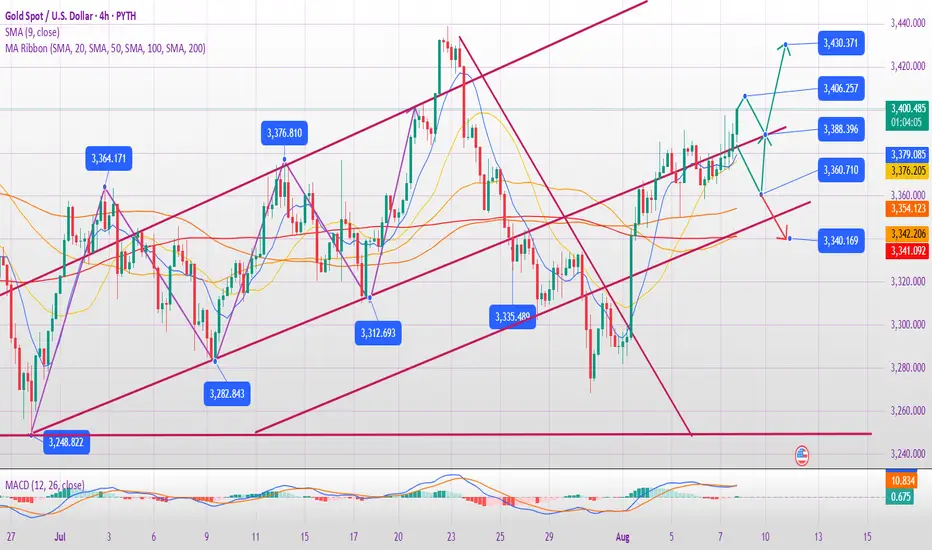
Will gold successfully break through 3400 on August 8th?
I. Daily Analysis
Overall Trend: Gold remains at the end of a converging triangle, with upper resistance at 3406 and lower support at 3360, awaiting guidance on the direction of a breakout.
Key Moving Average: The 5-day moving average at 3372 remains a short-term bullish-bearish watershed. If it holds above this level, the market will likely remain volatile and bullish. If it breaks, a pullback to 3360 or even lower is possible.
K-line Pattern: Wednesday's daily close was a small bearish candlestick, but the upward trend was not broken. Thursday's Asian session saw a high of 3398 before retreating, indicating psychological pressure at the 3400 level.
II. 4-Hour and Short-Term Analysis
Support and Resistance:
Key Support: 3370-3373 (61.8% retracement level), 3365 (morning low, bullish defensive level).
Key Resistance: 3398-3400 (psychological barrier), 3406 (upper limit of the triangle). Technical Indicators:
MACD is still in a correction phase, requiring short-term volatility to digest momentum.
The 4-hour middle line at 3371-72 resonates with the daily 5-day moving average. If the price stabilizes at this level during the European session, there is still potential for an upside move in the US session.
III. Today's Trading Strategy
1. Long Strategy (Primarily Buy on Dips)
Entry Point: If the price stabilizes after a pullback to 3370-3373, try a small buy position with a stop-loss below 3365.
Target: 3395-3400. A breakout could target 3406 or even higher.
2. Short Strategy (Approach with caution)
If the price falls below 3365, it could weaken. Short-term short positions could be targeted at 3360-3350.
If the suppression at 3406 is effective, you can try shorting, with a stop loss above 3410 and a target at 3390-3380.
3. Breakout Strategy
If the price breaks above 3406, follow the trend and buy long positions, targeting 3420-3430. Breaking below 3360: It may open up downward space, with the target at 3340-3330.
IV. Key Timeframes
European Market Trend: If 3370 holds, a second surge higher is possible in the US market; if pressure persists at 3398, a pullback to 3370-3365 is possible.
Focus on the US market: US economic data and the trend of the US dollar. If the US dollar continues to be weak, gold may be supported.
V. Risk Warning
Currently at the end of the triangle, be wary of false breakouts. It is recommended to operate with a light position and maintain strict stop-loss orders.
If 3365 falls, adjust your strategy to avoid blindly bottom-fishing.
Gold consolidates ahead of growthGold has encountered strong resistance and excessive pressure from bears. Before continuing its growth, the price may test the local trend support or the support zone of 3371–3358.
Scenario: bullish trend, but the price lacks the potential and consolidation to overcome resistance at 3400-3410. In this case, MM may form a trap to collect liquidity, such as a false breakdown of support, and only then move up.

XAU / USD 30 Minute ChartHello traders. We had news earlier, and I am currently looking for scalp positions. I marked my areas of interest on the chart. Looking to grab some pips while we have volume happening. I will update in a bit. Big G gets my thanks. Be well and trade the trend.

Gold range fluctuates, continue to be bullish after falling back
Yesterday, gold prices initially declined before rising, continuing the previous day's deep V-shaped rebound pattern. Prices came under pressure at 3378 in the Asian and European sessions, weakening and fluctuating downward. The European session continued its downward trend, breaking through 3360 to reach around 3358 before stabilizing and recovering. In the US session, bullish momentum continued to rebound, breaking through 3380 before falling back under pressure and weakening. The price finally closed around 3367, closing in a mid-yin-yang pattern of volatile adjustment. Overall, gold prices retreated again to test support near 3360, effectively establishing a wide range of bullish and bearish fluctuations in the short term. Further gains are expected today, challenging above 3390. However, given the recent volatile pattern of gold prices, it's not advisable to chase gains or sell losses in the short term. If your current trading is not ideal, I hope Yulia can help you avoid investment pitfalls. We welcome your communication.
According to the 4-hour chart, support is currently focused around 3365-60, while resistance is expected around 3395-3400. We should maintain a high-short-low-buy cycle within this range. In the intermediate range, we should be cautious in following orders and patiently wait for key entry points. I will provide detailed trading strategies during the trading session, so please stay tuned.
Gold Trading Strategy:
Go long on gold if it retraces to the 3360-65 level, with a stop loss at 3353 and a target of 3390-3395. Continue holding if it breaks below this level.
XAUUSD Gold Intraday 07 Aug (Short) XAUUSD Intraday Setup
Short Setup in between 3382–3392 Resistance
Price is approaching a key supply zone between 3382 and 3392, where previous equal highs were swept. This area may act as a reversal zone.
Looking for bearish confirmation within this range to initiate short positions.
Stop Loss: 3397
Target: Previous swing lows around 3352–3355
Bearish bias remains valid as long as price stays below 3397.

The powerful perspective that can change your attitude to losseWant to know a secret? You can actually change how you react to losing trades—just by thinking differently. Cool, huh?
🫣 Here’s a hard truth that every trader needs to accept: every trade is a potential loss.
Losses are an inevitable part of the game.
No matter how good your setup is, no matter how much you’ve prepared—there will always be trades that don’t work out.
Trading is already emotionally challenging as it is. But if you get stuck obsessing over one single trade, it becomes so much more emotionally exhausting. You start evaluate yourself after every outcome. And that’s not a sustainable way to trade.
Let’s be honest: the result of one trade doesn’t say much about your actual trading performance.
It’s only over time—after a series of trades—that you can honestly evaluate how you’re doing.
If we want to reduce some of the emotional storms that come with trading, we need a different strategy. A more compassionate one. One that gives us the space to breathe, recover and grow.
So how do we do that? By practicing a shift in perspective.
A shift that’s actually rooted in neuroscience. It’s about broadening your perspective.
👉 Broadening your perspective means reminding yourself:
"This is just one of many trades I’ll take in my trading journey."
That’s it. Simple. No complicated strategy. Just a small shift in thinking that helps you regulate your emotions.
Whether you’ve just taken a loss or feel doubt creeping in before entering a trade—say it to yourself (out loud if you want!): “This is only one of many trades I will experience.”
And here comes the science part:
🧠 When you broaden your perspective like this, the brain responds. It decreases arousal in the amygdala—your brain’s “panic button.”
At the same time, it activates the prefrontal cortex—the part of your brain responsible for rational thinking, impulse control and analysis.
Put simply: you become more emotionally balanced—and more able to view the market objectively.
🤔 Why is that important?
Because when your amygdala calms down, the risk of emotionally driven mistakes decreases.
The fear becomes less intense.
And in trading terms: you’ll be better at cutting losers faster and holding on to winners longer.
🪄 Will this shift magically erase all tough emotions? No. The emotions will still be there—just not as loud.
And isn’t it more motivating to remind yourself that you are not defined by a single trade?
You’re defined by your overall journey. Your effort. Your long-term consistency.
💡Pro Tip:
Next time you feel hesitation—even with a solid setup, or after closing a losing trade
👉 Try this reminder:
“This is only one of many trades I will execute during my career.”
Let it soften the inner storm.
Happy, compassionate trading! 💙
/ Tina the Trading Psychologist

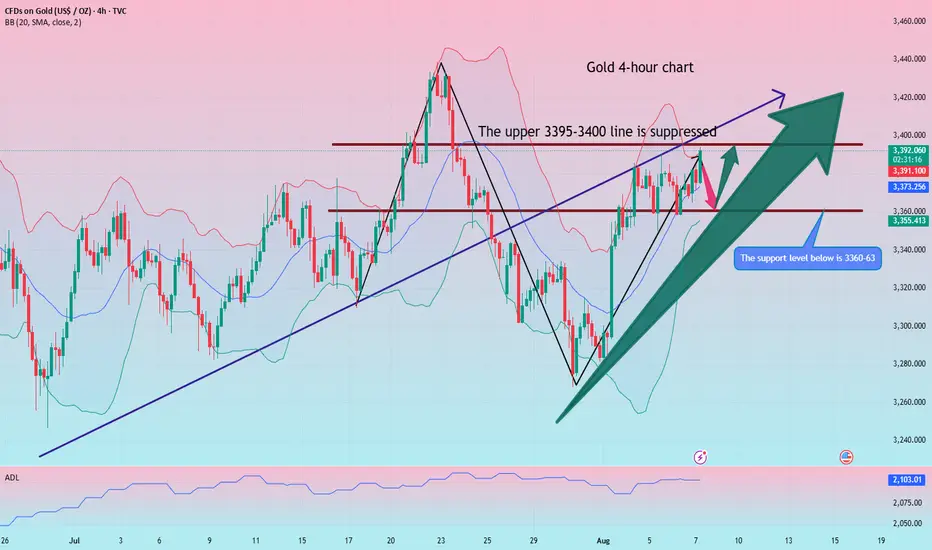
The bullish trend remains unchanged, seize the opportunityAfter today's opening, gold continued the bullish trend of yesterday. Judging from the daily line, gold has continued to rise, and it may only be a matter of time before it reaches a higher level. Judging from the 4H chart, the technical indicators are dead cross and shrinking, and the flexible indicators are repairing upward. The short-term middle track support is around 3372, and the upper side pays attention to the short-term pressure of 3395-3405. If the European session fails to effectively break through the short-term resistance, it will give the opportunity to test the 3380-3370 support again. If it is not broken, you can consider continuing to go long.
OANDA:XAUUSD

GOLD TRADE ANALYSIS – MISSED ENTRY & NEW OUTLOOK📈 GOLD TRADE ANALYSIS – MISSED ENTRY & NEW OUTLOOK 💡
07 August 2025 | XAUUSD | 15m TF
In the recent price action on Gold, I spotted a clean mSS (market structure shift) confirming bearish intent after liquidity sweep. Unfortunately, my first ideal entry near the supply zone was missed as price barely tapped the POI before delivering a significant drop.
However, the market offered a second chance — forming another bearish order block before diving into the discounted zone (demand area). This ultimately led to a strong bullish reaction, confirming accumulation and paving way for the rally we've just seen.
🔍 Current Expectation:
Price has now cleared internal liquidity and is pushing toward $3,396 — an important external liquidity level. I'm watching for:
A possible reaction/rejection from this high
Or a clean break and retest for continuation to $3,410+
🧠 Lesson:
Always remember, missed entries are part of the game. The key is not chasing — but re-aligning with the structure and waiting for fresh confirmations. Gold continues to respect key imbalances and reacts well around session opens.
📊 Let’s see how price reacts around this high. Any signs of weakness could offer a new intraday short opportunity.
#XAUUSD #GoldAnalysis #SmartMoneyConcepts #OrderBlocks #MarketStructure #ForexTrading #LiquiditySweep #TradingPsychology #RiskManagement #PriceAction #ForexNigeria #GoldTraders #FXSetup

XAUUSD rises due to tariff wars and weak economic dataXAUUSD rises due to tariff wars and weak economic data
Gold climbed to 3,380.00 level on August 7, hitting a two-week high, as renewed U.S. tariff threats and expectations of Federal Reserve rate cuts in September and December boosted its appeal. President Trump announced 100% tariffs on imported semiconductors (excluding U.S.-made), 25% on Indian imports, and 50% on select Brazilian goods. Additionally, Weak U.S. economic data and a cooling labor market further support gold’s rise.
Technically, price has formed the Pennant chart pattern right below the local resistance of 3,380.00. Further breakout of the level and ascending towards 3,440.00 level is expected in short-term.

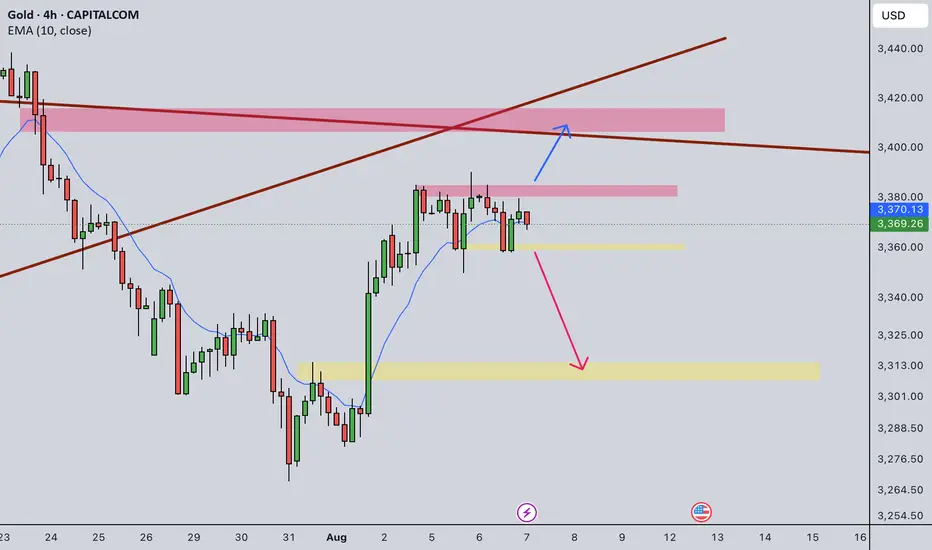
Gold Intraday Trading Plan 8/7/2025Gold is trapped in a range from 3357 to 3385 right now. I will look for trading opportunity upon breaking of the resistance or support.
If 3385 resistance is broken, I will buy toward 3417.
If 3357 support is broken, I will sell toward 3315.
Gold: Yesterday’s Surge & Today’s Session StrategyDuring yesterday’s U.S. trading session, gold surged to around 3390 🚀, driven by a series of tariff-related remarks from Trump, Fed personnel changes, and market expectations that the probability of a September rate cut has risen to 91% ⚡️. We successfully took profit near 3355 yesterday, locking in close to maximum gains 💰.
Today’s trading strategy:
Go short at highs during the Asian session 📉
Go long at lows during the European session 📈
Go short at highs again during the U.S. session 📉
⚡️⚡️⚡️ XAUUSD ⚡️⚡️⚡️
🚀 Sell@ 3390 - 3380
🚀 TP 3375 - 3366 - 3356
Daily updates bring you precise trading signals 📊 When you hit a snag in trading, these signals stand as your trustworthy compass 🧭 Don’t hesitate to take a look—sincerely hoping they’ll be a huge help to you 🌟 👇
XAUUSD INTRADAY ANALYSIS – AUGUST 6, 2025Gold OANDA:XAUUSD is currently consolidating around the 3,371 zone after breaking above a descending trendline formed from late July highs. A strong bullish impulse on August 2nd with significant volume suggests renewed buying pressure. Price is now retesting the breakout area — a critical moment to determine if the bullish continuation is sustainable.
- Technical Breakdown:
1. Price Structure & Trendline:
The former resistance at Peak 1 (3,376) is now acting as new support.
A new ascending channel has formed following the breakout.
Price structure is showing higher highs and higher lows, indicating short-term bullish momentum.
2. Fibonacci & EMA:
The Fibonacci retracement of the recent bullish wave (Aug 1–5) aligns the 0.382 and 0.5 zones with strong support around 3,365 – 3,352.
Price is hovering near the EMA20, and a close above this level will further confirm upside potential.
3. RSI Indicator:
RSI is stabilizing around 50–55, reflecting neutral momentum with room for bullish continuation.
- Key Price Levels:
3,352 – 3,365: Major Support (Fib + EMA + previous lows)
3,376 – 3,380: Immediate Support (breakout retest area)
3,390: Minor Resistance
3,438: Bullish Target (Peak 2)
- Suggested Trading Strategy:
Primary Bias: BUY if price holds above 3,365
Entry Zone: Around 3,369–3,372 (retest + trendline confluence)
Stop Loss: Below 3,352
Take Profit: 3,438 (previous peak)
Risk/Reward: ~1:9 (very favorable setup)
- Look for bullish confirmation (e.g., bullish engulfing or pin bar around 3,365–3,370) for a high-probability entry.
- Alternate Scenario:
If price breaks below 3,352 with strong volume, the bullish thesis may be invalidated. In that case, consider short-term short positions targeting 3,320 area.
This chart setup presents a promising trend-continuation opportunity, with technical confluences supporting further upside. As always, wait for clear price action signals before entry and manage risk accordingly.

XAUUSD Still LongThe regression has not broken at this time.....
There appears to be no XAU long-term break in sight right now.

August 6 Gold Price Analysis: Target $3,400 Trading RecommendatAugust 6 Gold Price Analysis: Target $3,400
Trading Recommendations:
Short-Term Day Trading:
1: Watch for a breakout above $3,380-3,400. A successful breakout could signal a bullish trend with a target price of $3,420.
2: Continue to monitor the $3,350-3,360 support level. Buy on dips as long as the price remains above $3,350.
3: Exercise caution when shorting. Gold prices may converge within the $3,360-3,380 range before rising again.
Buy: $3,350-3,360
Stop-loss: $3,340
Target price: $3,380-3,400+
4: This week's trading strategy focuses on buying at low prices.
Conclusion: The gold market is currently supported by multiple positive factors, and the technical outlook is bullish, but caution is advised regarding a break above key resistance levels. Investors should closely monitor Federal Reserve policy developments and geopolitical developments.
Latest News, Policy, and Technical Analysis
I. News and Policy
The probability of a September Federal Reserve rate cut has soared to 92%.
Weak employment data has weakened the US dollar, bolstering the appeal of gold as an interest-free asset.
Trump's tariff policy has heightened market uncertainty.
US President Trump announced new tariffs on Canada, Brazil, India, and other countries. Escalating trade frictions have heightened risk aversion, supporting gold's status as a safe-haven asset.
Trump also stated that he would "significantly increase tariffs on Indian goods imported into the United States within the next 24 hours" and planned to impose additional tariffs on semiconductors and pharmaceuticals, further exacerbating market volatility.
Federal Reserve personnel changes have raised concerns about policy credibility.
Federal Reserve Board member Kugler has resigned, and Trump will nominate a new member.
The market is concerned that the Fed's independence may be undermined, exacerbating monetary policy uncertainty.
Trump recently announced that he has narrowed the field of candidates for Federal Reserve Chair to four, with Treasury Secretary Bensonant explicitly declining the position.
Geopolitical risks are supporting gold prices.
The ongoing conflict between Russia and Ukraine, tensions in the Middle East, and Trump's "deadline" rhetoric targeting Russia have all contributed to some inflows into the gold market.
Gold ETF Holdings Rebound
Holdings of the world's largest gold-backed ETF (SPDR Gold Trust) increased by 1.72 tons to 954.80 tons from the previous trading day, indicating increased bullish sentiment among institutional investors towards gold.
II. Technical Analysis
Short-Term Trend (4-Hour Chart)
Gold prices found support near $3,325. After breaking through the key resistance level of $3,350, they have stabilized above the 100- and 200-day moving averages.
Key Resistance: $3,380-3,390; a break above this level could challenge the $3,420-3,440 range.
Key Support: $3,365 (short-term trendline); a break below this level could test the $3,350-3,340 range.
Positive factors: Expectations of a Fed rate cut, geopolitical risks, intensified trade frictions, and increased holdings of gold ETFs.
Potential risks: Gold prices could correct if US economic data is unexpectedly strong or the Fed delays a rate cut.

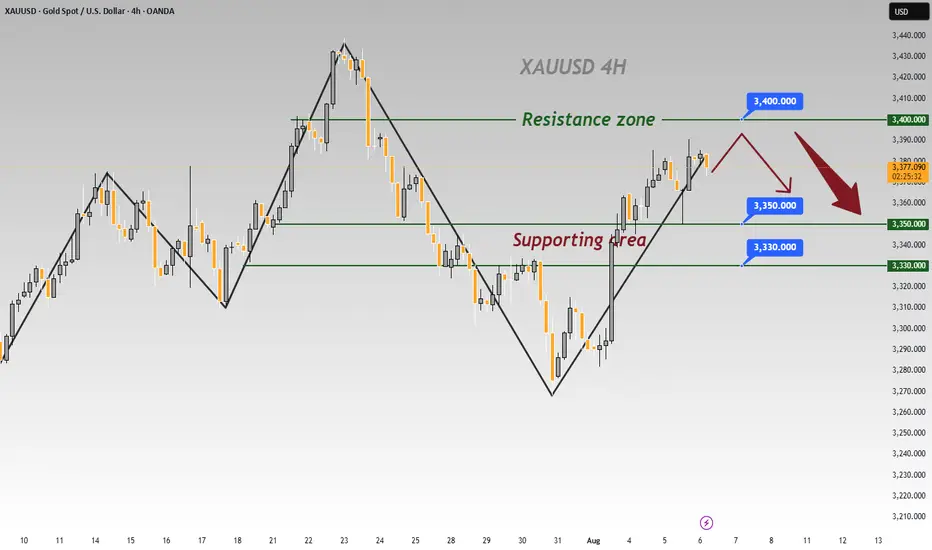
XAUUSD Critical movement !!!The 3351 4h frame was so critical as I said and showed the movement will make the decision.
Flying now with
tp : 3385
tp:3400
tp : 3413
Better wait for another confirmation on the breaker block 3370 closing above it with green candle . push the price higher as showed

Gold (XAU/USD)Gold (XAU/USD) — price rejected resistance zone (~3380), potential move towards 3223 support.
#XAU

Gold (XAU/USD) Technical Analysis:Gold began a corrective move with today’s market open and is currently testing the $3,350 support zone, with further downside potential toward $3,310.
🔹 Bearish Scenario:
If the price breaks below $3,350 and holds, a continued correction toward $3,310 is likely.
🔹 Bullish Scenario:
If the price breaks above $3,365 and sustains momentum, it could open the way toward $3,390, and with further bullish pressure, extend to $3,430.
⚠️ Disclaimer:
This analysis is not financial advice. It is recommended to monitor the markets and carefully analyze the data before making any investment decisions.

XAU / USD 4 Hour ChartHello traders. I just figured while I am at the computer to post the 4 hour chart now. We can see that we are coming into an area where we will either reject if support forms, or keep pushing down a bit more. We have ISM news here in the US at 10am est. I will update / post any scalp trade set ups on a lower time frame in a bit. Be well and trade the trend. Shout out to Big G. Happy Tuesday

uptrend for GOLD ?According to the chart, we have an ascending channel and the RSI indicator is also in the ascending channel.
Considering the data on the tension between China and Taiwan and the tariff and oil wars between the United States and China, Russia, India, etc., the possibility of gold growth is not far from imagination.

Gold Analysis and Trading Strategy | August 5✅ Fundamental Analysis
🔹 Rising Geopolitical Risks: Military tensions between the U.S. and Russia are escalating in Eastern Europe, while the humanitarian crisis in the Middle East continues to intensify. This has heightened risk-off sentiment and supported demand for gold as a safe haven.
🔹 Tightening Global Trade Conditions: The U.S. has announced new tariffs on imports from countries such as Switzerland and India, raising concerns over global supply chains. This has triggered risk aversion and prompted capital to flow into safe-haven assets like gold.
🔹 Weaker U.S. Dollar: The U.S. Dollar Index has fallen to 98.786, hitting a new short-term low and providing a favorable monetary environment for gold.
🔹 Upcoming Data Impact: Market participants are closely watching today’s release of the U.S. July ISM Non-Manufacturing PMI. A weaker-than-expected reading could further weigh on the dollar and help push gold through key resistance levels.
✅ Technical Analysis
🔸 The market is currently in a post–non-farm payroll recovery phase. Gold prices have continued rising without a meaningful pullback, which suggests that the rally is being driven by momentum. However, such slow and steady gains often precede short-term corrections as bulls may begin to take profits. Caution is warranted for potential volatility or reversal at higher levels.
🔸 On the hourly chart, gold remains within an upward channel, although bullish momentum is gradually weakening. Yesterday’s low around 3345 serves as a key support level, while the 3385–3390 zone is a crucial short-term resistance. A retest of this area could lead to a modest pullback.
🔸 On the 30-minute chart, early signs of a potential top are emerging. Technical indicators are in overbought territory, and candlestick behavior shows price stalling near highs. A possible double-top pattern is forming around 3385. If the price breaks below the neckline at 3370, the pattern would be confirmed, opening up short-term downside potential.
🔴 Resistance Levels: 3385–3390 / 3400–3405
🟢 Support Levels: 3370–3360 / 3345–3335
✅ Trading Strategy Reference:
🔻 Short Position Strategy:
🔰Consider entering short positions in batches if gold rebounds to the 3385-3390 area. Target: 3370-3350;If support breaks, the move may extend to 3340.
🔺 Long Position Strategy:
🔰Consider entering long positions in batches if gold pulls back to the 3340-3345 area. Target: 3365-3375;If resistance breaks, the move may extend to 3385.
🔥Trading Reminder: Trading strategies are time-sensitive, and market conditions can change rapidly. Please adjust your trading plan based on real-time market conditions. If you have any questions or need one-on-one guidance, feel free to contact me🤝

Analysis for the CPI News
Good Morning Traders,
Here is my analysis for the CPI News, as you seen the waterfall of gold, price has filled the FVG according to the D1 time frame, there is SSL, the price can hit the SSL and can fly during the news impact, here is our trade entry, Stop loss and Target.
Good Luck Mates!!

XAUUSD Analysis – August 12 – 4H ChartOn the 4H timeframe, gold is forming a Bullish Harmonic structure (likely a Gartley or Bat pattern), with point D appearing around the strong support zone 3,349 – 3,346 USD, aligning with the 0% Fibonacci level and previous swing low.
1. Technical Breakdown
Harmonic Pattern:
A → B: Strong bearish leg.
B → C: Retracement to the 61.8 – 78.6% Fibo zone.
C → D: Decline to the 88.6 – 100% Fibo zone, touching a strong support area and giving potential reversal signals.
Fibonacci Retracement Key Levels:
50%: 3,352 USD.
61.8%: 3,353 – 3,354 USD.
78.6% – 88.6%: 3,355 – 3,356 USD (near-term resistance target).
Volume: Bullish wick candles at point D with higher volume, indicating bottom-picking activity.
EMA: Price is currently testing the short-term EMA; a successful breakout could open the way toward higher resistance levels.
2. Trading Scenarios
Scenario 1 – Buy following the Harmonic pattern (Preferred):
Entry: 3,349 – 3,350 USD.
Stop Loss: 3,343 USD (just below point D by ~6–7 USD).
TP1: 3,352 USD (Fibo 50%).
TP2: 3,355 USD (Fibo 61.8%).
TP3: 3,358 USD (major resistance + Fibo 78.6%).
RRR: ~4.8 as seen on the chart, suitable for short-term swing setups.
Scenario 2 – Sell against the pattern (High Risk):
Only consider if price breaks strongly below 3,343 USD with high volume.
Target: 3,338 – 3,335 USD.
3. Key Notes
Prioritize buying as long as price holds above point D with bullish confirmation on H1–H4 timeframes.
If price rallies but fails to break above 3,355 USD, consider partial profit-taking and moving SL to breakeven.
Risk management: limit to 1–2% per trade, avoid FOMO entries.
