XAUUSDPrice action trading is a methodology where traders make decisions based on the interpretation of actual price movements on a chart, rather than relying primarily on lagging indicators. It involves observing and analyzing candlestick patterns, trend lines, support and resistance levels, and volume to identify potential trading opportunities and manage risk. The focus is on understanding the story the market is telling through its price behavior.
XAUUSD trade ideas

Gold’s Pullback: Fueling the Next Surge Toward 3390-3400Today is the first trading day of this week. Gold has continued to fall since the opening, and has reached a low of around 3364 so far. Through the short-term trend, we can see that gold has insufficient willingness to continue to rise above 3400 and still faces considerable resistance. It needs more support and momentum to drive it forward before it can continue to rise. Currently, gold continues to retreat to around 3364. Has the trend of gold turned into a bearish trend? I think it's too early to draw such a conclusion!
Although gold has fallen significantly, there is still strong buying support below. The 3360-3350 area has become a key support level. As long as gold does not fall below this area, the bullish structure has not been completely broken. Therefore, there is still sufficient energy for gold to continue its rebound. This decline in gold is intended to increase liquidity and accumulate more upward momentum, which will help gold stabilize at 3400 and move towards higher targets!
Therefore, for short-term trading, I think we can still continue to try to go long on gold, but after all, the decline in gold has been so large. For short-term trading, we can appropriately lower the rebound expectations to the 3380-3390 area.

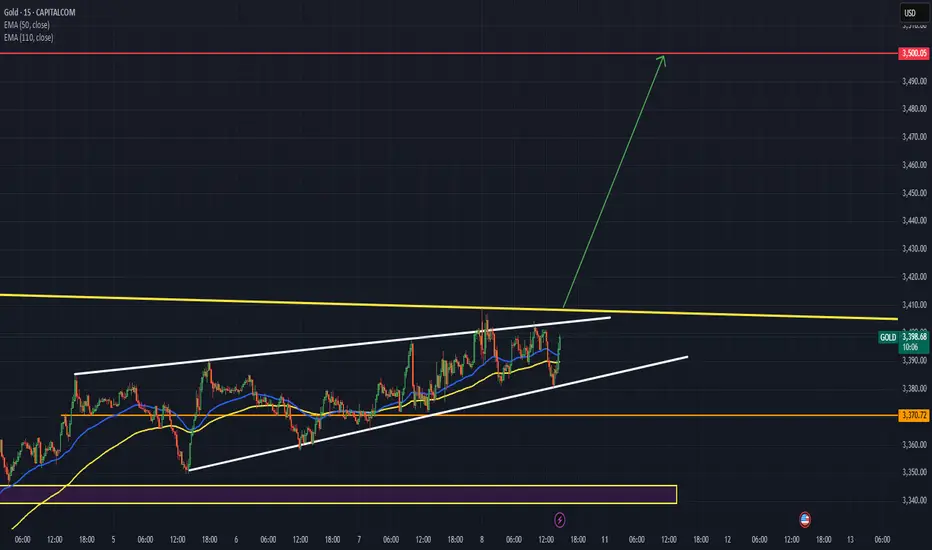
Rising Channel The price formed a rising channel followed by a false break then a breakout and pullback, now the price looks to go short
WE ONLY TRADE PULLBACKS

XAUUSD (Gold) price is ranging between 3248-3428 from April 2025XAUUSD (Gold) price is ranging between 3248-3428 from April 2025 to date, 11th August 2025.
Key level for selling 3380-3428 (before placing an order, must watch the daily candles and H4 for better understanding).
Gold overall has strong bullish momentum. In my view, gold is consolidating at the levels, but in the coming days, any new geopolitical event or any conflict in any country of the world will lead to more bullish momentum in gold.
As I mark it, buying gold is more safe and profitable in current situations, but keep in mind you must have the up-to-date geopolitical events and economic news.
If the price gets ranged and touches 3355, and you see any rejection candles after that and a strong confirmation candle, then you should place a buy trade with proper stop loss and take profit.

Gold Market Weekly Outlook📊 Gold market opens ahead of weekly candle formation, sweeping through imbalance at the 3360’s. The weekly stance remains bullish, with momentum building toward a potential break of the 3420’s supply zone.
🟡 Key Watch Points:
Imbalance Cleared: 3360’s
Weekly Target: 3420’s
Bias: Bullish continuation if price holds above 3360’s

Gold Analysis: Time to Take Long for short durationThe Liquidity sweep has been done by institutions, and the market will bounce back hopefully.
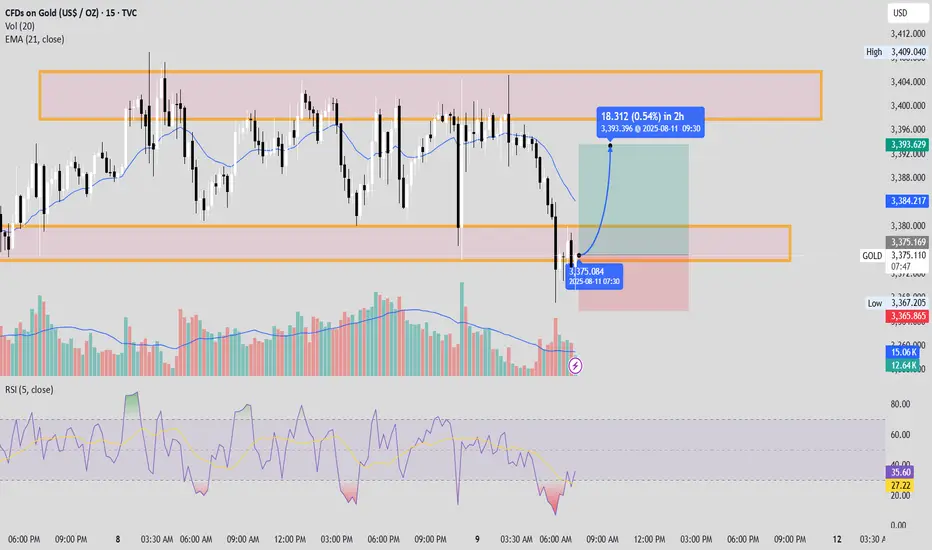
8/11: Sell High and Buy Low in the 3416–3372 RangeGood morning, everyone!
This week’s major data releases and news events are concentrated between Tuesday and Friday. Monday is relatively calm, so today’s strategy will mainly rely on technical analysis.
Technically, after a pullback to the MA20, last week’s weekly candle closed as a small bullish candle, and price has re-entered the strong resistance zone at 3400–3450. On the daily chart, bullish momentum hasn’t been fully released yet, but the 4H chart is showing early signs of bearish pressure. For today, keep an eye on the 3400–3420 resistance area, with primary support at 3386–3378 and secondary support at 3372–3366. Unless the bulls completely give up, a break below secondary support seems unlikely.
The main trading range for today is 3372–3416. If the market turns into a one-way move, consider a “contrarian” approach — just avoid buying high and selling low. If you find yourself in a trapped position, don’t panic. As long as risks are controlled, you can use scale-in entries or hedging to recover. If your trade rhythm is off, even holding onto positions (“sitting it out”) can reduce losses or turn a profit. Of course, if risk gets out of control, cut losses decisively — better to retreat than to blow up the account.
Account safety always comes first. Keep your capital intact, and you’ll find plenty of profitable opportunities this week — so many, you might start wondering if someone added extra days to the calendar.
If you need assistance, feel free to leave me a message.

XAU/USD – Rising Wedge Near Supply – Possible PullbackTimeframe: 1H | Broker: OANDA
Gold is trading inside a rising wedge after rallying from the $3,345–$3,355 demand zone. Price is now testing the upper wedge boundary near a supply zone at $3,405–$3,410.
Key Points
Multiple CHoCH & BOS show mixed sentiment; latest BOS hints at seller pressure.
Volume spikes on down moves indicate active selling at $3,400.
Demand zones below: $3,375–$3,365 and $3,355–$3,345.
Scenarios
Bearish (Favored): Rejection from $3,400–$3,410 could trigger a drop.
Targets:
$3,375 (first liquidity zone)
$3,355 (equilibrium zone)
$3,324 (major support)
Bullish: Break & retest above $3,410 → Targets $3,425–$3,440.
Plan
Short on wedge rejection or breakdown; SL above $3,415.
Long only if breakout holds above $3,410.

Diagonal doradaGold has completed the projection I had for a contracting diagonal. I see a very possible deep correction, the last of the cycle, as I mentioned. I feel this move is very positive for a bullish gold price in the future. We will likely surpass 3400. The gold metal is possibly giving us one last opportunity to buy low and sell high.
The coefficients are converging, the movement is precise, the indicators are screaming. We saw this move two weeks ago; it has developed perfectly, and only time will tell if we were right.
A range from 3340 to 3300 would be the perfect buying zone, unmissable in my personal opinion. We will be attentive to buying.

I see a Bullish momentum to reach the old time high!Gold confirming bullish momentum. The breakout signals strong buying pressure, with price action targeting the previous all-time high. Sustained volume and favorable macroeconomic conditions are supporting the upward move, indicating potential for further gains if momentum holds.
XAUUSD LONG PositionGold has been ranging for a while now, looking at Mr. America tariff race. We look gold to push Further up with no Compromising area of reversal.

GOLD: Long Trading Opportunity
GOLD
- Classic bullish setup
- Our team expects bullish continuation
SUGGESTED TRADE:
Swing Trade
Long GOLD
Entry Point - 3372.6
Stop Loss - 3367.3
Take Profit - 3383.4
Our Risk - 1%
Start protection of your profits from lower levels
Disclosure: I am part of Trade Nation's Influencer program and receive a monthly fee for using their TradingView charts in my analysis.
❤️ Please, support our work with like & comment! ❤️

XAUUSD: Market Analysis and Strategy for August 7Gold Technical Analysis:
Daily Chart Resistance: 3430, Support: 3335
4-Hour Chart Resistance: 3400, Support: 3358
1-Hour Chart Resistance: 3400, Support: 3368.
Yesterday's pattern for gold was similar to the day before. Following a volatile decline in the Asian session, the New York market bottomed out and rebounded at support levels. The market is still maintaining a volatile upward trend, with rising lows, a step-by-step rise. Short-term adjustments won't affect the overall market trend. Today's strategy is undoubtedly to follow the trend and buy low!
Currently, the hourly chart lows are rising, from 3345 to 3350, and then to 3358. Today's Asian session low is 3365. Therefore, until 3365 is broken, there is a buying opportunity on the dip. Consider yesterday's low of 3358 as a defensive buying position for a bullish outlook.
BUY: 3390near
BUY: 3368near

Daily Analysis- XAUUSD (Thursday, 6th August 2025)Bias: Bearish
Notes:
- Daily consolidating after Friday spike up
- Looking for price to retrace back down to daily structure
- Potential SELL if there's
confirmation on lower timeframe
- Pivot point: 3390
Disclaimer:
This analysis is from a personal point of view, always conduct on your own research before making any trading decisions as the analysis do not guarantee complete accuracy.

Correction first and then rise during the day, TP3400Yesterday, gold hit the bottom near 3350 and then quickly rose to break the high. It fell back slightly in the evening and closed with volatility. The daily line closed with a long lower shadow bullish line. The short-term correction process has been completed, and there is still momentum for an upward impact. The overall structure is still a bullish trend. Focus on 3365-3355 below. As long as the bullish thinking above this level remains unchanged, any decline will provide an opportunity to enter the market. The target can be around yesterday's high of 3390. Once it breaks through 3390, the gold price is expected to reach 3405-3415.
OANDA:XAUUSD

GOLD CONSOLIDATION BEFORE FURTHER GROWTHThe ISM report released last night showed weak data, which further strengthens the bullish outlook for GOLD. The price moved from 3350 to 3390, starting its rise a few hours before the news and peaking shortly after the data was released.
Currently, GOLD is consolidating with 3375 acting as a key support level. As seen on the chart, the price is holding above this zone.
In this kind of market condition, I usually apply a range trading strategy. It helps minimize risk since stop-loss levels are placed close to the entry. However, it's worth noting that this approach is susceptible to fake breakouts.
The current tight range is between 3378 (buy zone) and 3385 (sell zone), with each boundary serving as a potential target. Stops can be placed slightly below support or above resistance levels.
Alternatively, you can set pending STOP orders at both ends of the range to catch any potential breakout or breakdown. Using STOP LIMIT orders is also a viable strategy in this scenario.

Gold Intraday Trading Plan 8/6/2025In 12hrly TF, gold seems to form bullish continuation pattern. Therefore, I will be cautious in engaging selling orders today.
For today's trading plan, I will only sell if 3350 is broken. I will buy if there is rejection from 3350 or if 3385 resistance is broken.
GOLD: Bulls Testing the Top of the RangeGold is attempting to break above the well-established horizontal resistance near $3,430, which has capped price action since April. The metal continues to respect its ascending trendline from the December 2024 low, supported by the rising 50-day SMA ($3,344). The lower boundary of the consolidation range is marked near $3,245, making this a textbook triangle/range structure within a broader uptrend.
Momentum indicators support the bullish case:
MACD has crossed bullish above the signal line, although still near the zero line.
RSI is rising and sits at 55.46, showing room for further upside before entering overbought territory.
If bulls succeed in securing a daily close above $3,430, this would confirm a bullish breakout from multi-month consolidation, potentially opening the door to a fresh leg higher. On the downside, any failure to break out cleanly may lead to a retest of the ascending trendline and the $3,245 support area.
Summary:
Gold remains in an uptrend and is challenging the top of a 4-month range.
Break above $3,430 would signal bullish continuation.
MACD and RSI both point to building momentum.
Support lies at $3,344 (50 SMA) and $3,245 (range low).
Patience is key here—traders may wait for confirmation of a breakout or watch for rejection candles near resistance to determine the next directional bias.
-MW

TRADE UPDATE XAUUSD Hey everyone at the start of the week we was waiting to see if price would pullback to 3,250 zone to take buys after price missed our entry just a little bit of pips if you check out my last few posts but my projections for Gold is that price might be heading to 3434 zone and can’t see a pullback to our area of interest and if price get to the 3434 zone I will be waiting to see if sellers would jump in or I wait for a breakout so I will update you guys before the week ends or if am about to execute a trade….

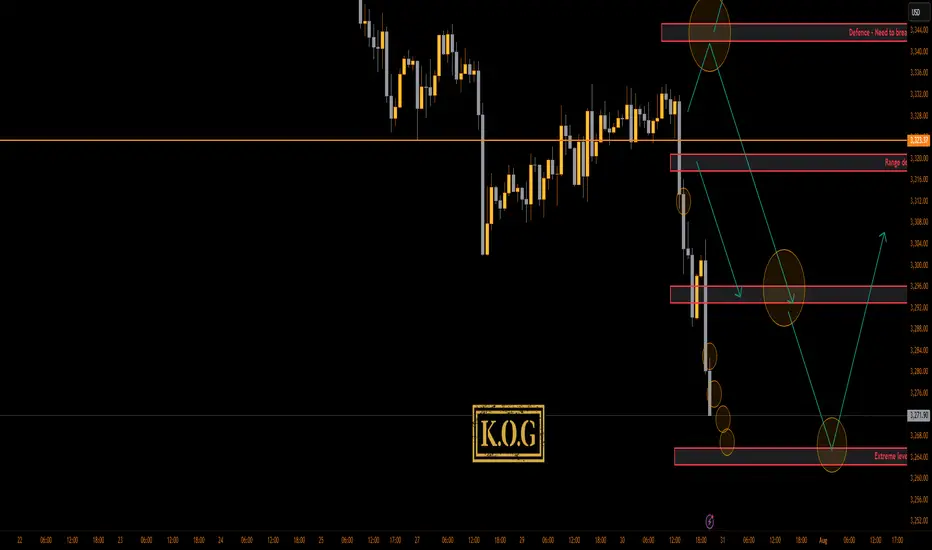
THE KOG REPORT - UpdateEnd of FOMC Update:
Thank you.
RED BOX TARGETS:
Break above 3335 for 3338, 3340, 3345, 3347 and 3357 in extension of the move
Break below 3320 for 3310✅, 3306✅, 3302✅, 3297✅ and 3393✅ in extension of the move
Please do support us by hitting the like button, leaving a comment, and giving us a follow. We’ve been doing this for a long time now providing traders with in-depth free analysis on Gold, so your likes and comments are very much appreciated.
As always, trade safe.
KOG
GOLD is Flying High, I won't miss the rocketConfirmation:
If 4H price action closes above Previous Day's High (PDH), I will be looking for longs.
Within my Area of Opportunity (AoO), I have outlined targets with their success rate.

Bullish Momentum Ahead? XAAUSD Price to Watch!The market just closed above 3,353 , which is our BOS and RBS level. It was previously a resistance, then became support, and now it's being tested as resistance again. Looking at how gold moved last week, it came really close to the major resistance area I had marked. Unfortunately, it didn’t quite reach my pending order, which was set just a bit lower.
After reviewing the price action, I noticed that gold reacted to an order block before making its move upward. Luckily, we managed to catch a nice HnS sell setup & the golden zone fibo I had marked earlier, using my trusted golden Fibonacci levels. They’ve consistently delivered reliable entries.
Looking ahead to the upcoming week, I’ll be using the same golden fibo setup. The market is showing a clean pattern, and I’ve already mapped out a solid entry zone. The zone is fairly wide, but with proper risk management and entry layering, there’s definitely good potential for profit .
Let’s see how things play out next week. That’s all from me for now. If you found this helpful, feel free to like and follow for more analysis.

XAUUSDXAUUSD Basically Trend
RPrice has formed strong support above 3350 and upcoming US CPI + volatility in the US session could drive upward momentum.
Trade Plan:
Buy Trigger: Above 3445.
Invalidation: If price breaks below 3340 / 3330 support zone.
If I were to frame this as a clean intraday plan, it would look like:
Since CPI tends to cause fast spikes and reversals, the key risk here is slippage. Best to wait for a confirmed break & retest above 3445 before entering — otherwise it could be a fakeout.
