XAU move sideways, awaiting US CPI todayGold prices declined amid the extended US-China tariff truce, yet they remain highly volatile ahead of today's US CPI data.
The market anticipates the July US CPI to rise to 2.8% from May's 2.7%, with Core CPI also expected to increase to 3.0% from 2.9%. Higher inflation could reduce the odds of a Fed rate cut, strengthening the dollar and pressuring gold. Conversely, a larger-than-expected inflation increase could fuel stagflation concerns, potentially supporting gold prices.
Another factor that could support gold is the meeting between US President Trump and Russian President Putin this week in Alaska. A lack of a final agreement to end the war in Ukraine could prompt the US to increase sanctions on Russian goods, which could further exacerbate gold prices.
Technically, XAUUSD is trading in a tight range, holding above the 3345 support level and below its EMAs (21, 78), suggesting a continuation of sideways movement. A breach below 3345 could see the price retest next support at 3285, while a sustained hold above this level could prompt a correction towards the 3402 resistance.
By Van Ha Trinh - Financial Market Strategis at Exness
XAUUSD trade ideas

XAUUSDXAUUSD Basically Trend
RPrice has formed strong support above 3350 and upcoming US CPI + volatility in the US session could drive upward momentum.
Trade Plan:
Buy Trigger: Above 3445.
Invalidation: If price breaks below 3340 / 3330 support zone.
If I were to frame this as a clean intraday plan, it would look like:
Since CPI tends to cause fast spikes and reversals, the key risk here is slippage. Best to wait for a confirmed break & retest above 3445 before entering — otherwise it could be a fakeout.

Gold prices fluctuated significantly. Here comes the analysis.Last week's volatile rise in gold wasn't entirely smooth, with several minor pullbacks. However, each pullback was relatively limited, and upward momentum quickly resumed, resulting in an overall step-by-step upward trend. This trend shows that the bulls had a certain advantage at the time and buying was relatively active.
But the market situation on Monday took a fundamental turn. After the Asian market opened, the price of gold began to fall under pressure, with selling pressure continuing to emerge during the session and buying power clearly insufficient. By the close of trading, prices had fallen sharply, not only giving up all of last week's gains but also breaking through multiple moving average support levels in one fell swoop. From a technical perspective, the uptrend line on the daily chart has been effectively broken, signaling the initial formation of a short-term downtrend and a clear sign of weakening.
On Tuesday, watch closely to see if the downtrend continues.
If the price can find support near yesterday's low of 3341 and rebound above it, then we need to pay attention to the resistance near 3365, 3375 and 3385 on the upside.
If the market continues to fall, then the support around 3340 and 3330 should be watched below. This range is the second rising position after the impact of non-farm payroll data.
Strategy:
Short around 3365, stop loss at 3375, profit range 3340-3320
Long around 3330, stop loss at 3320, profit range 3340-3465

xau usd a sweep above is expected soona sweep above is expected soon . market can go and sweep london high then it can go sell again towards 3325


XAUUSD: Buy ideaOn XAUUSD we are in a bearish trend currently. This drop could reach 3270.
Furthermore, once this level is reached, XAUUSD will be able to take off to reach 3500.

XAUUSD MONDAY MANIPULATIONXauusd takes the low off pm sessions and we let to run in in a high of Pm session NYC time
it feels look like clean and will be fast to rebalance and take the fridays high.

XAUUSD falls on easing geopolitical tensionsXAUUSD falls on easing geopolitical tensions
Gold fell below 3,380.00 on August 11 as reduced geopolitical tensions weakened its safe-haven appeal, following President Trump’s announcement of an August 15 meeting with Putin in Alaska to discuss ending the Ukraine war, potentially avoiding new U.S. sanctions on Russia. Losses may be capped by ongoing trade concerns, expected Fed rate cuts, and uncertainty over U.S. tariffs on gold bars after a recent agency ruling.
Technically, XAUUSD failed to hold an intermediate 3,380.00 level and develop a bullish momentum towards 3,440.00, which means the start of the sideways market in the asset. Next possible target is 3,000.00 level.

Gold: tariffs confusionGold prices continued with an uptrend during the previous week, closing the Fridays trading at the level of $3.398. However, the most important information that shook the market sentiment was a potential for U.S. tariffs on gold imports. Namely, last week the U.S. Administration imposed a 39% tariffs on imports from Switzerland, while the Swiss Precious Metals Association commented that gold was not exempted from it. The White House commented on the issue, noting that next week it will issue an executive order clarifying this “misinformation”, as they called it.
The RSI continues to move above the level of 50, indicating a potential move toward the upside in the coming period until the overbought market side is reached. The MA50 modestly slowed down its divergence from MA200, but two lines are moving in parallel with an uptrend. A potential for a cross is still not indicated on charts.
The week ahead should bring the clarification from the U.S. Authorities whether the gold is affected with tariffs or not. This might imply a modest decrease in the price of gold, in case that it is exempted from the application of imposed tariffs. In this sense, the gold might ease till the level of $3.360, as per current charts. Still, regardless of tariff application, charts are pointing toward the probability of higher grounds for the price of gold. The concrete catalyst for such a move is unknown, but it should be considered that the US July inflation data is scheduled for a release in a week ahead. Any surprises in inflation figures might push the US Dollar to lower grounds and the price of gold to higher.

Excellent profits 200 pips TP on opening session As I mentioned Today's early commentary session:
My strategy is sell from 3402–3405.
Very happy with the profits so far, multiple trades at 3400-3402
I sold GOLD 3402 – 200 PIPS TP
• 1st SETUP of week
Always follow your setup & your path with patience and discipline.
My targets is achieved alhumdullilah.
All I say thanks to those who followed us and made profits.

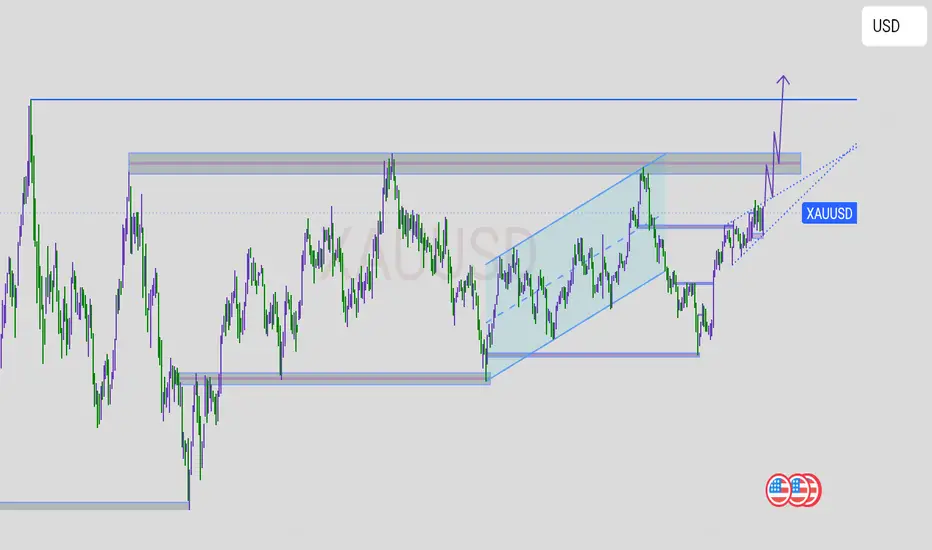
Gold – Weekly Retest for New HighsFollowing a break and retest on the weekly, gold is eyeing another run at all-time highs. Watching for a move back into the weekly trend line with stops under the fair value gap, targeting a breakout to fresh highs.

Gold is still bullish we are going bullish still, lets push it to the resistance level, vote for long trade on gold, if you against me drop your opinion
Short idea! Ideal zone!Hello all. In my idea market is near a very special zone, it is ideal for going short. R:R is 7.4 that is not bad. After my last position went failed, I tried to fix the bug in my method and I finally found it. Lets see what happened.(wink)

short sharinghow and what to expect and where to trade
gold is ranging between 3400-3380.
break either would be a good ride to trade.

GOLD: Buy Dips Into DemandBuy the dip!
(H4) ✅ Bullish
Formed HL at 3355, strong displacement up from that zone
Current leg is targeting buy-side liquidity above 3432 and 3445
Unmitigated H4 demand: 3380–3388
(H1)
Series of HHs & HLs
Key Zone: 3380–3388
Next liquidity target / short-term resistance: 3432-3445
Wait for pullback into key zone or momentum break above 3405
(M15)
Micro bullish structure intact
Current short-term demand:3390–3395
Deeper demand: 3380–3388
Execution Triggers
Pullback Buy: Sweep 3380, M15 BOS above 3392, enter on retest
Breakout Buy: Break & close above 3405 with displacement, retest 3395–3400
❌ Invalidation
Break below 3355 = bullish structure compromised
Break below 3322 = trend shift to bearish

Gold (XAU/USD) Technical Analysis | August 8, 2025📊 Gold (XAU/USD) Technical Analysis | August 8, 2025
Gold price has reached the midline of the channel in the 4H timeframe and reacted to it, forming a descending trendline afterward.
🔻 Bearish Scenario:
If the price rejects from this area, the next downside targets will be:
3382.71
3375
3370
🔺 Bullish Scenario:
If the descending trendline and the channel’s midline are broken decisively with confirmation, the next upside targets will be:
3413
3423
📌 Conclusion:
The reaction to the channel midline and whether this zone holds or breaks will determine gold’s next move. Traders should closely watch these key levels for potential opportunities.

Gold Spot (XAU/USD) Analysis – 30-Minute TimeframeGold Spot (XAU/USD) Analysis – 30-Minute Timeframe
At present, the price is fluctuating within a range between a key support zone and a key resistance zone. The overall market structure has taken on a ranging pattern, and traders are waiting for a breakout from either side.
🔹 Bullish Scenario: A breakout and consolidation above the current resistance could lead to a move toward higher resistance levels and eventually the main supply zone.
🔹 Bearish Scenario: A breakout and consolidation below the mid-range support could trigger a decline toward lower support levels and even a retest of recent lows.
Given the current situation, the price reaction to these zones will likely determine the next market direction.

No Trade in Aug Is it true [XAUUSD]After few days gold is stuck in selling zone as PW is bearish gold should take PDL and move ahead it soon will it happen.
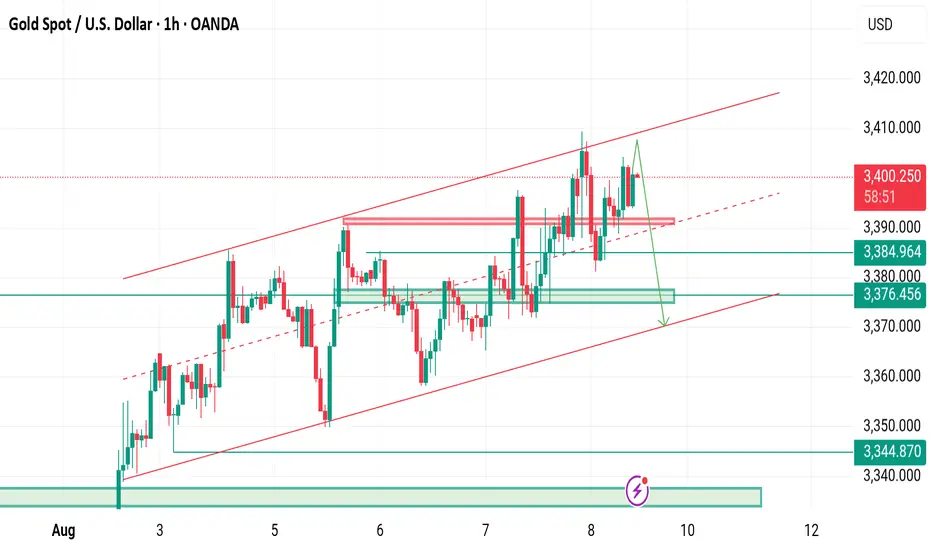
XAUUSD is on rising channel H1-H4 TIMEFRAME SETUP
Currently XAUUSD is following the rising channel along with flag pattern although I expecting market will fall from 3406-3410 zone.
What possible scenarios we have ?
• Market has to gives closing of H4 below 3390 for the implusive drop ,also I'm on holding sell trade above 3400 and my Targets are 3380 then 3365.
• secondly If gold drops to 3342-3335 thats my Buying area where I will buy XAUUSD in dips and my optimal target will be 3365 then 3380.
Additional Tip:
Above 3410 no sell Trade our rising channel will be invalid as Per SMC (BOS & CHOCH)
XAUUSD Gold Trading Strategy August 8, 2025XAUUSD Gold Trading Strategy August 8, 2025:
Gold prices have approached the 340x area and have fallen sharply to the 338x support area at the beginning of today's trading session.
Basic news: President Trump announced to double tariffs on Indian goods to 50% in response to continued oil imports from Russia. Reports show that Trump may meet with Russian President Vladimir Putin as early as next week.
Technical analysis: Gold prices are currently in an uptrend channel, but the trading range is showing signs of narrowing. The possibility that the price will correct at this 340x area is very high; if the gold price creates a double peak pattern in the H1 frame, the price range of 3375 - 3380 will confirm the pattern and create a strong downward force for the gold price. If gold forms a double top pattern here, this correction could take gold to the 3350 or even 3330 area.
Important price zones today: 3375 - 3380, 3405 - 3410 and 3420 - 3425.
Today's trading trend: SELL.
Recommended orders:
Plan 1: SELL XAUUSD zone 3407 - 3409
SL 3412
TP 3404 - 3394 - 3374 - 3354.
Plan 2: SELL XAUUSD zone 3423 - 3425
SL 3428
TP 3420 - 3410 - 3390 - 3370.
Plan 3: BUY XAUUSD zone 3375 - 3377
SL 3372
TP 3380 - 3390 - 3400.
Wish you a safe, successful and profitable trading weekend.🌟🌟🌟🌟🌟

XAUUSD Wave iv Pullback Buy Plan – Targeting Wave v BreakoutBias
Primary Trend: Bullish – likely in Wave iii of a larger Wave (III).
Current pullback appears to be a minor Wave iv correction inside Wave iii, offering potential re-entry zones before pushing to Wave v and then larger Wave (III) completion.
Buy Limit / Long Entry: Around 3,380 – 3,384
Just above LR / MD zone and trendline support.
Aligns with Elliott Wave structure for a Wave v continuation.

Bearish signs appeared A strong weekly bearish RSI signal is appearing at the consolidation level. According to the market structure, it should retrace to take liquidity from the downside.

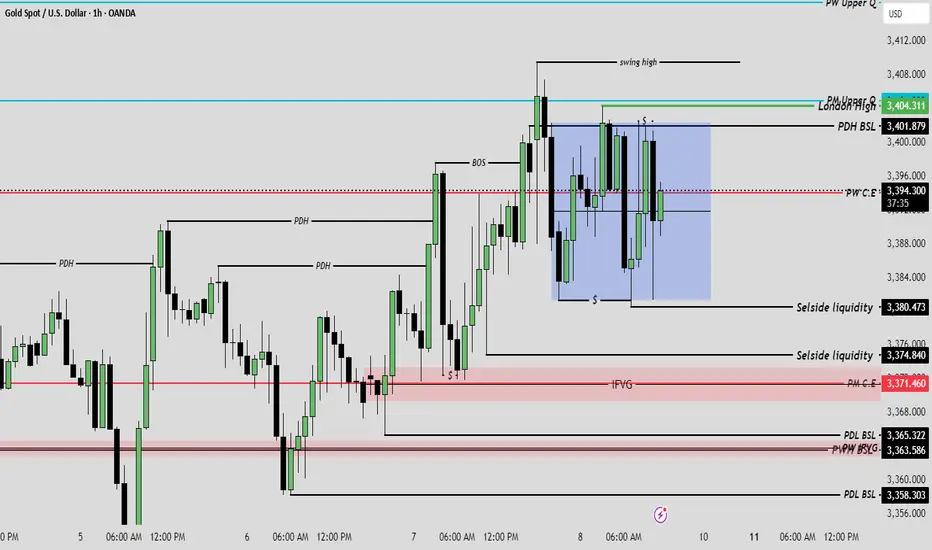
Liquidity Sweep to Drop – XAUUSD Sell Plan🟠 Context Summary
Chart Type: XAUUSD 15M
Pattern Observed: Liquidity sweep and sharp rejection from premium zone.
Label: “Gold Start Melting”
Distribution Zone Targeted
🔽 Sell Plan
✅ Bias: Bearish
📍 Entry Zone (Sell Entry Area):
Entry after price tapped into premium zone (highlighted red box).
Strong bearish engulfing candle confirms rejection.
🎯 Target Zones:
Target 1: 3,368 (top of distribution zone)
Target 2: 3,317 (bottom of distribution zone)
Target 3 (Final): 3,293 (full FVG fill / value area)
⛔ Stop Loss:
Above the swing high that caused the drop.
Suggested: 3,400.50 – 3,403.00
⚙️ Entry Confirmation:
Confirm entry after:
Price closes below small support or consolidation (green zone).
Breakdown retest (if price pulls back).
🧱 Trade Logic
Sweep of Liquidity: Price took out highs and immediately reversed.
FVG Created: Implied institutional selling interest.
Distribution Zone: Forecasting larger move down.
📌 Notes:
Watch for lower timeframe consolidation before continuation.
If price retraces to fill imbalance partially and stalls, consider re-entry.
